 2010, Vol. 53


2. Consortium for Electromagnetic Modeling and Inversion (CEMI), University of Utah, U. S. A
2. Consortium for Electromagnetic Modeling and Inversion (CEMI), University of Utah, U.S.A
Electromagnetic method is one of the effective methods for locating the fault, crush zone and the mineral vein when the resistivity contrast is large enough between the host rock and the material Electromagnetic method is one of the effective filling in the fault or in the vein.
One of the electromagnetic methods, controlled-source audio-frequency magnetelluric (CSAMT) method, is extensively used for the explorations of complex geology structures and ore body [1, 2]. Usually in this method the transmitter injects a square wave current into the ground via the grounded wire.
The fault zone or the mineral vein can be treated approximately as a dyke model because its dimensions are limited. Some geophysicists did a lot of work to study the CSAMT response of a dyke model because it is a typical geological mode[3, 4], however their works only focused on the electromagnetic response to delineate the 2D dyke.
For a 3D dyke, many factors can affect the CSAMT responses for locating the dyke, such as the survey configuration, the amplitude of the EM fields related to the physical parameters of the 3D dyke, and so on. In the paper, we discuss the influences of the survey configuration and the physical parameters of a 3D dyke on the responses of the EM field components.
We used a forward modeling software, which has been developed by the Consortium for Electromagnetic Modeling and Inversion (CEMI) at University of Utah, based on the contraction integral equation (CIE) method[5]. It is well known that the integral equation (IE) method is one of the most accurate techniques to calculate the EM fields of three-dimensional (3D) geoelectrical structures [6~13]. The contraction integral equation method uses the modified Green's operator with a norm less than one, and it makes the iterative solution to be uniform convergence.
In the current paper, we first summarize the CIE method. Then we simulate the 3D EM fields of a 3D conductive dyke using the CIE method in order to investigate the optimal survey configuration which is most sensitive to a 3D conductive dyke. Also, we discuss the detectability of the conductive dyke with the optimal survey configuration and test some physical parameters of dyke.
2 Contraction Integral Equation (CIE) MethodThe electromagnetic fields in certain model can be presented as a sum of background fields and anomalous fields:

|
(1) |
where the background field Eb and Hb are the fields generated by the given sources in the model with the distribution of background complex conductivity 

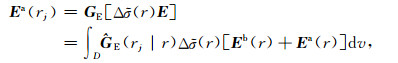
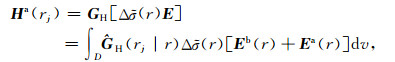
The anomalous fields can be expressed as an integral over the excess currents in inhomogeneous domain D [6, 8]:
|
(2) |
|
(3) |
where GE and GH are the electric and magnetic Green’s operators; 


The equation (2) can be converted into a contraction operator-based equation. Following the notations of Zhdanov and Fang[12], the anomalous field equation (2) can be rewt itten as
|
(4) |
where
|
(5) |
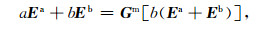
and operator Gm (x) is defined as a linear transformation of the original electric Green's operator and is called the modified Green's operator:

|
(6) |
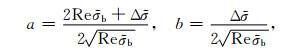
where Re 

Equation (6) can be rewt itten with respect to the product of a and the total electric field E,

|
(7) |
where 

|
(8) |
In the equation (9) operator C is called a contraction operator for any lossy media by Zhdanov [12].
Using the original Green’s operator given by the expression (2) and taking into account formula (6), after some transformation (consider equation (5)), the final form of the contraction integral equation with respect to the scaled electric field 

|
(9) |
In the right side of equation(9), 

The cross section of the dyke model is shown in Fig. 1. The background medium includes two layers, the resistivity and thickness of the first layer (overburden layer) are 30 Ωm and 20 m, respectively, and the resistivity of the second layer is 5000 Ωm. The dyke of resistivity 200 Ωm is embedded into the second layer. We assume the origin of the coordinates is located above the center of the dyke and on the ground surface, x- axis is orthogonal to the strike of dyke, x-, y- and z- axis are clockwise. The size of dyke in x-, y- and z- directions are 50 m, 200 m and 600 m, respectively.

|
Fig. 1 The cross section of dyke model |
Four survey configurations have been designed, and the plan views are shown in Fig. 2(a~d). The transmitter injects a square wave into the ground via an earthed wire 1 km in length. 186 receivers spaced 50 m are distributed evenly on 6 lines to record the electromagnetic field. The offset of the transmitter center to the receivers system is about 5 km. The survey frequencies we used in the forward modeling are 4 Hz, 512 Hz and 4096 Hz.

|
Fig. 2 The plan view of different survey configurations and the comparison of anomalous/total field calculated by different configurations when the survey frequency is 512 Hz. The CSAMT response in (e~f) are corresponding to configuration 1~4, respectively |
As shown in Fig. 2(a~d), the receivers’ location above the dyke are fixed in the four configurations, however, the transmitters locate at different positions or directions, Fig. 2a and 2c are equator configurations, and Fig. 2b and 2d are axis configurations.
3.3 Forward Modeling ResultThe total fields and anomalous fields of all the six field components are calculated in the forward modeling. The total fields can be treated as the data observed in the fieldwork. The anomalous Helds are the scatter fields.
Figure 2(e~f) show the contour maps of the anomalous fields and of the total fields for the four different survey configurations when the survey frequency is 512 Hz. Every ten contour maps are put into one panel and put under the map of the corresponding survey configuration sketch. In each panel, the maps in the left column are the anomalous fields and the right column maps are the total fields. The five contour maps from up to down in each column are corresponding to the fields Ex, Ey, Hx, Hy, Hz components, respectively. In order to compare the strength of the amplitude of the anomalous fields, the same anomalous field components maps use same color scale, so do the total fields. The red and blue colors represent the largest and the lowest fields, respectively. In Fig. 2 (e~f), the subscript “a” of E and H represents anomalous field, the subscript “ t ” represents total field. Some contour maps filed in blue color in Fig. 2(e~f) mean that the amplitudes of the field components calculated for this survey configuration are much smaller than that calculated for the other three configurations.
Although the total fields shown in Fig. 2 couple the fields of dyke and of the layer stratum, the basic characters of the field are similar to that of homogeneous half-space. In homogeneous half-space on the equator and axis of electric dipole source, electric field is parallel and horizontal magnetic field is perpendicular to the dipole’s axis, and vertical magnetic field is maximal on equator and zero on axis configurations.
3.4 The Optimal ConfigurationThree criterions are considered to select the best one from the four survey configurations; they are the strong anomalous field amplitude, the stronger total field amplitude and the obvious anomalous pattern in the total field contour maps. The strong total field amplitudes are important because we observed only the total fields in the fieldwork. The obvious anomalous pattern means the anomalous field is strong enough to be recognized easily, it is valuable for judging the best configuration. Therefore the best survey configuration should cause the strong anomalous field and stronger total field.
As shown in Fig. 2e, the amplitudes of the anomalous fields are the weakest except for the anomalous field Hya. For configuration 4, although the anomalous electric fields are strong, the anomalous magnetic fields are weak (shown in Fig. 2h). Therefore, these two configurations are not as good as the other two configurations.
Concerning the total field contour maps, we found that the amplitude of the fields Ex and Hy for configuration 1 are larger than that for configuration 4, and the amplitude of field Ey and Hx for configuration 3 are larger than that for configuration 2.
Within observation area primary field changes more significantly for configurations 3 and 4, and therefore total field maps characterize the anomaly worse than maps for configurations 1 and 2, concerning the anomalous pattern shown in the total field contour maps, the configuration 2 makes obvious anomaly in both the total electric and magnetic field contour maps, and the anomaly pattern is the response of the dyke.
After considering all of the information above, we can draw the conclusion that the configuration 2 is the best one among the four survey configurations.
All of the discussions above are effective only when the survey frequency is 512 Hz. Figure 3 and Fig. 4 show the fields for the frequency 4096 Hz and 4 Hz, respectively. For the frequency of 4096 Hz (in Fig. 3), the amplitude of the anomalous fields and of the total fields are much lower than that of 512 Hz (in Fig. 2), the reason is that there is a conductive overburden layer in the model. When the survey frequency is high, most energy of the electromagnetic wave converts into heat in the first layer. Therefore the signals of the total fields are very weak, it leads the amplitudes of the anomalous fields are weaker more. However, many characters of the anomaly field pattern are similar to the Fig. 2(e~f). The major difference s that the anomalous Held for configuration 2 is less than that of configuration 3 (see Fig. 3b and 3f). The case is inversed when the survey frequency is 4 Hz (shown in Fig. 4b and 4d).

|
Fig. 3 The comparison of anomalous/total fields calculated by different configurations when the survey frequency is 4096 Hz, the CSAMT responds arc (a) corresponding to survey configuration 1 in Fig. 2; (b) corresponding to survey configuration 2 in Fig. 2; (c) corresponding to survey configuration 3 in Fig. 2; (d) corresponding to survey configuration 4 in Fig. 2. In each panel, the left column is anomalous field, the right column is the total Held |

|
Fig. 4 The comparison of anomalous/total field calculated by different configurations when the survey frequency is 4 Hz. The instruction of the map is same as Fig.3 |
If considering all of the survey frequencies, there are two best configurations for locating the conductive dyke, they are configuration 2 and 3, their transmitters are parallel to the strike of dyke, it is different with general configuration whose transmitter is vertical to the strike of the dyke. But the configuration 2 is better than the configuration 3, because the anomalous patterns can be found both in components Ey and Hx, and the strike of the dyke can be recognized clearer than that of configuration 3. Therefore, configuration 2 is the optimal survey configuration for locating the conductive dyke.
4 Detectability of the Conductive DykeThe parameters of the dyke, such as the top buried depth and the height (vertical size), will affect the detectability under the distortion of noise; the dyke will be detectable when the amplitudes of the anomalous fields are larger than the noise. The ratio of the anomalous field signals S to the noise N is used as the parameter to discuss the detectability at the noise level 1%, 5 %, 10 % and 15 %. The ratio S/N can be obtained by the following method: First the maximum anomalous field (denote as S(i) and its position (denote as i) are recorded at same time, then the absolute noise amplitudes (denote as N(i)) are calculated by multiplying the total field at this place with the noise level, at last the ratio of the anomalous signal to the noise can be obtained by using the formula S(i)/N(i).
For the optimal configuration 2, the primary field components Ey and Hx are dominant, therefore, we discussed the anomalous fields Eya and Hxa only.
4.1 The Influence of the Dyke Top-Buried DepthFigure 5a shows the ratio S/N curves versus the top-buried depth of dyke for configuration 2.

|
Fig. 5 The ratio of signal and noise versus the top_buried depth of dyke for different components with the configuration 2. In the figure, the horizontal solid lines represent S/N=1, above which, the signal can be used to detect the top_buried depth of the dyke, Eya means anomalous electrical fields, Hxa means anomalous magnetic fields. (a)f=512 Hz, noise level is 1%, 5%, 10% and 15%; (b) Noise level=10%, f=4 Hz, 512 Hz, 4096 Hz |
The top buried depth of dyke can affect the detectability. The anomalous fields are detectable in theory if the curves are above the line S/N=1 (solid line). We call the intersecting point of the curve with the line as threshold. For example, the depth threshold for Eya is 300 m at noise level 1 %, that is, the anomalous field of Eya is detectable when the top-buried depth of dyke is shallower than 300 m. The threshold is decreasing with the noise level increasing. The detectability of Hx component is weaker than the Eya component because Hx is induced by Ey component. From the curves, we can also find the detectability of the dyke becomes smaller with its deeper depth.
The detectability for various survey frequencies are shown in Fig. 5b when the noise level is 10%. Eya can be detected only for frequency 512 Hz, which mean that 512 Hz is the better survey frequency for the dyke comparing to 4 Hz and 4096 Hz.
4.2 The Influence of the Dyke HeightThe ratio of S/N curves versus the dyke height (vertical size) are shown in Fig. 6. Comparing to Fig. 5, the amplitudes of the ratio S/N vary a little.

|
Fig. 6 The ratio of signal and noise versus the height of dyke for different components with the configuration 2. In the figure, the horizontal solid line represent S/N=1, above which, the signals can be used to detected the dyke, Eya means anomalous electrical fields, Hxa means anomalous magnetic fields. (a)f=512 Hz, noise level is 1%, 5%, 10% and 15%, (b) Noise level=10%, f=4 Hz, 512 Hz, 4096 Hz |
The height threshold for Eya component are 800 m (15%), 300 m (10%) and 100 m (5%), that is, the anomalous field Eya is detectable when the height is larger than those value at the noise level in the parenthesis. Hya component can be detected only under noise level 1%.
Figure 6b shows the ratio S/N curves at noise level 10% for various survey frequencies. The anomalous field Eya can be detected only when the survey frequency is 512 Hz too.
From Fig. 6, we found the dyke height cause small influence on the anomalous field ratio S/N, that is the anomalies are not sensitive to the height of the detected dyke.
5 ConclusionsIn this paper, we have calculated 3D EM fields by CEMI forward modeling software based on the CIE method to analyze the CSAMT responses of a conductive 3D dyke with conductive overburden. We have investigated the optimal survey configuration, also, we have discussed the detectability of the 3D target (conductive dyke).
The conclution is that the survey configuration becomes optimal when the direction of the transmitter is along the strike of 3D dyke, this optimal configuration is different to the convention configuration (configuration 1) for a 2D target. In this case, the ratio of the anomalous fields to the total fields becomes the largest than those in other configurations. In other words, one can more easily extract the anomalous fields (response of the 3D target, for both electric and magnetic fields) from the observed total fields.
The EM fields scattered by the dyke can be varied with its physical parameters. The top-buried depth and the height (vertical size) of dyke can affect the detectability under the distortion of noise. The detectability of the dyke becomes smaller with its deeper depth. The height or the vertical size of the dyke does not affect the detectability drastically compared with the case of the depth, it means the CSAMT method with configuration 2 is not sensitive to the height of the dyke. Maybe the measurements using borehole can improve the detectability of the 3D target.
AcknowledgementsThe authors are thankful to Professor Zhdanov of University of Utah for giving us the chance to calculate the 3D EM fields using CEMI forward modeling software, and for the permission to publish the results. We are also thankful to Dr. Le Wan of CEMI for the helpful discussion. Especially, we thank Prof. Zhao Guoze for his encouragement to us to revise the paper.
The authors gratefully acknowledge the support of the project kzcx2-yw-113, kzcx2-yw-121 and kzcx1-yw-15-4.
| [1] | Zonge K L, Ostrander A G, Emer D F.Controlled source audiofrequency magnetotelluric measurements.In:Vozoff K ed.Magnetotelluric Methods.Soc.Expl.Geophys.Geophysics Reprint Series 5, 1986.749-763 |
| [2] | Sandberg S K, Hohmann G W. Controlled source audio magnetotellurics in geothermal exploration. Geophysics, 1982, 47(1): 100-116. DOI:10.1190/1.1441272 |
| [3] | Enslin J F. A new electromagnetic field technique. Geophysics, 1955, V.XX(2): 318-334. |
| [4] | James P.W.. Response of dyke to oscillating dipole. Geophysics, 1958, V.XXIII(1): 128-133. |
| [5] | Gabor Hursan, Zhdanov M S. Contraction integral equation method in three-dimensional electromagnetic modeling. Radio Science, 2002, 37(6): 1089-1101. |
| [6] | Hohmann G W. Three-dimensional induced polarization and electromagnetic modeling. Geophysics, 1975, 40: 309-324. DOI:10.1190/1.1440527 |
| [7] | Portniaguine O N, Hursan G, Zhdanov M S.Compression Symposium on Three-dimensional Electromagnetics.University of Utah, Salt Lake City, 1999.209-212 |
| [8] | Weidelt P. Electromagnetic induction in three-dimensional structures. J.Geophys., 1975, 41: 85-109. |
| [9] | Xiong Z, Kirsch A. Three-dimensional earth conductivity inversion. J.Comp.Appl.Math., 1992, 42: 109-121. DOI:10.1016/0377-0427(92)90166-U |
| [10] | Zhdanov M S, Fang S. Quasi-linear approximation in 3-D EM modeling. Geophysics, 1996, 61: 646-665. DOI:10.1190/1.1443994 |
| [11] | Zhdanov M S, Fang S. 3-D quasi-linear electromagnetic inversion. Radio Sci., 1996, 31: 741-754. DOI:10.1029/96RS00719 |
| [12] | Zhdanov M S, Fang S. Quasi-linear series in 3-D EM modeling. Radio Sci., 1997, 32: 2167-2188. DOI:10.1029/97RS02284 |
| [13] | Zhdanov M S, Dmitriev V I, Sheng F, Hursan G. Quasi-analytical approximations and series in electromagnetic modeling. Geophysics, 2000, 65(6): 1746-1757. DOI:10.1190/1.1444859 |