
Differences in predicting efficacies for cardiometabolic multimorbidity by different surrogate indicators of insulin resistance
-
摘要:
目的 探讨4种胰岛素抵抗(IR)替代指标对新发心血管代谢共病(CMM)风险的预测效能差异。
方法 采用纵向研究,对2011-2020年中国健康与养老追踪调查(CHARLS)项目中45岁及以上调查对象的数据进行分析。使用多因素logistic回归模型分析4种IR替代指标甘油三酯-葡萄糖指数(TyG)、脂质蓄积指数(LAP)、胰岛素抵抗代谢评分(METS-IR)、内脏脂肪代谢评分(METS-VF)与CMM之间的关联,同时采用限制性立方样条(RCS)模型检验可能存在的非线性关联。采用ROC曲线和AUC值评估各指标的预测性能。
结果 共纳入6 100名研究对象,在为期9年的随访过程中,记录到新发CMM病例649例。多因素logistic回归分析显示,TyG、LAP、METS-IR和METS-VF每增加1个四分位数间距(
IQR )值,CMM的发生风险分别对应增加50.8%(OR =1.508,95%CI 1.364~1.667)、11.3%(OR =1.113,95%CI 1.054~1.176)、37.6%(OR =1.376,95%CI 1.247~1.518)、190.7%(OR =2.907,95%CI 1.826~4.629)。TyG、METS-VF与CMM发生风险之间存在线性关系(P 总体<0.001,P 非线性>0.05),LAP、METS-IR与CMM发生风险之间存在非线性关系(P 总体<0.001,P 非线性<0.001)。LAP对CMM的预测价值最高,AUC值为0.669(95%CI 0.648~0.690),其余依次为METS-IR、TyG和METS-VF。结论 TyG、LAP、METS-IR、METS-VF均与新发CMM风险密切相关,对CMM具有一定预测价值。其中LAP预测效能较佳,且价格低廉、易于获取,可用于临床对CMM高危人群的初步筛查。
Abstract:Objective To investigate the differences in the predictive efficacies of 4 surrogate indicators of insulin resistance (IR) for incident cardiometabolic multimorbidity (CMM).
Methods A longitudinal study was conducted using data from individuals aged≥45 years in the China Health and Retirement Longitudinal Study (CHARLS) from 2011 to 2020. Multivariable logistic regression models were used to explore the associations between 4 IR surrogate indicators-triglyceride-glucose index (TyG), lipid accumulation product index (LAP), metabolic score for insulin resistance (METS-IR), and metabolic score for visceral fat (METS-VF)-and CMM. Restricted cubic spline (RCS) models were employed to examine potential non-linear associations. The predictive performance of each indicator was assessed using receiver operating characteristic (ROC) curves and the area under curve (AUC).
Results A total of 6 100 participants were enrolled in this study, and 649 incident cases of CMM were recorded during the 9-year follow-up. The multivariable logistic regression results showed that for each increase of 1 interquartile range (
IQR ) in TyG, LAP, METS-IR, and METS-VF, the risk of CMM increased by 50.8% (odds ratio [OR ]=1.508, 95% confidence interval [95%CI ] 1.364-1.667), 11.3% (OR =1.113, 95%CI 1.054-1.176), 37.6% (OR =1.376, 95%CI 1.247-1.518), and 190.7% (OR =2.907, 95%CI 1.826-4.629), respectively. TyG and METS-VF had linear relationships with CMM risk (P overall<0.001,P non-linear>0.05), while LAP and METS-IR had non-linear relationships with the risk of CMM (P overall<0.001,P non-linear<0.001). LAP had the highest predictive value for CMM, with an AUC of 0.669 (95%CI 0.648-0.690), followed by METS-IR, TyG, and METS-VF.Conclusion TyG, LAP, METS-IR, and METS-VF are all closely related to the risk of incident CMM and have certain predictive value. Among them, LAP has the best predictive efficacy, and it is also cost-effective and easily accessible, making it suitable for preliminary screening of high-risk populations for CMM in clinical settings.
-
心血管代谢性疾病(cardiometabolic disease,CMD)包括糖尿病、心脏病和脑卒中,已成为影响公众健康的重大卫生问题之一[1]。心血管代谢共病(cardiometabolic multimorbidity,CMM)特指2种或2种以上CMD的共存状态[2]。当前的研究多集中于探讨单一CMD对人体的影响[3-4],而有关多种CMD共存对健康综合影响的研究较少。多病共存不仅显著增加了患者的不良预后风险,同时也加重了社会经济负担[5]。早期筛查并及时发现潜在CMM人群,对于降低疾病发生率、改善国民健康具有重要意义。
胰岛素抵抗(insulin resistance,IR)是CMM的重要发病机制之一,评估IR的“金标准”为高胰岛素-正葡萄糖钳夹技术,但其存在有创、成本高昂、耗时长等局限性。脂质蓄积指数(lipid accumulation product index,LAP)是反映内脏脂肪沉积的可靠指标,与IR密切相关[6]。甘油三酯-葡萄糖指数(triglyceride-glucose index,TyG)可以反映机体的代谢状态,是评估IR的潜在生物标志物[7]。胰岛素抵抗代谢评分(metabolic score for insulin resistance,METS-IR)是评估胰岛素敏感性的复合指标,可有效预测内脏脂肪和2型糖尿病的发生、发展[8]。内脏脂肪代谢评分(metabolic score for visceral fat,METS-VF)是在METS-IR指标基础上发展而来的一种评估腹部脂肪含量和心脏代谢健康的新型指标,且与胰岛素敏感性密切相关[9]。然而,上述指标能否有效预测CMM的发生风险,以及它们之间是否存在效能差异尚不清楚。鉴于此,本研究拟利用中国健康与养老追踪调查(China Health and Retirement Longitudinal Study,CHARLS)数据,构建前瞻性队列,探讨上述4种指标和新发CMM之间的潜在联系及其在CMM预测中的效能差异,以期为CMM的防治提供新思路。
1 资料和方法
1.1 数据来源
本研究为纵向研究,数据来源于2011-2020年CHARLS项目数据。CHARLS项目以随机抽取的家庭中45岁及以上人群为调查对象,旨在建立一套高质量的公开微观数据库,数据包括从广泛的社会经济状况到个人健康状况方面的信息,满足老龄群体研究的需要。该项目获得北京大学生物医学伦理委员会批准(IRB00001052-11015),所有受访者均签署了知情同意书。
CHARLS项目于2011年开展了全国基线调查,范围覆盖全国150个县(区)、450个村(居),成功访问了10 257户家庭的17 708位受访者。本研究申请授权后下载数据(https://charls.pku.edu.cn/)。排除标准:(1)年龄≤45岁(n=428);(2)TyG、LAP、METS-IR、METS-VF指标中至少有一项缺失值(n=3 629);(3)2011年已确诊患有CMM或CMM的诊断状态因数据缺失而无法判定者(n=348);(4)BMI、腰围或身高数据缺失或异常者(n=4 382);(5)失访人群(n=2 821)。最后,共有6 100名中老年人纳入本研究。
1.2 研究变量及定义
(1)TyG=ln[(TG(mg/dL)×FBG(mg/dL)/2][7];(2)LAP(男性)=[腰围(cm)-65]×TG(mmol/L),LAP(女性)=[腰围(cm)-58]×TG(mmol/L)[6];(3)METS-IR=ln[2×FBG(mg/dL)+TG(mg/dL)]×BMI(kg/m2)/ln[HDL-C(mg/dL)][8];(4)METS-VF(男性)=4.466+0.011×[ln(METS-IR)]3+3.239×[ln(WHtR)]3+0.319×1+0.594×ln(年龄),METS-VF(女性)=4.466+0.011×[ln(METS-IR)]3+3.239×[ln(WHtR)]3+0.319×0+0.594×ln(年龄)[9]。其中TG为甘油三酯(1 mg/dL=0.011 3 mmol/L),FBG为空腹血糖(1 mg/dL=0.055 5 mmol/L),HDL-C为高密度脂蛋白胆固醇(1 mg/dL=0.025 9 mmol/L),WHtR为腰围与身高比。
CMM的存在与否通过自我报告的病史确定,包括糖尿病或高血糖、心脏病(如心脏病发作、心绞痛、冠心病或心力衰竭)或脑卒中。在本研究中,个体的CMM状态被描述为存在2种或2种以上的上述疾病。
1.3 协变量
本研究中,多因素logistic回归模型纳入的协变量涵盖社会人口学特征、健康行为以及疾病史。社会人口学特征包括年龄、性别、受教育程度(小学以下、小学、初中、高中及以上)、居住地(城镇或农村)以及婚姻状态(已婚或未婚/分居/寡居)。健康行为方面,研究分析了吸烟习惯(从不吸烟、曾吸烟、现吸烟)、饮酒频率(从不饮酒、曾饮酒、现饮酒)和睡眠时间。疾病史包括高血压、血脂异常、癌症、肝脏疾病、肾脏疾病和消化系统疾病。这些信息由接受统一培训的调查员协助,采用受访者自我报告问卷方式收集。
1.4 统计学处理
应用R 4.3.0软件进行统计学分析。符合正态分布的计量资料以x±s表示,组间比较采用独立样本t检验;不符合正态分布的计量资料以M(Q1,Q3)表示,组间比较采用Mann-Whitney U检验。分类变量采用频数和频率进行描述,采用χ2检验。采用多重插补法对缺失值进行插补(各变量缺失率均低于15%),以减少选择偏倚并降低信息损失。采用多因素logistic回归模型分析TyG、LAP、METS-IR和METS-VF 4种IR替代指标对CMM发生的影响,将这4种IR替代指标作为连续变量[按每四分位数间距(interquartile range,IQR)增量]或分类变量(按四分位数分组)纳入模型分析。为探讨IR替代指标与CMM之间的关系,采用3种多因素logistic回归模型:未进行校正的模型(模型1),根据年龄、性别、受教育程度、居住地、婚姻状况、吸烟和饮酒情况进行调整的模型(模型2),以及根据睡眠时间、BMI、癌症、高血压、脂质异常、肝脏疾病、肾脏疾病和消化系统疾病进一步调整的模型(模型3);同时,为进行趋势性检验,将原始数据按四分位数进行转化,并使用整数值(1、2、3和4)计算,评估各暴露组之间的趋势。进一步进行了限制性立方样条(restricted cubic spline,RCS)分析,以检验可能存在的非线性关联,并通过RCS曲线直观地显示4种IR替代指标与CMM之间的剂量-反应关系。若某项检验结果中的P非线性<0.05,则说明该IR替代指标与CMM之间存在非线性关系;若P非线性>0.05,则可认为CMM发生的累积风险随着该IR替代物的升高而线性增长。采用ROC曲线评估4种IR替代指标对CMM的预测效能,根据约登指数的最大值确定预测CMM的最佳临界值。采用双侧检验,检验水准(α)为0.05。
2 结果
2.1 研究对象的基本特征
研究对象的基本特征见表 1。共纳入6 100名为研究对象,中位年龄为58(52,64)岁,男2 719名(44.57%)、女3 381名(55.43%),其中新发CMM为649例(10.64%)。所有参与者的TyG、LAP、METS-IR、METS-VF的基线中位数(IQR)分别为8.58(0.81)、27.21(32.85)、2.28(0.31)和158.07(27.44),并且新发CMM组的4种IR替代指标均高于非CMM组(均P<0.001)。
表 1 研究对象的基本特征Table 1 Basic characteristics of participantsItem All N=6 100 Non-CMM N=5 451 CMM N=649 P value Age/year, M(Q1,Q3) 58 (52, 64) 57 (51, 64) 60 (54, 65) <0.001 Gender, n (%) <0.001 Female 3 381 (55.43) 2 982 (54.71) 399 (61.48) Male 2 719 (44.57) 2 469 (45.29) 250 (38.52) Marital status, n (%) 0.602 Unmarried/separated/widowed 581 (9.52) 515 (9.45) 66 (10.17) Married 5 519 (90.48) 4 936 (90.55) 583 (89.83) Education levela, n (%) 0.762 Below primary school 2 915 (47.79) 2 598 (47.67) 317 (48.84) Primary school 1 355 (22.21) 1 206 (22.12) 149 (22.96) Junior high school 1 242 (20.36) 1 116 (20.47) 126 (19.41) High school and above 585 (9.59) 528 (9.69) 57 (8.78) Place of residence, n (%) 0.205 Rural areas 1 902 (31.18) 1 685 (30.91) 217 (33.44) Town 4 198 (68.82) 3 766 (69.09) 432 (66.56) Smoking situationa, n (%) <0.001 Never smoke 3 825 (62.70) 3 398 (62.34) 427 (65.79) Used to smoke 477 (7.82) 402 (7.37) 75 (11.56) Current smoker 1 791 (29.36) 1 644 (30.16) 147 (22.65) Drinking situationa, n (%) 0.009 Never drink alcohol 3 657 (59.95) 3 245 (59.53) 412 (63.48) Used to drink 475 (7.79) 415 (7.61) 60 (9.24) Current drinking 1 966 (32.23) 1 790 (32.84) 176 (27.12) Sleep duration/h, M(Q1,Q3) 6.5 (5.0, 8.0) 7.0 (5.0, 8.0) 6.0 (5.0, 8.0) 0.002 Waist circumference/cm, M(Q1,Q3) 84.5 (78.0, 92.0) 84.0 (77.6, 91.0) 90.0 (83.0, 97.0) <0.001 BMI/(kg·m-2), M(Q1,Q3) 23.15 (20.91, 25.76) 22.98 (20.77, 25.43) 25.23 (22.40, 27.93) <0.001 TG/(mmol·L-1), M(Q1,Q3) 1.18 (0.84, 1.73) 1.15 (0.82, 1.68) 1.45 (1.02, 2.22) <0.001 HDL-C/(mmol·L-1), M(Q1,Q3) 1.29 (1.05, 1.56) 1.30 (1.06, 1.58) 1.17 (0.95, 1.39) <0.001 LDL-C/(mmol·L-1), M(Q1,Q3) 2.98 (2.43, 3.56) 2.95 (2.43, 3.52) 3.16 (2.48, 3.79) <0.001 Hypertensiona, n (%) <0.001 No 4 625 (75.82) 4 302 (78.92) 323 (49.77) Yes 1 457 (23.89) 1 131 (20.75) 326 (50.23) Dyslipidemiaa, n (%) <0.001 No 5 483 (89.89) 4 990 (91.54) 493 (75.96) Yes 536 (8.79) 385 (7.06) 151 (23.27) Cancera, n (%) 0.891 No 6 041 (99.03) 5 400 (99.06) 641 (98.77) Yes 49 (0.80) 43 (0.79) 6 (0.92) Liver diseasea, n (%) <0.001 No 5 891 (96.58) 5 278 (96.83) 613 (94.45) Yes 192 (3.15) 157 (2.88) 35 (5.39) Kidney diseasea, n (%) <0.001 No 5 769 (94.58) 5 182 (95.07) 587 (90.45) Yes 313 (5.13) 253 (4.64) 60 (9.24) Digestive system diseasea, n (%) 0.001 No 4 704 (77.11) 4 237 (77.73) 467 (71.96) Yes 1 390 (22.79) 1 209 (22.18) 181 (27.89) TyG, M(Q1,Q3) 8.58 (8.21, 9.02) 8.55 (8.19, 8.98) 8.86 (8.49, 9.44) <0.001 LAP, M(Q1,Q3) 27.21 (15.06, 47.91) 25.83 (14.43, 45.07) 43.64 (25.15, 72.39) <0.001 METS-IR, M(Q1,Q3) 2.28 (2.14, 2.45) 2.27 (2.13, 2.43) 2.41 (2.26, 2.59) <0.001 METS-VF, M(Q1,Q3) 158.07 (144.83, 172.27) 157.17 (144.13, 170.95) 168.36 (152.25, 183.75) <0.001 a: There were missing data. CMM: Cardiometabolic multimorbidity; BMI: Body mass index; TG: Triglyceride; HDL-C: High density lipoprotein cholesterol; LDL-C: Low density lipoprotein cholesterol; TyG: Triglyceride-glucose index; LAP: Lipid accumulation product index; METS-IR: Metabolic score for insulin resistance; METS-VF: Metabolic score for visceral fat. 新发CMM组的中位年龄为60(54,65)岁,非CMM组的中位年龄为57(51,64)岁(P<0.001)。在性别方面,女性在新发CMM组中占有更高比例,差异有统计学意义(P<0.001)。在生活习惯方面,吸烟、饮酒习惯在两组间的差异同样有统计学意义(均P<0.01)。健康指标如腰围、BMI及TG、低密度脂蛋白胆固醇(low density lipoprotein cholesterol,LDL-C)水平在新发CMM组中均呈现更高的水平,差异有统计学意义(均P<0.001)。非CMM组睡眠时间更长,HDL-C水平更高,两组比较差异有统计学意义(均P<0.01)。新发CMM组的高血压、血脂异常、肝脏疾病、肾脏疾病、消化系统疾病的患病率高于非CMM组,差异有统计学意义(均P<0.01)。
2.2 4种IR替代指标与CMM发生的多因素logistic回归分析
表 2显示了4种IR替代指标与CMM发生风险的关系及4种IR替代指标的四分位数。在对年龄、性别、婚姻状况、受教育程度、居住地、吸烟、饮酒、睡眠时间、BMI、癌症、高血压、脂质异常、肝脏疾病、肾脏疾病、消化系统疾病进行调整后,完成了多因素logistic回归分析(模型3)。结果表明,作为连续变量进行分析时,4种IR替代指标与CMM发生风险相关。TyG每增加1个IQR值,CMM的发生风险增加50.8%(OR=1.508,95%CI 1.364~1.667);LAP每增加1个IQR值,CMM的发生风险增加11.3%(OR=1.113,95%CI 1.054~1.176);METS-IR每增加1个IQR值,CMM的发生风险增加37.6%(OR=1. 376,95%CI 1.247~1.518);METS-VF每增加1个IQR值,CMM的发生风险增加190.7%(OR=2.907,95%CI 1.826~4.629)。对IR替代指标作为有序分类变量分析时,相对于最低四分位数Q1,最高四分位数Q4的CMM发生风险最高,CMM的发生风险随4种IR替代指标的四分位数增加而逐渐升高(P趋势<0.001)。
表 2 4种IR替代指标与CMM发生风险的多因素logistic回归分析(多重插补后)Table 2 Multivariable logistic regression analysis of 4 IR surrogate indicators and CMM risk (after multiple imputation)Variable Model 1 Model 2 Model 3 OR (95%CI) P value OR (95%CI) P value OR (95%CI) P value TyG (increment per IQR) 1.777 (1.625, 1.943) <0.001 1.785 (1.630, 1.956) <0.001 1.508 (1.364, 1.667) <0.001 Q1 Reference Reference Reference Q2 1.635 (1.221, 2.203) 0.001 1.608 (1.199, 2.169) 0.002 1.484 (1.096, 2.022) 0.011 Q3 2.517 (1.915, 3.336) <0.001 2.389 (1.815, 3.173) <0.001 1.956 (1.465, 2.632) <0.001 Q4 4.046 (3.122, 5.300) <0.001 3.903 (3.005, 5.125) <0.001 2.613 (1.974, 3.492) <0.001 Ptrend value <0.001 <0.001 <0.001 LAP (increment per IQR) 1.268 (1.206, 1.333) <0.001 1.265 (1.202, 1.331) <0.001 1.113 (1.054, 1.176) <0.001 Q1 Reference Reference Reference Q2 1.492 (1.098, 2.038) 0.011 1.467 (1.074, 2.015) 0.017 1.270 (0.916, 1.770) 0.154 Q3 2.735 (2.071, 3.648) <0.001 2.718 (2.040, 3.655) <0.001 2.061 (1.505, 2.848) <0.001 Q4 4.739 (3.642, 6.242) <0.001 4.726 (3.587, 6.299) <0.001 2.732 (1.966, 3.830) <0.001 Ptrend value <0.001 <0.001 <0.001 METS-IR (increment per IQR) 1.652 (1.516, 1.800) <0.001 1.679 (1.538, 1.833) <0.001 1.376 (1.247, 1.518) <0.001 Q1 Reference Reference Reference Q2 1.526 (1.133, 2.066) 0.006 1.562 (1.157, 2.118) 0.004 1.385 (1.015, 1.899) 0.041 Q3 2.503 (1.902, 3.325) <0.001 2.581 (1.955, 3.438) <0.001 1.961 (1.454, 2.665) <0.001 Q4 4.344 (3.353, 5.693) <0.001 4.452 (3.420, 5.859) <0.001 2.745 (2.040, 3.725) <0.001 Ptrend value <0.001 <0.001 <0.001 METS-VF (increment per IQR) 1.802 (1.631, 1.992) <0.001 1.951 (1.756, 2.168) <0.001 2.907 (1.826, 4.629) <0.001 Q1 Reference Reference Reference Q2 1.496 (1.131, 1.987) 0.005 1.735 (1.306, 2.316) <0.001 1.547 (1.135, 2.120) 0.006 Q3 1.834 (1.401, 2.416) <0.001 2.208 (1.672, 2.932) <0.001 1.699 (1.207, 2.406) 0.003 Q4 3.656 (2.856, 4.724) <0.001 4.640 (3.569, 6.083) <0.001 2.470 (1.601, 3.841) <0.001 Ptrend value <0.001 <0.001 <0.001 Model 1: Not adjusted; Model 2: Adjusted for age, gender, marital status, education level, place of residence, smoking and drinking situation; Model 3: The sleep duration, BMI, cancer, hypertension, dyslipidemia, liver disease, kidney disease, and digestive system disease were adjusted on the basis of model 2. IR: Insulin resistance; CMM: Cardiometabolic multimorbidity; TyG: Triglyceride-glucose index; IQR: Interquartile interval; LAP: Lipid accumulation product index; METS-IR: Metabolic score for insulin resistance; METS-VF: Metabolic score for visceral fat; OR: Odds ratio; 95%CI: 95% confidence interval; BMI: Body mass index. 2.3 4种IR替代指标与CMM发生的相关性分析
图 1显示了4种IR替代指标与CMM发生风险之间的剂量-反应关系。调整年龄、性别、婚姻状况、受教育程度、居住地、吸烟情况、饮酒情况和睡眠时间等协变量后进行RCS分析,结果显示TyG、METS-VF与CMM发生风险之间存在线性关系(P总体<0.001,P非线性>0.05),LAP、METS-IR与CMM发生风险之间呈非线性关系(P总体<0.001,P非线性<0.001),并且随着4种IR替代指标的升高,发生CMM的累积风险逐渐增加。
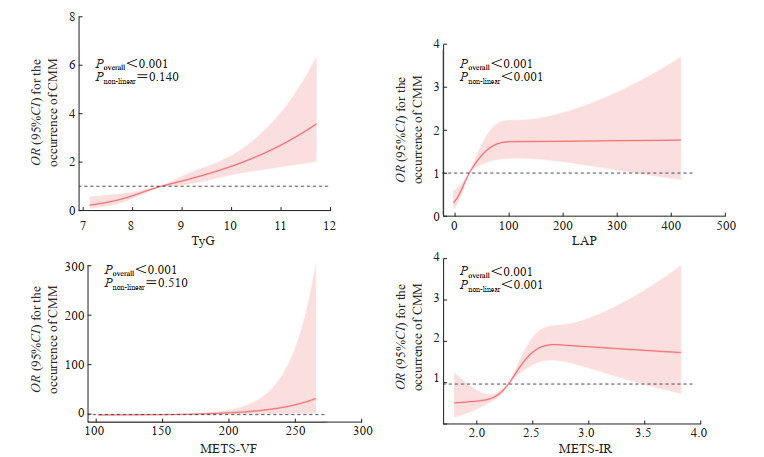 图 1 4种IR替代指标与CMM发生的RCS分析Fig. 1 RCS analysis of 4 IR surrogate indicators and CMMIR: Insulin resistance; CMM: Cardiometabolic multimorbidity; RCS: Restricted cubic spline; TyG: Triglyceride-glucose index; LAP: Lipid accumulation product index; METS-VF: Metabolic score for visceral fat; METS-IR: Metabolic score for insulin resistance; OR: Odds ratio; 95%CI: 95% confidence interval.
 下载:
全尺寸图片
下载:
全尺寸图片
2.4 4种IR替代指标对CMM发生的预测效能比较
表 3、图 2显示了4种IR替代指标对CMM发病的预测效能差异。TyG、LAP、METS-IR、METS-VF的AUC值分别为0.651、0.669、0.659、0.639,表明4种IR替代指标均对CMM的发生具有一定的预测能力,其中LAP的AUC值最高,其余依次为METS-IR、TyG、METS-VF。
表 3 4种IR替代指标预测CMM发生的ROC曲线分析结果Table 3 ROC curve analysis results of 4 IR surrogate indicators for CMM predictionIndex AUC 95%CI Cut-off value Specificity Sensitivity P value TyG 0.651 (0.629, 0.673) 8.650 0.652 0.567 <0.001 LAP 0.669 (0.648, 0.690) 32.433 0.669 0.609 <0.001 METS-IR 0.659 (0.637, 0.681) 2.340 0.629 0.624 <0.001 METS-VF 0.639 (0.616, 0.663) 165.153 0.564 0.658 <0.001 IR: Insulin resistance; CMM: Cardiometabolic multimorbidity; ROC: Receiver operating characteristic; AUC: Area under curve; 95%CI: 95% confidence interval; TyG: Triglyceride-glucose index; LAP: Lipid accumulation product index; METS-IR: Metabolic score for insulin resistance; METS-VF: Metabolic score for visceral fat. 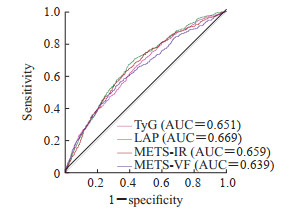 图 2 4种IR替代指标预测CMM发生的ROC曲线Fig. 2 ROC curve of 4 IR surrogate indicators for CMM predictionIR: Insulin resistance; CMM: Cardiometabolic multimorbidity; ROC: Receiver operating characteristic; TyG: Triglyceride-glucose index; LAP: Lipid accumulation product index; METS-IR: Metabolic score for insulin resistance; METS-VF: Metabolic score for visceral fat; AUC: Area under curve.下载:
全尺寸图片
图 2 4种IR替代指标预测CMM发生的ROC曲线Fig. 2 ROC curve of 4 IR surrogate indicators for CMM predictionIR: Insulin resistance; CMM: Cardiometabolic multimorbidity; ROC: Receiver operating characteristic; TyG: Triglyceride-glucose index; LAP: Lipid accumulation product index; METS-IR: Metabolic score for insulin resistance; METS-VF: Metabolic score for visceral fat; AUC: Area under curve.下载:
全尺寸图片
3 讨论
本研究基于中国CHARLS数据全面探讨了4种胰岛素替代指标(LAP、METS-IR、METS-VF和TyG)与新发CMM之间的关系,并分别评估和对比了它们对新发CMM的预测价值。结果显示,TyG和METS-VF与新发CMM风险之间存在线性关系,LAP和METS-IR与新发CMM风险存在非线性关系,并且随着4种IR替代指标的升高,发生CMM的累积风险逐渐增加;4种IR替换指标对新发CMM具有一定的预测能力,预测价值由高到低依次为LAP、METS-IR、TyG和METS-VF。
越来越多的证据表明IR指标与CMM密切相关。一项关于巴西中年男性人群的横断面研究表明,LAP可识别代谢综合征并与心脏代谢危险因素相关[10]。相关研究证实在LDC-C的部分介导下,METS-IR与心血管疾病/脑卒中/心脏问题的风险增加有关[11]。另有研究指出,METS-VF与CMM事件和全因死亡风险增加相关,并可用作不同葡萄糖耐量状态人群CMM事件风险和全因死亡率的预测指标[12]。这与本研究结果一致。TyG增强了CMM及其死亡风险预测的诊断效能[13],有望成为识别CMM早期风险人群和改善风险分层的有效指标。IR可导致胰岛素信号通路改变并引起心脏代谢紊乱、血脂异常、低度炎症和内皮功能障碍,被认为是心血管功能障碍和代谢紊乱的重要机制[14]。心肌细胞是典型的胰岛素靶向细胞,IR可引起心脏葡萄糖及脂肪酸的过量蓄积。过量的葡萄糖及脂肪酸产生的糖脂毒性将导致心肌细胞线粒体功能障碍、氧化应激、内质网应激和晚期糖基化终产物增加,进而引发内皮功能障碍和动脉粥样硬化,损害心脏结构和功能,最终诱发CMM[15-16]。
尽管LAP、METS-IR、TyG和METS-VF对CMM具有一定的预测能力,但有趣的是,本研究发现这4种IR指标的预测效能不尽相同。腰高比、腰围、BMI、血糖、TG水平分别代表不同组织的IR水平,HDL-C与IR呈负相关且具有抗动脉粥样硬化的作用。计算IR替代指标时,上述指标纳入越多越能反映IR的整体情况。根据各自的计算公式可知,TyG利用血糖和血脂计算而来,仅代表肝脏和肌肉中的IR[17]。其他指标除上述计算指标外均涉及肥胖指数(腰围、BMI等),可代表脂肪组织、肌肉和肝脏的IR。因此,尽管可以解释METS-IR对新发CMM的预测价值高于METS-VF而TyG的预测价值低于METS-IR和LAP,但似乎无法解释仅利用腰围和TG计算得出的LAP对疾病的预测价值超过METS-IR,也无法解释TyG与新发CMM之间的相关性高于METS-VF。然而,值得强调的是,LAP的计算仅需腰围和TG,是临床常用指标且易于获取,值得推广应用。
本研究还发现,新发CMM的人群特征倾向于女性、高龄和短睡眠时长。既往研究初步表明代谢紊乱似乎对女性的影响更大。例如,女性腰围与IR之间的正相关性显著强于男性[18],且女性的血糖控制和胰岛素稳态较男性更差[19]。因此,上述原因可能是导致女性更容易发生CMM的潜在机制。衰老是一个伴随心血管功能和代谢功能进行性恶化的生理过程,因此高龄可能是CMM的独立危险因素[20]。睡眠时间短也可能通过增加肥胖和代谢功能障碍增加CMM的发生风险[21]。一项前瞻性队列研究的meta分析指出,睡眠持续时间短与高血压、冠心病、心血管疾病事件和死亡率显著相关[22]。
综上所述,本研究发现LAP、METS-IR、METS-VF和TyG 4种IR替代指标与新发CMM的风险密切相关,其中LAP可以有效预测CMM的新发风险且计算简便,值得临床推广应用。然而,本研究也具有一定的局限性:首先,CMM的诊断依赖于患者自我报道,可能存在一定偏倚;其次,纳入人群为中国人群,研究结论是否可推广至其他种族和人群有待研究。未来有待开展更多人群、更大范围的多中心研究,以进一步探索IR指标与CMM发生风险之间的关系,以期为有效识别高危人群、降低疾病发生率、改善国民健康水平提供可靠参考。
-
图 1 4种IR替代指标与CMM发生的RCS分析
Fig. 1 RCS analysis of 4 IR surrogate indicators and CMM
IR: Insulin resistance; CMM: Cardiometabolic multimorbidity; RCS: Restricted cubic spline; TyG: Triglyceride-glucose index; LAP: Lipid accumulation product index; METS-VF: Metabolic score for visceral fat; METS-IR: Metabolic score for insulin resistance; OR: Odds ratio; 95%CI: 95% confidence interval.
下载:
全尺寸图片
图 2 4种IR替代指标预测CMM发生的ROC曲线
Fig. 2 ROC curve of 4 IR surrogate indicators for CMM prediction
IR: Insulin resistance; CMM: Cardiometabolic multimorbidity; ROC: Receiver operating characteristic; TyG: Triglyceride-glucose index; LAP: Lipid accumulation product index; METS-IR: Metabolic score for insulin resistance; METS-VF: Metabolic score for visceral fat; AUC: Area under curve.
下载:
全尺寸图片
表 1 研究对象的基本特征
Table 1 Basic characteristics of participants
Item All N=6 100 Non-CMM N=5 451 CMM N=649 P value Age/year, M(Q1,Q3) 58 (52, 64) 57 (51, 64) 60 (54, 65) <0.001 Gender, n (%) <0.001 Female 3 381 (55.43) 2 982 (54.71) 399 (61.48) Male 2 719 (44.57) 2 469 (45.29) 250 (38.52) Marital status, n (%) 0.602 Unmarried/separated/widowed 581 (9.52) 515 (9.45) 66 (10.17) Married 5 519 (90.48) 4 936 (90.55) 583 (89.83) Education levela, n (%) 0.762 Below primary school 2 915 (47.79) 2 598 (47.67) 317 (48.84) Primary school 1 355 (22.21) 1 206 (22.12) 149 (22.96) Junior high school 1 242 (20.36) 1 116 (20.47) 126 (19.41) High school and above 585 (9.59) 528 (9.69) 57 (8.78) Place of residence, n (%) 0.205 Rural areas 1 902 (31.18) 1 685 (30.91) 217 (33.44) Town 4 198 (68.82) 3 766 (69.09) 432 (66.56) Smoking situationa, n (%) <0.001 Never smoke 3 825 (62.70) 3 398 (62.34) 427 (65.79) Used to smoke 477 (7.82) 402 (7.37) 75 (11.56) Current smoker 1 791 (29.36) 1 644 (30.16) 147 (22.65) Drinking situationa, n (%) 0.009 Never drink alcohol 3 657 (59.95) 3 245 (59.53) 412 (63.48) Used to drink 475 (7.79) 415 (7.61) 60 (9.24) Current drinking 1 966 (32.23) 1 790 (32.84) 176 (27.12) Sleep duration/h, M(Q1,Q3) 6.5 (5.0, 8.0) 7.0 (5.0, 8.0) 6.0 (5.0, 8.0) 0.002 Waist circumference/cm, M(Q1,Q3) 84.5 (78.0, 92.0) 84.0 (77.6, 91.0) 90.0 (83.0, 97.0) <0.001 BMI/(kg·m-2), M(Q1,Q3) 23.15 (20.91, 25.76) 22.98 (20.77, 25.43) 25.23 (22.40, 27.93) <0.001 TG/(mmol·L-1), M(Q1,Q3) 1.18 (0.84, 1.73) 1.15 (0.82, 1.68) 1.45 (1.02, 2.22) <0.001 HDL-C/(mmol·L-1), M(Q1,Q3) 1.29 (1.05, 1.56) 1.30 (1.06, 1.58) 1.17 (0.95, 1.39) <0.001 LDL-C/(mmol·L-1), M(Q1,Q3) 2.98 (2.43, 3.56) 2.95 (2.43, 3.52) 3.16 (2.48, 3.79) <0.001 Hypertensiona, n (%) <0.001 No 4 625 (75.82) 4 302 (78.92) 323 (49.77) Yes 1 457 (23.89) 1 131 (20.75) 326 (50.23) Dyslipidemiaa, n (%) <0.001 No 5 483 (89.89) 4 990 (91.54) 493 (75.96) Yes 536 (8.79) 385 (7.06) 151 (23.27) Cancera, n (%) 0.891 No 6 041 (99.03) 5 400 (99.06) 641 (98.77) Yes 49 (0.80) 43 (0.79) 6 (0.92) Liver diseasea, n (%) <0.001 No 5 891 (96.58) 5 278 (96.83) 613 (94.45) Yes 192 (3.15) 157 (2.88) 35 (5.39) Kidney diseasea, n (%) <0.001 No 5 769 (94.58) 5 182 (95.07) 587 (90.45) Yes 313 (5.13) 253 (4.64) 60 (9.24) Digestive system diseasea, n (%) 0.001 No 4 704 (77.11) 4 237 (77.73) 467 (71.96) Yes 1 390 (22.79) 1 209 (22.18) 181 (27.89) TyG, M(Q1,Q3) 8.58 (8.21, 9.02) 8.55 (8.19, 8.98) 8.86 (8.49, 9.44) <0.001 LAP, M(Q1,Q3) 27.21 (15.06, 47.91) 25.83 (14.43, 45.07) 43.64 (25.15, 72.39) <0.001 METS-IR, M(Q1,Q3) 2.28 (2.14, 2.45) 2.27 (2.13, 2.43) 2.41 (2.26, 2.59) <0.001 METS-VF, M(Q1,Q3) 158.07 (144.83, 172.27) 157.17 (144.13, 170.95) 168.36 (152.25, 183.75) <0.001 a: There were missing data. CMM: Cardiometabolic multimorbidity; BMI: Body mass index; TG: Triglyceride; HDL-C: High density lipoprotein cholesterol; LDL-C: Low density lipoprotein cholesterol; TyG: Triglyceride-glucose index; LAP: Lipid accumulation product index; METS-IR: Metabolic score for insulin resistance; METS-VF: Metabolic score for visceral fat. 表 2 4种IR替代指标与CMM发生风险的多因素logistic回归分析(多重插补后)
Table 2 Multivariable logistic regression analysis of 4 IR surrogate indicators and CMM risk (after multiple imputation)
Variable Model 1 Model 2 Model 3 OR (95%CI) P value OR (95%CI) P value OR (95%CI) P value TyG (increment per IQR) 1.777 (1.625, 1.943) <0.001 1.785 (1.630, 1.956) <0.001 1.508 (1.364, 1.667) <0.001 Q1 Reference Reference Reference Q2 1.635 (1.221, 2.203) 0.001 1.608 (1.199, 2.169) 0.002 1.484 (1.096, 2.022) 0.011 Q3 2.517 (1.915, 3.336) <0.001 2.389 (1.815, 3.173) <0.001 1.956 (1.465, 2.632) <0.001 Q4 4.046 (3.122, 5.300) <0.001 3.903 (3.005, 5.125) <0.001 2.613 (1.974, 3.492) <0.001 Ptrend value <0.001 <0.001 <0.001 LAP (increment per IQR) 1.268 (1.206, 1.333) <0.001 1.265 (1.202, 1.331) <0.001 1.113 (1.054, 1.176) <0.001 Q1 Reference Reference Reference Q2 1.492 (1.098, 2.038) 0.011 1.467 (1.074, 2.015) 0.017 1.270 (0.916, 1.770) 0.154 Q3 2.735 (2.071, 3.648) <0.001 2.718 (2.040, 3.655) <0.001 2.061 (1.505, 2.848) <0.001 Q4 4.739 (3.642, 6.242) <0.001 4.726 (3.587, 6.299) <0.001 2.732 (1.966, 3.830) <0.001 Ptrend value <0.001 <0.001 <0.001 METS-IR (increment per IQR) 1.652 (1.516, 1.800) <0.001 1.679 (1.538, 1.833) <0.001 1.376 (1.247, 1.518) <0.001 Q1 Reference Reference Reference Q2 1.526 (1.133, 2.066) 0.006 1.562 (1.157, 2.118) 0.004 1.385 (1.015, 1.899) 0.041 Q3 2.503 (1.902, 3.325) <0.001 2.581 (1.955, 3.438) <0.001 1.961 (1.454, 2.665) <0.001 Q4 4.344 (3.353, 5.693) <0.001 4.452 (3.420, 5.859) <0.001 2.745 (2.040, 3.725) <0.001 Ptrend value <0.001 <0.001 <0.001 METS-VF (increment per IQR) 1.802 (1.631, 1.992) <0.001 1.951 (1.756, 2.168) <0.001 2.907 (1.826, 4.629) <0.001 Q1 Reference Reference Reference Q2 1.496 (1.131, 1.987) 0.005 1.735 (1.306, 2.316) <0.001 1.547 (1.135, 2.120) 0.006 Q3 1.834 (1.401, 2.416) <0.001 2.208 (1.672, 2.932) <0.001 1.699 (1.207, 2.406) 0.003 Q4 3.656 (2.856, 4.724) <0.001 4.640 (3.569, 6.083) <0.001 2.470 (1.601, 3.841) <0.001 Ptrend value <0.001 <0.001 <0.001 Model 1: Not adjusted; Model 2: Adjusted for age, gender, marital status, education level, place of residence, smoking and drinking situation; Model 3: The sleep duration, BMI, cancer, hypertension, dyslipidemia, liver disease, kidney disease, and digestive system disease were adjusted on the basis of model 2. IR: Insulin resistance; CMM: Cardiometabolic multimorbidity; TyG: Triglyceride-glucose index; IQR: Interquartile interval; LAP: Lipid accumulation product index; METS-IR: Metabolic score for insulin resistance; METS-VF: Metabolic score for visceral fat; OR: Odds ratio; 95%CI: 95% confidence interval; BMI: Body mass index. 表 3 4种IR替代指标预测CMM发生的ROC曲线分析结果
Table 3 ROC curve analysis results of 4 IR surrogate indicators for CMM prediction
Index AUC 95%CI Cut-off value Specificity Sensitivity P value TyG 0.651 (0.629, 0.673) 8.650 0.652 0.567 <0.001 LAP 0.669 (0.648, 0.690) 32.433 0.669 0.609 <0.001 METS-IR 0.659 (0.637, 0.681) 2.340 0.629 0.624 <0.001 METS-VF 0.639 (0.616, 0.663) 165.153 0.564 0.658 <0.001 IR: Insulin resistance; CMM: Cardiometabolic multimorbidity; ROC: Receiver operating characteristic; AUC: Area under curve; 95%CI: 95% confidence interval; TyG: Triglyceride-glucose index; LAP: Lipid accumulation product index; METS-IR: Metabolic score for insulin resistance; METS-VF: Metabolic score for visceral fat. -
[1] JIN Y, LIANG J, HONG C, et al. Cardiometabolic multimorbidity, lifestyle behaviours, and cognitive function:a multicohort study[J]. Lancet Healthy Longev, 2023, 4(6):e265-e273. DOI: 10.1016/S2666-7568(23)00054-5. [2] DOVE A, GUO J, MARSEGLIA A, et al. Cardiometabolic multimorbidity and incident dementia: the Swedish twin registry[J]. Eur Heart J, 2023, 44(7): 573-582. DOI: 10.1093/eurheartj/ehac744. [3] 布阿依仙木·艾麦提, 姚晓光. 阻塞性睡眠呼吸暂停与代谢性心血管疾病危险因素的双向关系[J]. 中国医学创新, 2025, 22(8): 166-170. DOI: 10.3969/j.issn.1674-4985.2025.08.037. [4] SATTAR N, GILL J M, ALAZAWI W. Improving prevention strategies for cardiometabolic disease[J]. Nat Med, 2020, 26(3): 320-325. DOI: 10.1038/s41591-020-0786-7. [5] EINARSON T R, ACS A, LUDWIG C, et al. Economic burden of cardiovascular disease in type 2 diabetes: a systematic review[J]. Value Health, 2018, 21(7): 881-890. DOI: 10.1016/j.jval.2017.12.019. [6] EBRAHIMI M, SEYEDI S A, NABIPOORASHRAFI S A, et al. Lipid accumulation product (LAP) index for the diagnosis of nonalcoholic fatty liver disease (NAFLD): a systematic review and meta-analysis[J]. Lipids Health Dis, 2023, 22(1): 41. DOI: 10.1186/s12944-023-01802-6. [7] HUO R R, LIAO Q, ZHAI L, et al. Interacting and joint effects of triglyceride-glucose index (TyG) and body mass index on stroke risk and the mediating role of TyG in middle-aged and older Chinese adults: a nationwide prospective cohort study[J]. Cardiovasc Diabetol, 2024, 23(1): 30. DOI: 10.1186/s12933-024-02122-4. [8] BELLO-CHAVOLLA O Y, ALMEDA-VALDES P, GOMEZ-VELASCO D, et al. METS-IR, a novel score to evaluate insulin sensitivity, is predictive of visceral adiposity and incident type 2 diabetes[J]. Eur J Endocrinol, 2018, 178(5): 533-544. DOI: 10.1530/EJE-17-0883. [9] BELLO-CHAVOLLA O Y, ANTONIO-VILLA N E, VARGAS-VÁZQUEZ A, et al. Metabolic score for visceral fat (METS-VF), a novel estimator of intra-abdominal fat content and cardio-metabolic health[J]. Clin Nutr, 2020, 39(5): 1613-1621. DOI: 10.1016/j.clnu.2019.07.012. [10] DE OLIVEIRA A, HERMSDORFF H H, COCATE P G, et al. Accuracy of plasma interleukin-18 and adiponectin concentrations in predicting metabolic syndrome and cardiometabolic disease risk in middle-age Brazilian men[J]. Appl Physiol Nutr Metab, 2015, 40(10): 1048-1055. DOI: 10.1139/apnm-2014-0487. [11] QIAN T, SHENG X, SHEN P, et al. Mets-IR as a predictor of cardiovascular events in the middle-aged and elderly population and mediator role of blood lipids[J]. Front Endocrinol (Lausanne), 2023, 14: 1224967. DOI: 10.3389/fendo.2023.1224967. [12] ZHU Y, ZOU H, GUO Y, et al. Associations between metabolic score for visceral fat and the risk of cardiovascular disease and all-cause mortality among populations with different glucose tolerance statuses[J]. Diabetes Res Clin Pract, 2023, 203: 110842. DOI: 10.1016/j.diabres.2023.110842. [13] DANG K, WANG X, HU J, et al. The association between triglyceride-glucose index and its combination with obesity indicators and cardiovascular disease: NHANES 2003-2018[J]. Cardiovasc Diabetol, 2024, 23(1): 8. DOI: 10.1186/s12933-023-02115-9. [14] KOSMAS C E, BOUSVAROU M D, KOSTARA C E, et al. Insulin resistance and cardiovascular disease[J]. J Int Med Res, 2023, 51(3): 3000605231164548. DOI: 10.1177/03000605231164548. [15] CERF M E. Cardiac glucolipotoxicity and cardiovascular outcomes[J]. Medicina, 2018, 54(5): 70. DOI: 10.3390/medicina54050070. [16] YAN A, XIE G, DING X, et al. Effects of lipid overload on heart in metabolic diseases[J]. Horm Metab Res, 2021, 53(12): 771-778. DOI: 10.1055/a-1693-8356. [17] MIRR M, SKRYPNIK D, BOGDAŃSKI P, et al. Newly proposed insulin resistance indexes called TyG-NC and TyG-NHtR show efficacy in diagnosing the metabolic syndrome[J]. J Endocrinol Invest, 2021, 44(12): 2831-2843. DOI: 10.1007/s40618-021-01608-2. [18] NILSSON G, HEDBERG P, JONASON T, et al. Waist circumference alone predicts insulin resistance as good as the metabolic syndrome in elderly women[J]. Eur J Intern Med, 2008, 19(7): 520-526. DOI: 10.1016/j.ejim.2008.01.018. [19] ABDELMONEIM I, AL-HOMRANY M A. Health education in the management of diabetes at the primary health care level: is there a gender difference?[J]. East Mediterr Health J, 2002, 8(1): 18-23. [20] COSTANTINO S, PANENI F, COSENTINO F. Ageing, metabolism and cardiovascular disease[J]. J Physiol, 2016, 594(8): 2061-2073. DOI: 10.1113/JP270538. [21] MAKAREM N, ALCÁNTARA C, WILLIAMS N, et al. Effect of sleep disturbances on blood pressure[J]. Hypertension, 2021, 77(4): 1036-1046. DOI: 10.1161/HYPERTENSIONAHA.120.14479. [22] ITANI O, JIKE M, WATANABE N, et al. Short sleep duration and health outcomes: a systematic review, meta-analysis, and meta-regression[J]. Sleep Med, 2017, 32: 246-256. DOI: 10.1016/j.sleep.2016.08.006.
