

Burden and trends of thyroid cancer attributable to high body mass index in China from 1990 to 2021: evidence from the Global Burden of Disease Study
-
摘要:目的
基于全球疾病负担研究(GBD)1990—2021年数据,分析中国高BMI归因甲状腺癌(TC-HBMI)的疾病负担变化趋势、性别及年龄结构差异,并与不同社会发展指数(SDI)国家对比,阐明其流行病学特征。
方法利用GBD数据库1990—2021年数据提取中国TC-HBMI相关死亡人数、伤残调整寿命年(DALY)、年龄标准化死亡率(ASMR)和年龄标准化DALY率(ASDR),计算其估计年度百分比变化(EAPC)。采用Joinpoint回归模型识别负担变化的关键阶段。同时将中国TC-HBMI变化特征与全球及不同SDI国家进行对比。
结果2021年中国TC-HBMI死亡人数为871[95%不确定性区间(UI)588~1 177]例,DALY为23 684(95% UI 16 056~32 507)人年,分别较1990年(275例、8 267人年)增长2.17倍、1.86倍。1990—2021年ASMR稳定在0.04/10万,但ASDR由0.91/10万升至1.15/10万,ASMR和ASDR的EAPC分别为0.61%(95% CI 0.51%~0.71%)和0.76%(95% CI 0.65%~0.88%),均高于全球平均水平[0.20%(95% CI 0.17%~0.24%)和0.38%(95% CI 0.34%~0.41%)]。2021年男性TC-HBMI死亡率(0.05/10万)及DALY率(1.25/10万)均高于女性(0.04/10万、1.07/10万),≥75岁后男性疾病负担大幅超过女性;疾病负担呈“中年上升,老年高峰”特征,具有青年、高龄老年双端增长的特点。Joinpoint回归分析提示,1990—2021年中国TC HBMI疾病负担呈非线性上升趋势,以2007年为关键转折点;ASDR较ASMR增长更快,ASDR阶段性波动明显,先后在2007—2011年、2017—2021年出现两轮快速增长。不同于中高、高SDI国家的下降趋势,1990—2021年中国TC HBMI的ASMR、ASDR总体呈上升态势。
结论中国TC-HBMI疾病负担持续增长,结构性风险集中于中老年群体,男性负担呈超越女性的新趋势,青年负担亦明显上升。中国趋势与中高、高SDI国家相反。
Abstract:ObjectiveTo analyze the trends in disease burden, sex and age structure differences of thyroid cancer attributable to high body mass index (TC-HBMI) in China from 1990 to 2021 based on the Global Burden of Disease Study (GBD) data, and compare the epidemiological characteristics with the global level and countries stratified by different social demographic index (SDI) levels.
MethodsData from the GBD database for 1990 to 2021 were used to extract deaths attributable to TC-HBMI, disability-adjusted life years (DALYs), age-standardized mortality rate (ASMR), and age-standardized DALY rate (ASDR) in China. The estimated annual percentage change (EAPC) was calculated. A joinpoint regression model was used to identify the key change stages of disease burden. Meanwhile, the variation characteristics of TC-HBMI in China were compared with those globally and in different SDI countries.
ResultsIn 2021, the number of TC-HBMI-related deaths and DALYs in China was 871 (95% uncertainty interval [UI] 588-1 177) and 23 684 (95%UI 16 056-32 507) person-years, with an increase of 2.17 times and 1.86 times respectively compared with 1990 (275 deaths and 8 267 person-years). From 1990 to 2021, ASMR remained stable at 0.04/100 000, while ASDR increased from 0.91/100 000 to 1.15/100 000. The EAPCs of ASMR and ASDR were 0.61% (95% confidence interval [CI] 0.51%-0.71%) and 0.76% (95%CI 0.65%-0.88%), respectively, both of which were higher than the global average levels (0.20% [95%CI 0.17%-0.24%] and 0.38% [95%CI 0.34%-0.41%]). In 2021, male TC-HBMI mortality rate (0.05/100 000) and DALY rate (1.25/100 000) were higher than those in females (0.04/100 000 and 1.07/100 000), and the disease burden of males exceeded that of females substantially after the age of ≥75 years. The disease burden presented a characteristic of rising in middle age and peaking in old age, with a dual increasing trend in young and advanced elderly populations. Joinpoint regression analysis indicated that the disease burden of TC-HBMI in China showed a nonlinear upward trend from 1990 to 2021, with 2007 as the key turning point. ASDR grew faster than ASMR with obvious periodic fluctuations, experiencing 2 rapid growth stages during 2007-2011 and 2017-2021. Different from the declining trend of high and high-middle SDI countries, the ASMR and ASDR of TC-HBMI in China showed an overall upward trend from 1990 to 2021.
ConclusionThe disease burden of TC-HBMI in China continues to increase, with structural risks concentrated in the middle-aged and elderly population. A new trend has emerged that the disease burden of males surpasses that of females, and the burden among young people also increases significantly. The changing trend of TC-HBMI burden in China is contrary to that of high and high-middle SDI countries.
-
近年来,甲状腺癌(thyroid cancer,TC)作为全球发病率上升最快的实体肿瘤之一,引起了广泛的关注。据国际癌症研究机构发布的GLOBOCAN 2020数据显示,全球TC年龄标准化发病率在女性中为10.1/10万,在男性中为3.1/10万,性别差异显著[1]。尽管该病总体生存率较高,但其导致的健康损失及资源负担不容忽视[2-3]。在TC负担上升的背景下,越来越多的证据表明高BMI是其重要的可干预危险因素。有研究系统评估了肥胖与TC之间的流行病学联系,并指出BMI每升高5 kg/m2 TC发病风险平均上升20%~30%[4-5]。此外,大样本前瞻性研究和多项meta分析亦表明,肥胖相关的代谢紊乱状态可能在TC的发生和进展过程中发挥重要作用[6-9]。
值得注意的是,BMI上升趋势在全球多数国家呈持续性增长态势,中国亦不例外。1990-2019年,中国高BMI相关死亡率与伤残调整寿命年(disability-adjusted life year,DALY)率分别增加了111.67%和121.78%,BMI已成为我国主要的非传染性疾病负担因子之一[10-11]。然而,全球疾病负担研究(Global Burden of Disease,GBD)归因分析中与BMI相关的癌症负担,尤其是与高BMI相关的TC(high body-mass index-related thyroid cancer,TC-HBMI),在中国尚缺乏系统性、长期性研究支持。因此,本研究基于GBD数据库1990-2021年数据,系统评估了中国TC-HBMI负担的总体水平、变化趋势及其在人群结构中的分布特征,并与全球及不同社会人口指数(social demographic index,SDI)水平国家进行比较,以期为未来制定具备针对性的公共健康政策和干预策略提供循证依据。
1 资料和方法
1.1 数据来源与处理
本研究数据来源于健康指标与评估研究所(Institute for Health Metrics and Evaluation,IHME)的GBD数据库,通过其开放平台(http://ghdx.healthdata.org)获取1990-2021年GBD归因分析中TC-HBMI死亡、DALY数据。TC相关指标归类于疾病目录“非传染性疾病→肿瘤→TC”,选择风险因素为“高BMI”、区域为“中国”“全球”以及5个SDI区域、年龄为“年龄标准化”“全年龄”及16个年龄组(每5岁为一组:20~24岁、25~29岁、30~34岁、35~39岁、40~44岁、45~49岁、50~54岁、55~59岁、60~64岁、65~69岁、70~74岁、75~79岁、80~84岁、85~89岁、90~94岁、≥95岁),通过GBD结果工具提取数据。
1.2 观察指标
本研究通过年龄标准化死亡率(age-standardized mortality rate,ASMR)与年龄标准化DALY率(age-standardized DALY rate,ASDR)对TC-HBMI的疾病负担进行评估,以消除人口年龄结构差异的影响。年龄标准化是IHME使用贝叶斯元回归工具DisMod-MR 2.1整合多源数据(包括疾病监测系统、流行病学调查及队列研究),通过马尔可夫链蒙特卡洛(Markov Chain Monte Carlo,MCMC)算法生成的年龄-性别-年份特异性疾病负担估计值,并基于1 000次后验抽样计算95%不确定性区间(95% uncertainty interval,95%UI),涵盖数据测量误差、模型参数变异及缺失数据插补偏差,采用GBD全球标准人口进行年龄标化,确保跨国别、跨时期结果可比性[12]。
1.3 统计学处理
为量化TC-HBMI的长期趋势,本研究采取两阶段统计建模的方法。首先通过线性回归模型y=α+βx计算估计年度百分比变化(estimated annual percentage change,EAPC)以评估变化趋势:EAPC(%)=[exp(β)-1]×100%。其中y=ln[年龄标准化率(age-standardized rate,ASR)],x代表日历年份;α代表截距;β代表回归系数。
该指标用于分析1990-2021年间TC-HBMI的ASMR、ASDR等指标的年度变化速率[13]。其次采用Joinpoint回归分析检测时间趋势中的拐点[14],该模型通过迭代算法将时间序列划分为具有不同变化斜率的区段,并计算各段的年度百分比变化(annual percent change,APC)以及平均年度百分比变化(average annual percent change,AAPC)。最终模型通过蒙特卡洛置换检验(P<0.05)和改进贝叶斯信息准则(modified Bayesian information criterion,MBIC)筛选确定,同时采用均方误差(mean squared error,MSE)和平均绝对百分比误差(mean absolute percentage error,MAPE)评估模型拟合优度[15]。主要分析以及统计图绘制在R Studio 4.4.1软件和Joinpoint 5.1.0软件中完成,检验水准(α)为0.05(双侧)。
2 结果
2.1 TC-HBMI疾病负担总体变化趋势
如表 1所示,1990-2021年中国TC-HBMI疾病负担呈上升趋势,死亡病例数从1990年的275(95%UI 187~380)例增长至2021年的871(95%UI 588~1 177)例,增长了2.17倍;DALY从8 267(95%UI5 660~11 487)人年急剧增长至23 684(95%UI 16 056~32 507)人年,增长了1.86倍。1990-2021年中国TC-HBMI的ASMR保持在0.04/10万左右,而ASDR从0.91/10万上升至1.15/10万。中国TC-HBMI的ASMR和ASDR的EAPC分别为0.61%(95%CI 0.51%~0.71%)和0.76%(95%CI 0.65%~0.88%),均高于全球平均水平[分别为0.20%(95%CI 0.17%~0.24%)和0.38%(95%CI 0.34%~0.41%)]。作为中高SDI国家,中国呈现的上升趋势与同SDI水平国家截然相反。1990-2021年,中高SDI国家TC-HBMI的ASMR及ASDR总体呈下降趋势,对应的EAPC分别为-0.48%(95%CI -0.54%~-0.41%)和-0.40%(95%CI -0.47%~-0.33%);高SDI国家同样呈下降趋势,ASMR的EAPC为-0.47%(95%CI -0.52%~-0.42%),ASDR的EAPC为-0.20%(95%CI -0.28%~-0.12%);而经济发展水平较低的中SDI、中低SDI国家,ASMR和ASDR呈快速上升趋势。这一结果提示中国在TC-HBMI防控方面面临着与其经济发展水平不相匹配的严峻挑战,亟须深入分析原因并采取针对性的预防措施。
表 1 1990-2021年中国、全球及不同SDI国家TC-HBMI疾病负担与变化趋势Table 1 Disease burden and trend changes of TC-HBMI in China, globally, and in countries at different SDI levels, 1990-2021Index 1990 2021 EAPC (95%CI)/% Case number (95%UI) ASR (95%UI)/(×10-5) Case number (95%UI) ASR (95%UI)/(×10-5) Mortality China 275 (187, 380) 0.04 (0.02, 0.05) 871 (588, 1 177) 0.04 (0.03, 0.06) 0.61 (0.51, 0.71) Global 2 198 (1 642, 2 818) 0.06 (0.04, 0.07) 5 255 (3 914, 6 653) 0.06 (0.05, 0.08) 0.20 (0.17, 0.24) High SDI 811 (612, 1 024) 0.07 (0.06, 0.09) 1 368 (977, 1 734) 0.06 (0.05, 0.08) -0.47 (-0.52, -0.42) High-middle SDI 666 (496, 856) 0.07 (0.05, 0.09) 1 194 (882, 1 509) 0.06 (0.04, 0.08) -0.48 (-0.54, -0.41) Middle SDI 434 (321, 567) 0.04 (0.03, 0.06) 1 649 (1 201, 2 116) 0.06 (0.05, 0.08) 1.18 (1.12, 1.24) Low-middle SDI 197 (142, 264) 0.03 (0.02, 0.04) 782 (584, 1 013) 0.05 (0.04, 0.07) 1.80 (1.76, 1.83) Low SDI 86 (60, 120) 0.04 (0.02, 0.05) 256 (177, 355) 0.05 (0.03, 0.07) 0.92 (0.83, 1.01) DALY/(person-year) China 8 267 (5 660, 11 487) 0.91 (0.62, 1.26) 23 684 (16 056, 32 507) 1.15 (0.78, 1.57) 0.76 (0.65, 0.88) Global 61 816 (46 571, 79 116) 1.49 (1.12, 1.90) 144 955 (109 230, 184 747) 1.68 (1.26, 2.14) 0.38 (0.34, 0.41) High SDI 20 543 (15 669, 25 939) 1.91 (1.46, 2.41) 32 562 (24 816, 41 098) 1.75 (1.32, 2.20) -0.20 (-0.28, -0.12) High-middle SDI 18 467 (13 894, 23 642) 1.81 (1.36, 2.32) 31 264 (23 243, 40 272) 1.63 (1.21, 2.10) -0.40 (-0.47, -0.33) Middle SDI 13 304 (9 887, 17 216) 1.15 (0.86, 1.50) 47 448 (35 193, 60 878) 1.71 (1.27, 2.20) 1.28 (1.22, 1.35) Low-middle SDI 6 410 (4 655, 8 632) 0.90 (0.65, 1.21) 24 618 (18 601, 32 274) 1.54 (1.16, 2.02) 1.84 (1.81, 1.88) Low SDI 2 975 (2 067, 4 183) 1.06 (0.74, 1.48) 8 911 (6 160, 12 571) 1.38 (0.96, 1.91) 0.76 (0.67, 0.86) SDI quintiles were categorized as low SDI (<0.47), low-middle SDI (0.47-0.62), middle SDI (0.63-0.71), high-middle SDI (0.72-0.81), and high SDI (>0.81). SDI: Social demographic index; TC-HBMI: High body-mass index-related thyroid cancer; ASR: Age-standardized rate; EAPC: Estimated annual percentage change; 95%UI: 95% uncertainty interval; 95%CI: 95% confidence interval. 2.2 TC-HBMI与总体TC疾病负担对比
在死亡人数方面,1990年TC-HBMI相关死亡占同期TC总死亡的7.6%(275/3 599),而到2021年,TC-HBMI相关死亡占比增至11.3%(871/7 692),32年间TC-HBMI死亡人数占比相对增长了约50%。在ASMR方面,1990年TC-HBMI相关ASMR(0.035/10万)占同期TC总ASMR(0.390/10万)的8.97%,至2021年,TC-HBMI相关ASMR(0.043/10万)占当年TC总ASMR(0.460/10万)的9.35%,ASMR占比相对增长约4.2%,反映出高BMI对TC死亡负担的影响日益显著。见图 1。在DALY方面,1990年TC-HBMI相关DALY为8 267人年,占同期TC总DALY(110 736人年)的7.5%;至2021年,TC-HBMI相关DALY上升至23 684人年,占当年TC总DALY(203 325人年)的11.7%,可见DALY占比相对增长幅度超过50%。在ASDR方面,1990年TC-HBMI相关ASDR(0.91/10万)占同期TC总ASDR(10.75/10万)的8.47%,至2021年,TC-HBMI相关ASDR(1.15/10万)占当年TC总ASDR(12.20/10万)的9.43%,ASDR占比相对增长约11.3%。见图 2。这表明,高BMI对中国TC负担的贡献日益显著,已成为不可忽视的影响因素。
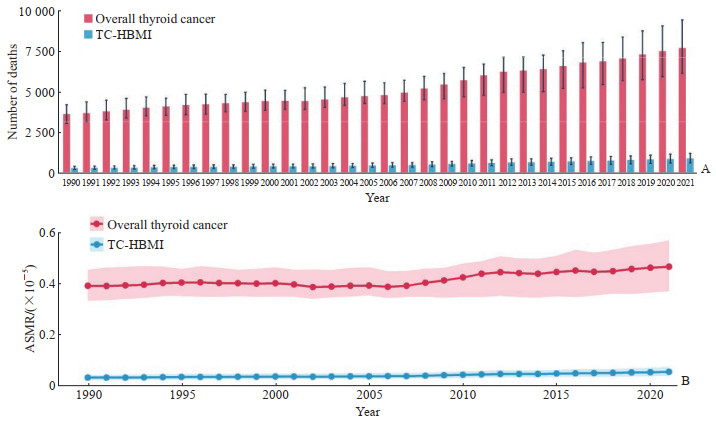 图 1 1990-2021年中国TC-HBMI与总体甲状腺癌死亡人数(A)及ASMR(B)Fig. 1 Number of deaths (A) and ASMR (B) from TC-HBMI and overall thyroid cancer in China, 1990-2021Error bars/shaded areas=95% uncertainty interval. TC-HBMI: High body-mass index-related thyroid cancer; ASMR: Age-standardized mortality rate.
 下载:
全尺寸图片
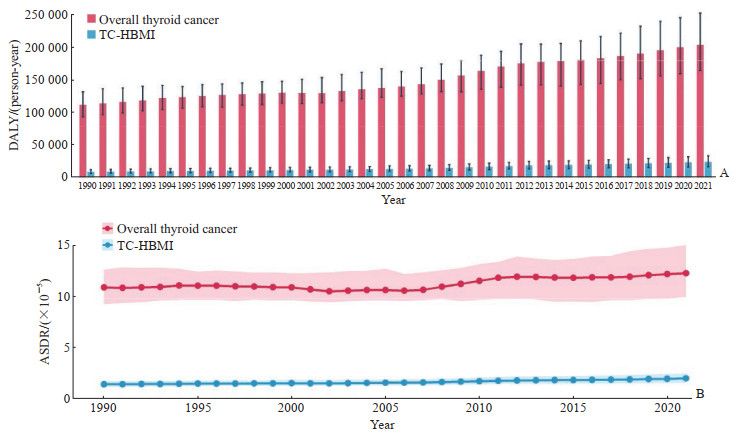 图 2 1990-2021年中国TC-HBMI与总体甲状腺癌DALY(A)及ASDR(B)Fig. 2 Number of DALY (A) and ASDR (B) from TC-HBMI and overall thyroid cancer in China, 1990-2021Error bars/shaded areas=95% uncertainty interval. TC-HBMI: High body-mass index-related thyroid cancer; DALY: Disability-adjusted life year; ASDR: Age-standardized DALY rate.下载:
全尺寸图片
2.3 TC-HBMI性别、年龄差异分析
2021年中国TC-HBMI疾病负担的性别分布呈现出新的特征,男性死亡人数(455人)略多于女性(416人),男性DALY(12 277人年)与女性(11 409人年)较为接近(图 3)。2021年,男性TC-HBMI死亡率(0.05/10万)及DALY率(1.25/10万)均高于女性(0.04/10万、1.07/10万)。性别差异随年龄变化呈现出显著的异质性,<75岁时男女TC-HBMI疾病负担随年龄变化交替上升;≥75岁时男性各年龄组的死亡率和DALY率均呈现“爆发式增长”,均超过女性且总体差距随年龄增大而急剧扩大:75~79岁时男性死亡率(0.58/10万)为女性(0.33/10万)的1.8倍,男性DALY率(9.62/10万)为女性(5.63/10万)的1.7倍;85~89岁时男性死亡率(1.16/10万)为女性(0.47/10万)的2.5倍,男性DALY率(11.76/10万)为女性(4.86/10万)的2.4倍;90~94岁时差距达到顶峰,男性死亡率(1.44/10万)为女性(0.55/10万)的2.6倍,男性DALY率(12.69/10万)为女性(4.81/10万)的2.6倍。见图 4。
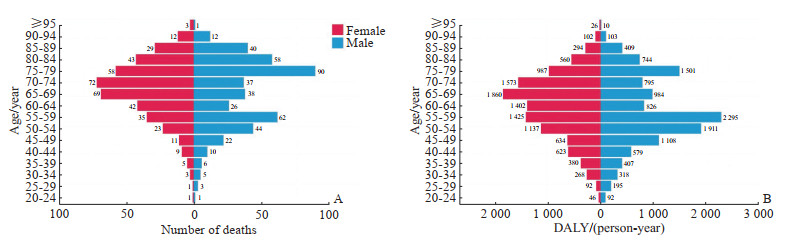 图 3 2021年中国不同性别与年龄组TC-HBMI死亡人数(A)和DALY(B)Fig. 3 Age- and sex-specific number of deaths (A) and DALY (B) attributable to TC-HBMI in China, 2021TC-HBMI: High body-mass index-related thyroid cancer; DALY: Disability-adjusted life year.下载:
全尺寸图片
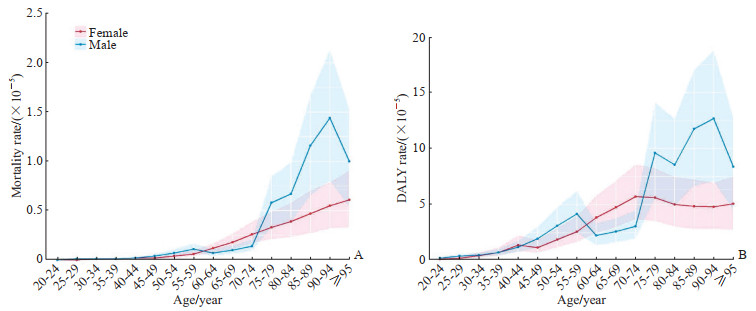 图 4 2021年中国不同性别与年龄组TC-HBMI死亡率(A)和DALY率(B)Fig. 4 Age- and sex-specific mortality rates (A) and DALY rates (B) attributable to TC-HBMI in China, 2021Error bars/shaded areas=95% uncertainty interval. TC-HBMI: High body-mass index-related thyroid cancer; DALY: Disability-adjusted life year.下载:
全尺寸图片
年龄对TC-HBMI疾病负担的影响呈现明显的“中年上升,老年高峰”趋势,同时在1990-2021年的观察周期中,不同年龄段的增长速率也表现出分化(表 2)。一是疾病负担集中于中老年及高龄老年群体,2021年DALY率在75~79岁年龄组达到全人群峰值(7.51/10万),而死亡率高峰进一步后移至85岁及以上高龄组;45岁之后,死亡率与DALY率随年龄增长整体抬升。二是增长趋势呈现青年、高龄老年双端增长特征,DALY率增幅较高的年龄组包括25~29岁、85~89岁、90~94岁,同时45~79岁中老年组也保持较高增速;尽管20~39岁各年龄组死亡率仍接近0,但DALY率均出现明显上升,提示年轻人群已经出现由疾病带来的健康寿命损失。
表 2 1990年与2021年中国各年龄组TC-HBMI疾病负担及变化率Table 2 Age-specific disease burden of TC-HBMI and its rate of change in China, 1990 and 2021Age/year Mortality rate/(×10-5) DALY rate/(×10-5) 1990 2021 Absolute difference Percentage change/% 1990 2021 Absolute difference Percentage change/% 20-24 0.00 0.00 0.00 0.14 0.19 0.05 35.71 25-29 0.00 0.00 0.00 0.22 0.33 0.11 50.00 30-34 0.01 0.01 0.00 0.00 0.35 0.48 0.13 37.14 35-39 0.01 0.01 0.00 0.00 0.56 0.74 0.18 32.14 40-44 0.02 0.02 0.00 0.00 1.03 1.31 0.28 27.18 45-49 0.02 0.03 0.01 50.00 1.14 1.58 0.44 38.60 50-54 0.05 0.06 0.01 20.00 1.99 2.52 0.53 26.63 55-59 0.08 0.09 0.01 12.50 2.80 3.38 0.58 20.71 60-64 0.09 0.09 0.00 0.00 2.73 3.05 0.32 11.72 65-69 0.13 0.14 0.01 7.69 3.34 3.71 0.37 11.08 70-74 0.19 0.21 0.02 10.53 3.92 4.44 0.52 13.27 75-79 0.33 0.45 0.12 36.36 5.36 7.51 2.15 40.11 80-84 0.37 0.51 0.14 37.84 4.73 6.59 1.86 39.32 85-89 0.47 0.72 0.25 53.19 4.84 7.38 2.54 52.48 90-94 0.55 0.79 0.24 43.64 4.85 6.99 2.14 44.12 ≥95 0.54 0.69 0.15 27.78 4.55 5.71 1.16 25.49 TC-HBMI: High body-mass index-related thyroid cancer; DALY: Disability-adjusted life year. 2.4 TC-HBMI疾病负担Joinpoint回归分析
Joinpoint回归分析显示,1990-2021年中国TC-HBMI疾病负担呈现出显著但非线性的上升趋势(表 3)。在ASMR方面,AAPC为0.620 9%(95%CI 0.448 2%~0.793 9%,P<0.001),整体呈增长趋势。分阶段来看,1990-1996年ASMR呈现增长态势,1996-2007年略有下降(APC=-0.220 7%,P=0.016),但在2007-2011年出现显著反弹(APC=2.786 3%,P<0.001),此后在2011-2021年进入相对平稳上升阶段(APC=0.464 4%,P<0.001)。ASDR的变化更为复杂,经历了多个拐点:1990-1995年已见显著上升,1999-2002年一度出现下降(APC=-0.823 2%,P=0.190),但从2007年起进入快速增长期(2007-2011年APC=2.978 8%,P<0.001),并在2017-2021年上升速度再度加快(APC=1.136 8%,P<0.001)。总体来看,2007年为中国TC-HBMI负担变化的关键转折点,而ASDR增长快于ASMR,提示其对健康寿命损失的影响日益加重。
表 3 1990-2021年中国TC-HBMI疾病负担Joinpoint回归分析Table 3 Joinpoint regression analysis of TC-HBMI disease burden trends in China, 1990-2021% Variable Time period APC (95%CI) AAPC (95%CI) P value ASMR 1990-1996 1.003 7 (0.589 3, 1.419 8) <0.001 1996-2007 -0.220 7 (-0.395 1, -0.046 0) 0.016 2007-2011 2.786 3 (1.676 0, 3.908 8) <0.001 2011-2021 0.464 4 (0.283 2, 0.646 0) <0.001 1990-2021 0.620 9 (0.448 2, 0.793 9) <0.001 ASDR 1990-1995 0.941 4 (0.625 2, 1.258 6) <0.001 1995-1999 0.138 0 (-0.504 7, 0.784 9) 0.650 1999-2002 -0.823 2 (-2.104 1, 0.474 5) 0.190 2002-2007 0.412 2 (0.001 6, 0.824 4) 0.049 2007-2011 2.978 8 (2.320 7, 3.641 2) <0.001 2011-2017 0.480 5 (0.182 9, 0.778 9) <0.001 2017-2021 1.136 8 (0.692 2, 1.583 3) <0.001 1990-2021 0.775 6 (0.587 8, 0.963 9) <0.001 TC-HBMI: High body-mass index-related thyroid cancer; APC: Annual percent change; AAPC: Average annual percent change; ASMR: Age-standardized mortality rate; ASDR: Age-standardized disability-adjusted life-year rate. 3 讨论
本研究发现,中国1990-2021年TC-HBMI死亡与DALY呈持续上升趋势,与同期中高SDI国家普遍下降的态势形成鲜明对比。这提示中国在癌症防控体系构建中存在经济发展与健康治理脱节的结构性问题。在经济快速增长与生活方式剧烈转变的背景下,中国人口肥胖率大幅上升[10],但公共卫生系统对肥胖后果的干预滞后,高BMI并未真正纳入肿瘤防控政策议程。与高SDI国家在2000年前后即已实施以BMI为核心指标的干预体系不同,中国在2005年前后仍将肥胖视为营养问题而非疾病负担源,导致延误了关键干预窗口期[16]。TC本身长期被视为“预后良好”“过度诊断”的肿瘤类型,在政策资源配置中优先级不高[1-2],这一认知在一定程度上掩盖了高BMI所贡献的结构性健康风险,尤其对DALY影响的评估被系统性低估,政策反应机制缺位。此外,医疗技术(如高分辨率超声)带来了更早期、更小病灶的诊断,但并未有效转化为针对危险因素的控制。相反,过度依赖影像筛查,忽视了生活方式干预,强化了“发现即治疗”的医疗导向,未建立起对高BMI引发癌症负担的逆向预防体系[17]。本研究结果提示,未来需在社区卫生层面加强对高BMI的筛查与管理,并探索将其作为癌症防控切入点的可行性。
除绝对负担上升外,TC-HBMI在TC总死亡人数和DALY中的相对占比也显著提升,分别上升至11.3%和11.7%,相对增长幅度均在50%左右。这种趋势标志着高BMI在TC病因构成中的流行病学权重发生质变,成为重要的解释变量[18]。一方面,这可能反映了中国TC病例结构正在发生“代谢型迁移”。有研究指出,与传统辐射暴露或碘摄入相关的TC负担比重正在下降,而与代谢综合征、胰岛素抵抗相关的病例占比逐渐上升[4-5]。从生物学机制看,高BMI可能通过多种途径促进TC的发生与发展,包括慢性炎症状态(如脂肪组织分泌促炎细胞因子)、胰岛素抵抗与高胰岛素血症以及雌激素水平的变化等[19-21]。另一方面,中国尚缺乏跨癌种的综合性BMI干预策略,难以遏制高BMI相关癌症负担在癌谱中占比的持续升高。美国和西欧已将高BMI作为心血管病和癌症的共通风险因子统一管理[6, 8],而中国长期采用“疾病-科室”碎片化管理方式,使得高BMI在多种癌种中形成“风险扩散”。此外,TC-HBMI发病率上升趋势在政策层面缺乏清晰归属,卫生政策上既非慢性病核心也非癌症防控重点,处于资源配置的“真空地带”。鉴于BMI在TC发病机制中的关键作用,其流行病学地位变化应推动肿瘤政策设计从疾病导向向危险因素导向转型,强化交叉疾病管理能力。
本研究结果显示,2021年TC-HBMI的死亡率和DALY率均显示男性的负担超过了女性,这可能反映了近年来男性肥胖率快速上升、男性健康管理意识相对薄弱,以及吸烟、饮酒等与BMI有协同效应的危险因素的性别差异有关[22-23]。与此同时,中老年女性(45~74岁)仍然是疾病负担的主要群体之一,其机制可能与雌激素代谢、脂肪组织分布及促甲状腺激素调节机制有关[4, 24-25]。女性在婚育期和绝经期前后更易出现体重波动,但目前针对这一特定阶段的癌症预防教育和干预措施极为薄弱,尤其在基层医疗系统中尚未建立生命历程视角的风险识别路径。青年群体(25~29岁)DALY率相对增幅达50.00%,提示TC-HBMI负担呈现出年轻化趋势。高BMI导致的生活质量损失已在劳动年龄早期阶段显现,若干年后可能在发病率与死亡率上形成滞后性爆发[26]。社会层面,青年人群中“过度饮食-运动缺乏-心理压力”的组合构成健康风险“温床”。面对“男性负担加重及青年人群风险上升”的双重挑战,未来需推动更具性别针对性的健康服务,并将BMI管理前置到青年阶段,构建生命全程防控体系。
Joinpoint回归分析揭示了2007年是ASMR和ASDR上升的关键拐点。其可能与中国经济快速发展期居民生活方式西化、肥胖率开始显著攀升有关[27]。理论上,这种趋势性变化应成为政策响应的触发器,但中国缺乏基于疾病负担趋势的早期预警与主动干预机制,政策层面存在响应滞后。其深层原因在于:一是现有癌症监测机制主要基于发病率与死亡率,未系统整合风险因素与疾病负担数据;二是慢病与癌症的数据壁垒未打通,导致BMI相关癌症的动态识别难以实现[28-29];三是国家层面尚未设立基于EAPC等指标的干预启动标准。同时,作为“生存率高、发病率增加”的肿瘤类型,TC往往被视为政策优先级较低,这进一步削弱了应对策略的紧迫性。Joinpoint回归分析中2017年也是DALY率上升的捌点,这一趋势变化可能与TC筛查技术的普及和诊断敏感性的提高存在关联[30-31]。国际经验显示,建立动态预测模型并与政策决策机制连接是应对此类“隐性突发负担”的关键路径[6]。本研究结果支持建立“国家级高BMI相关癌症动态监测机制”的必要性,未来研究可致力于将TC-HBMI负担变化率等指标转化为有效的政策预警工具。
本研究存在以下局限性。首先,作为一项基于GBD数据的描述性研究,未能控制肿瘤病理类型(如未分化癌、髓样癌的占比)、诊断时期、治疗方式等其他权重大的影响因素,所观察到的趋势可能受到多种混杂因素的影响。GBD数据库未提供TC亚型的细分数据,因此未分析不同病理类型与高BMI关联的差异,这可能是未来研究的方向之一。其次,GBD的归因估算依赖于一系列假设和模型,其关于高BMI与TC死亡之间关联强度的证据主要来源于流行病学关联性研究,而非直接的因果关系证明。术语“归因”在此处是GBD分析框架下的特定概念,应理解为统计学上的贡献而非确切的生物学因果关系。最后,对Joinpoint回归识别拐点的解释仅限于宏观背景推测,未来需结合更具体的历史政策与临床实践数据进行分析。
-
图 1 1990-2021年中国TC-HBMI与总体甲状腺癌死亡人数(A)及ASMR(B)
Fig. 1 Number of deaths (A) and ASMR (B) from TC-HBMI and overall thyroid cancer in China, 1990-2021
Error bars/shaded areas=95% uncertainty interval. TC-HBMI: High body-mass index-related thyroid cancer; ASMR: Age-standardized mortality rate.
下载:
全尺寸图片
图 2 1990-2021年中国TC-HBMI与总体甲状腺癌DALY(A)及ASDR(B)
Fig. 2 Number of DALY (A) and ASDR (B) from TC-HBMI and overall thyroid cancer in China, 1990-2021
Error bars/shaded areas=95% uncertainty interval. TC-HBMI: High body-mass index-related thyroid cancer; DALY: Disability-adjusted life year; ASDR: Age-standardized DALY rate.
下载:
全尺寸图片
图 3 2021年中国不同性别与年龄组TC-HBMI死亡人数(A)和DALY(B)
Fig. 3 Age- and sex-specific number of deaths (A) and DALY (B) attributable to TC-HBMI in China, 2021
TC-HBMI: High body-mass index-related thyroid cancer; DALY: Disability-adjusted life year.
下载:
全尺寸图片
图 4 2021年中国不同性别与年龄组TC-HBMI死亡率(A)和DALY率(B)
Fig. 4 Age- and sex-specific mortality rates (A) and DALY rates (B) attributable to TC-HBMI in China, 2021
Error bars/shaded areas=95% uncertainty interval. TC-HBMI: High body-mass index-related thyroid cancer; DALY: Disability-adjusted life year.
下载:
全尺寸图片
表 1 1990-2021年中国、全球及不同SDI国家TC-HBMI疾病负担与变化趋势
Table 1 Disease burden and trend changes of TC-HBMI in China, globally, and in countries at different SDI levels, 1990-2021
Index 1990 2021 EAPC (95%CI)/% Case number (95%UI) ASR (95%UI)/(×10-5) Case number (95%UI) ASR (95%UI)/(×10-5) Mortality China 275 (187, 380) 0.04 (0.02, 0.05) 871 (588, 1 177) 0.04 (0.03, 0.06) 0.61 (0.51, 0.71) Global 2 198 (1 642, 2 818) 0.06 (0.04, 0.07) 5 255 (3 914, 6 653) 0.06 (0.05, 0.08) 0.20 (0.17, 0.24) High SDI 811 (612, 1 024) 0.07 (0.06, 0.09) 1 368 (977, 1 734) 0.06 (0.05, 0.08) -0.47 (-0.52, -0.42) High-middle SDI 666 (496, 856) 0.07 (0.05, 0.09) 1 194 (882, 1 509) 0.06 (0.04, 0.08) -0.48 (-0.54, -0.41) Middle SDI 434 (321, 567) 0.04 (0.03, 0.06) 1 649 (1 201, 2 116) 0.06 (0.05, 0.08) 1.18 (1.12, 1.24) Low-middle SDI 197 (142, 264) 0.03 (0.02, 0.04) 782 (584, 1 013) 0.05 (0.04, 0.07) 1.80 (1.76, 1.83) Low SDI 86 (60, 120) 0.04 (0.02, 0.05) 256 (177, 355) 0.05 (0.03, 0.07) 0.92 (0.83, 1.01) DALY/(person-year) China 8 267 (5 660, 11 487) 0.91 (0.62, 1.26) 23 684 (16 056, 32 507) 1.15 (0.78, 1.57) 0.76 (0.65, 0.88) Global 61 816 (46 571, 79 116) 1.49 (1.12, 1.90) 144 955 (109 230, 184 747) 1.68 (1.26, 2.14) 0.38 (0.34, 0.41) High SDI 20 543 (15 669, 25 939) 1.91 (1.46, 2.41) 32 562 (24 816, 41 098) 1.75 (1.32, 2.20) -0.20 (-0.28, -0.12) High-middle SDI 18 467 (13 894, 23 642) 1.81 (1.36, 2.32) 31 264 (23 243, 40 272) 1.63 (1.21, 2.10) -0.40 (-0.47, -0.33) Middle SDI 13 304 (9 887, 17 216) 1.15 (0.86, 1.50) 47 448 (35 193, 60 878) 1.71 (1.27, 2.20) 1.28 (1.22, 1.35) Low-middle SDI 6 410 (4 655, 8 632) 0.90 (0.65, 1.21) 24 618 (18 601, 32 274) 1.54 (1.16, 2.02) 1.84 (1.81, 1.88) Low SDI 2 975 (2 067, 4 183) 1.06 (0.74, 1.48) 8 911 (6 160, 12 571) 1.38 (0.96, 1.91) 0.76 (0.67, 0.86) SDI quintiles were categorized as low SDI (<0.47), low-middle SDI (0.47-0.62), middle SDI (0.63-0.71), high-middle SDI (0.72-0.81), and high SDI (>0.81). SDI: Social demographic index; TC-HBMI: High body-mass index-related thyroid cancer; ASR: Age-standardized rate; EAPC: Estimated annual percentage change; 95%UI: 95% uncertainty interval; 95%CI: 95% confidence interval. 表 2 1990年与2021年中国各年龄组TC-HBMI疾病负担及变化率
Table 2 Age-specific disease burden of TC-HBMI and its rate of change in China, 1990 and 2021
Age/year Mortality rate/(×10-5) DALY rate/(×10-5) 1990 2021 Absolute difference Percentage change/% 1990 2021 Absolute difference Percentage change/% 20-24 0.00 0.00 0.00 0.14 0.19 0.05 35.71 25-29 0.00 0.00 0.00 0.22 0.33 0.11 50.00 30-34 0.01 0.01 0.00 0.00 0.35 0.48 0.13 37.14 35-39 0.01 0.01 0.00 0.00 0.56 0.74 0.18 32.14 40-44 0.02 0.02 0.00 0.00 1.03 1.31 0.28 27.18 45-49 0.02 0.03 0.01 50.00 1.14 1.58 0.44 38.60 50-54 0.05 0.06 0.01 20.00 1.99 2.52 0.53 26.63 55-59 0.08 0.09 0.01 12.50 2.80 3.38 0.58 20.71 60-64 0.09 0.09 0.00 0.00 2.73 3.05 0.32 11.72 65-69 0.13 0.14 0.01 7.69 3.34 3.71 0.37 11.08 70-74 0.19 0.21 0.02 10.53 3.92 4.44 0.52 13.27 75-79 0.33 0.45 0.12 36.36 5.36 7.51 2.15 40.11 80-84 0.37 0.51 0.14 37.84 4.73 6.59 1.86 39.32 85-89 0.47 0.72 0.25 53.19 4.84 7.38 2.54 52.48 90-94 0.55 0.79 0.24 43.64 4.85 6.99 2.14 44.12 ≥95 0.54 0.69 0.15 27.78 4.55 5.71 1.16 25.49 TC-HBMI: High body-mass index-related thyroid cancer; DALY: Disability-adjusted life year. 表 3 1990-2021年中国TC-HBMI疾病负担Joinpoint回归分析
Table 3 Joinpoint regression analysis of TC-HBMI disease burden trends in China, 1990-2021
% Variable Time period APC (95%CI) AAPC (95%CI) P value ASMR 1990-1996 1.003 7 (0.589 3, 1.419 8) <0.001 1996-2007 -0.220 7 (-0.395 1, -0.046 0) 0.016 2007-2011 2.786 3 (1.676 0, 3.908 8) <0.001 2011-2021 0.464 4 (0.283 2, 0.646 0) <0.001 1990-2021 0.620 9 (0.448 2, 0.793 9) <0.001 ASDR 1990-1995 0.941 4 (0.625 2, 1.258 6) <0.001 1995-1999 0.138 0 (-0.504 7, 0.784 9) 0.650 1999-2002 -0.823 2 (-2.104 1, 0.474 5) 0.190 2002-2007 0.412 2 (0.001 6, 0.824 4) 0.049 2007-2011 2.978 8 (2.320 7, 3.641 2) <0.001 2011-2017 0.480 5 (0.182 9, 0.778 9) <0.001 2017-2021 1.136 8 (0.692 2, 1.583 3) <0.001 1990-2021 0.775 6 (0.587 8, 0.963 9) <0.001 TC-HBMI: High body-mass index-related thyroid cancer; APC: Annual percent change; AAPC: Average annual percent change; ASMR: Age-standardized mortality rate; ASDR: Age-standardized disability-adjusted life-year rate. -
[1] Pizzato M, Li M, Vignat J, et al. The epidemiological landscape of thyroid cancer worldwide:GLOBOCAN estimates for incidence and mortality rates in 2020[J]. Lancet Diabetes Endocrinol, 2022, 10(4):264-272. DOI: 10.1016/S2213-8587(22)00035-3. [2] Chen D W, Lang B H H, McLeod D S A, et al. Thyroid cancer[J]. Lancet, 2023, 401(10387): 1531-1544. DOI: 10.1016/S0140-6736(23)00020-X. [3] Huang K, Huang X, Qian S, et al. Temporal trends of thyroid cancer in China and globally from 1990 to 2021: an analysis of the Global Burden of Disease Study 2021[J]. Sci Rep, 2024, 14(1): 25538. DOI: 10.1038/s41598-024-77663-5. [4] Franchini F, Palatucci G, Colao A, et al. Obesity and thyroid cancer risk: an update[J]. Int J Environ Res Public Health, 2022, 19(3): 1116. DOI: 10.3390/ijerph19031116. [5] Zhao Z G, Guo X G, Ba C X, et al. Overweight, obesity and thyroid cancer risk: a meta-analysis of cohort studies[J]. J Int Med Res, 2012, 40(6): 2041-2050. DOI: 10.1177/030006051204000601. [6] Pasqual E, O'Brien K, Rinaldi S, et al. Obesity, obesity-related metabolic conditions, and risk of thyroid cancer in women: results from a prospective cohort study (sister study)[J]. Lancet Reg Health Am, 2023, 23: 100537. DOI: 10.1016/j.lana.2023.100537. [7] Pappa T, Alevizaki M. Obesity and thyroid cancer: a clinical update[J]. Thyroid®, 2014, 24(2): 190-199. DOI: 10.1089/thy.2013.0232. [8] SADEGHI H, RAFEI M, BAHRAMI M, et al. Attributable risk fraction of four lifestyle risk factors of thyroid cancer: a meta-analysis[J]. J Public Health (Oxf), 2018, 40(2): e91-e98. DOI: 10.1093/pubmed/fdx088. [9] Wu Y Y, Cheng S P, Chiou P Y, et al. Association between subjective symptoms and obesity and postoperative recurrence in differentiated thyroid cancer: a matched-pair analysis[J]. Sci Rep, 2020, 10(1): 3679. DOI: 10.1038/s41598-020-60276-z. [10] Chen Y, Ma L, Han Z, et al. The global burden of disease attributable to high body mass index in 204 countries and territories: findings from 1990 to 2019 and predictions to 2035[J]. Diabetes Obes Metab, 2024, 26(9): 3998-4010. DOI: 10.1111/dom.15748. [11] Chen Y X, Hong H Z, Gao Z H, et al. Global trend and disparity in the burden of thyroid cancer attributable to high body-mass index from 1990 to 2021 and projection to 2049: a systematic analysis based on the Global Burden of Disease Study 2021[J]. BMC Public Heal, 2025, 25: 1051. DOI: 10.1186/s12889-025-21960-9. [12] GBD 2021 Demographics Collaborators. Global age-sex-specific mortality, life expectancy, and population estimates in 204 countries and territories and 811 subnational locations, 1950-2021, and the impact of the COVID-19 pandemic: a comprehensive demographic analysis for the Global Burden of Disease Study 2021[J]. Lancet, 2024, 403(10440): 1989-2056. DOI: 10.1016/S0140-6736(24)00476-8. [13] Li N, Deng Y, Zhou L, et al. Global burden of breast cancer and attributable risk factors in 195 countries and territories, from 1990 to 2017: results from the Global Burden of Disease Study 2017[J]. J Hematol Oncol, 2019, 12(1): 140. DOI: 10.1186/s13045-019-0828-0. [14] 李辉章, 杜灵彬. Joinpoint回归模型在肿瘤流行病学时间趋势分析中的应用[J]. 中华预防医学杂志, 2020, 54(8): 908-912. DOI: 10.3760/cma.j.cn112150-20200616-00889. [15] 曾四清. 序列累计和数据Joinpoint回归模型构建及应用研究[J]. 中华预防医学杂志, 2019, 53(10): 1075-1080. DOI: 10.3760/cma.j.issn.0253-9624.2019.10.024. [16] GBD 2021 Diseases and Injuries Collaborators. Global incidence, prevalence, years lived with disability (YLDs), disability-adjusted life-years (DALYs), and healthy life expectancy (HALE) for 371 diseases and injuries in 204 countries and territories and 811 subnational locations, 1990-2021: a systematic analysis for the Global Burden of Disease Study 2021[J]. Lancet, 2024, 403(10440): 2133-2161. DOI: 10.1016/S0140-6736(24)00757-8. [17] Kyrgiou M, Kalliala I, Markozannes G, et al. Adiposity and cancer at major anatomical sites: umbrella review of the literature[J]. BMJ, 2017, 356: j477. DOI: 10.1136/bmj.j477. [18] Agate L, Lorusso L, Elisei R. New and old knowledge on differentiated thyroid cancer epidemiology and risk factors[J]. J Endocrinol Invest, 2012, 35(6 Suppl): 3-9. [19] Biswas P, Datta C, Rathi P, et al. Fatty acids and their lipid mediators in the induction of cellular apoptosis in cancer cells[J]. Prostaglandins Other Lipid Mediat, 2022, 160: 106637. DOI: 10.1016/j.prostaglandins.2022.106637. [20] Kushchayeva Y, Kushchayev S, Jensen K, et al. Impaired glucose metabolism, anti-diabetes medications, and risk of thyroid cancer[J]. Cancers, 2022, 14(3): 555. DOI: 10.3390/cancers14030555. [21] Avgerinos K I, Spyrou N, Mantzoros C S, et al. Obesity and cancer risk: emerging biological mechanisms and perspectives[J]. Metabolism, 2019, 92: 121-135. DOI: 10.1016/j.metabol.2018.11.001. [22] Bhaskaran K, Douglas I, Forbes H, et al. Body-mass index and risk of 22 specific cancers: a population-based cohort study of 5·24 million UK adults[J]. Lancet, 2014, 384(9945): 755-765. DOI: 10.1016/S0140-6736(14)60892-8. [23] Lee J H, Chai Y J, Yi K H. Effect of cigarette smoking on thyroid cancer: meta-analysis[J]. Endocrinol Metab (Seoul), 2021, 36(3): 590-598. DOI: 10.3803/EnM.2021.954. [24] Shi X, Tang H, Zhang T, et al. Thyroid-stimulating hormone suppression in low-risk papillary thyroid cancer: a large-scale retrospective analysis of real-world data[J]. EClinicalMedicine, 2024, 77: 102912. DOI: 10.1016/j.eclinm.2024.102912. [25] Yeo Y, Ma S H, Hwang Y, et al. Diabetes mellitus and risk of thyroid cancer: a meta-analysis[J]. PLoS One, 2014, 9(6): e98135. DOI: 10.1371/journal.pone.0098135. [26] Oh S W, Yoon Y S, Shin S A. Effects of excess weight on cancer incidences depending on cancer sites and histologic findings among men: Korea National Health Insurance Corporation Study[J]. J Clin Oncol, 2005, 23(21): 4742-4754. DOI: 10.1200/jco.2005.11.726. [27] Pan X F, Wang L, Pan A. Epidemiology and determinants of obesity in China[J]. Lancet Diabetes Endocrinol, 2021, 9(6): 373-392. DOI: 10.1016/S2213-8587(21)00045-0. [28] Recalde M, Davila-Batista V, Díaz Y, et al. Body mass index and waist circumference in relation to the risk of 26 types of cancer: a prospective cohort study of 3.5 million adults in Spain[J]. BMC Med, 2021, 19(1): 10. DOI: 10.1186/s12916-020-01877-3. [29] Tu H, Wen C P, Tsai S P, et al. Cancer risk associated with chronic diseases and disease markers: prospective cohort study[J]. BMJ, 2018, 360: k134. DOI: 10.1136/bmj.k134. [30] Kim N H, Han J S, Bae W K, et al. Changes in diagnostic performance of thyroid cancer screening before and after the Korean thyroid imaging reporting and data system revision[J]. Korean J Fam Med, 2022, 43(4): 225-230. DOI: 10.4082/kjfm.21.0168. [31] Panato C, Serraino D, de Santis E, et al. Thyroid cancer in Friuli Venezia Giulia, northeastern Italy: incidence, overdiagnosis, and impact of type of surgery on survival[J]. Tumori, 2019, 105(4): 296-303. DOI: 10.1177/0300891619839307.
