Anharmonic Properties of Aluminum from Direct Free Energy Interpolation Method*

Supported by the National Natural Science Foundation of China under Grant No. 41574076, the Young Core Teacher Scheme of Henan Province under Grant No. 2014GGJS-108, and the Fundamental and Cutting-edge Technology Research Program of Henan Province under Grant No. 152300410218

Zhao Zhi-Guo1, Sun Jun-Sheng2, Zhang Xiu-Lu3, Yang Hai-Feng1, Liu Zhong-Li1, *
College of Physics and Electric Information, Luoyang Normal University, Luoyang 471022, China
The Unit 63615 of People's Liberation Army, Kuerle 841001, China
Laboratory for Extreme Conditions Matter Properties, Southwest University of Science and Technology, Mianyang 621010, China


† Corresponding author. E-mail: zl.liu@163.com

Abstract
Abstract

We compare the direct free energy interpolation (DFEI) method and the quasi-harmonic approximation (QHA) in calculating of the equation of states and thermodynamic properties of prototype Al. The Gibbs free energy of Al is calculated using the DFEI method based on the high-temperature phonon density of states reduced from classical molecular dynamics simulations. Then, we reproduce the thermal expansion coefficients, the specific heat, the isothermal bulk modulus of Al accurately. By comparing the results from the DFEI method and the QHA, we find that the DFEI method is indeed more accurate in calculating anharmonic properties than the QHA.

1 Introduction

Like platinum and tungsten, aluminum is another frequently used pressure standard material in high-pressure experiments, such as the shock wave experiment. The pressure-volume-temperature equation of states (EOS) provides key information for it as a pressure standard.[1] Al is a typical sp-bonded simple metal and crystallized in face-centered-cubic structure under ambient conditions. With the simple electronic and lattice structures, it is often taken as a typical prototype for theoretical calculations.[23] For the theoretical calculation of free energy, the accurate anharmonic effects are very hard to be taken into account in the theoretical EOS in previous methods.

Usually, the quasi-harmonic approximation (QHA) was used to calculate the temperature effects and it only takes account into the volume dependence of phonon frequencies of lattice vibrations. However, in real materials the phonon frequencies depend largely on temperature, especially in the highly anharmonic solids or at the temperature close to melting. This is because that the QHA omits part of anharmonicity and is only accurate when temperature below Debye temperature.[46] In order to overcome these difficulties of QHA, several anharmonic free energy calculation techniques have been developed, such as the thermodynamic integration technique[78] and the self-consistent ab initio lattice dynamics (SCAILD) method.[910]

Molecular dynamics (MD) simulations include anharmonicity to any order beyond Debye temperature,[1112] especially applicable to high-temperature free energy calculations. Thus it can correct the free energy of the QHA considerably in the free energy calculations. In this paper, we apply the MD simulations to extract anharmonic free energy of Al and then construct more accurate EOS beyond the QHA.

The rest of the paper is organized as follows. In Sec. 2, we describe the details about the computation method. We illustrate the results in detail and make deep discussions in Sec. 3. The conclusions are presented in Sec. 4.

2 Computational Method
2.1 Quasi-Harmonic Approximation

The free energy of Al was first calculated by the quasi-harmonic approximation and then corrected by taking into account the phonon-phonon interactions. The quasi-harmonic approximation (QHA) describes volume-dependent thermal effects based on lattice vibration models known as phonon, neglecting the phonon-phonon interactions. In the framework of the QHA, the Helmholtz free energy of a crystal system is,

where is the zero-temperature energy of a static lattice with volume V. The term is the zero-point motion energy written as,

where is the 0 K phonon density of states (PDOS) of the frequency ω.The term in Eq. (1) is the lattice vibrational free energy, and is calculated from,

2.2 Anharmonicity Corrections

In the harmonic approximation, the PDOS is calculated from the force constants using either the direct method[1314] or the density functional perturbation theory.[5,15] In the harmonic approximation, the phonon-phonon interaction contribution to free energy are neglected, resulting in large errors of thermodynamic properties at high temperature. Therefore, the phonons interactions must be fully taken into account to include the rest of the anharmonic effects. However, the rest anharmonic free energy calculation is very challenging. As we know that the explicit anharmonicity are naturally implied in molecular dynamics (MD) simulations. We can take into account the rest anharmonic effects from MD simulations. The PDOS at T, , can be extracted from the Fourier transform of autocorrelation of atomic position function in a constant temperature MD simulation.[16]

According to the Wiener–Khintchine theorem,[1718] the autocorrelation of position function is given by

The PDOS at T is,

where is the time derivative of the position and is the velocity autocorrelation in the MD simulation.

The Helmholtz free energy of a crystal system is then rewritten as,

where is the total energy of a static lattice withvolume V.

In Eq. (6), the term is the zero-point motion energy of the lattice written as,

The term in Eq. (6) is calculated from,

After obtaining the finite number of temperature dependent PDOS (TD-PDOS) data, we use a much strait-forward and simple method named the direct free energy interpolation (DFEI) method, to construct full anharmonic effects at any temperature.

The DFEI method extracts anharmonic free energy at any temperature based on the limited several TD-PDOS data from MD simulations. The free energies can be directly deduced from the TD-PDOS data at the specific temperatures Ts with the temperature interval 50 K, according to Eq. (6). The free energies at any temperatures were obtained by interpolating these resulting free energy data using the numerical analysis technique of the basis spline (B-spline). Finally, the anharmonic effects of other thermodynamic properties were corrected.

2.3 The Interatomic Potential of Al

We perform classical MD simulations to simulate Al at different pressure and temperature. Then, we gather the trajectories of all the atoms in crystal to calculate phonon density of states. The embedded-atom-method (EAM)[1920] potential developed by Mishin et al.[2122] was used to describe the interatomic interactions of Al atoms. For a metal system containing N atoms, the total potential energy is the sum of the embedding energy F and a pair potential ϕ,

where is the distance between the atoms i and j. The function is the energy to embed the atom i into the background electron density , which is the superposition of the atomic densities,

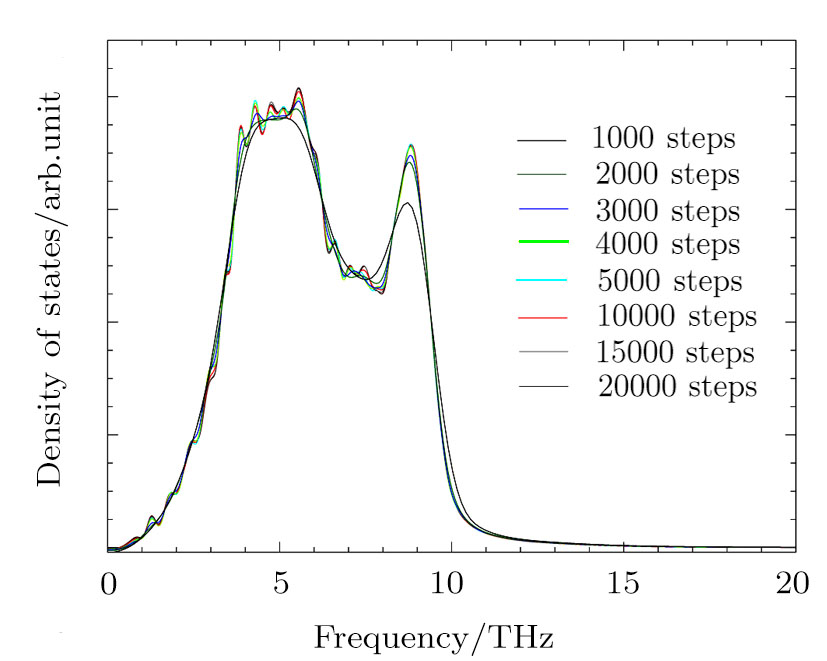
The MD simulations were conducted with the large-scale atomic/molecular massively parallel simulator (LAMMPS)[2324] package. The simulation box constructed from the multiplication 14×14×14 of the face-centered-cubic (fcc) conventional unit cell including 10976 atoms. The simulations were conducted for all the supercells with different volumes in the canonical ensemble (NVT). The periodic boundary condition was used for all the atoms in the simulation box. The time step was 1 fs and the total number of time steps were 10000. From Fig. 1, we see that 10000 MD steps are able to converge the PDOS well.

Fig. 1 (Color online) The PDOS obtained using different numbers of MD steps.
3 Results and Discussions
3.1 High-Temperature Phonon Dispersion and DOS

The phonon dispersion curve of Al were calculated using the direct method from molecular dynamics simulations.[25] The calculated phonon dispersion curve of Al are compared well with experimental data at 298 K[26] in Fig. 2(a). The frequency of lattice vibration decreases with temperature until very small negative frequencies occur at 900 K as shown in the circle of Fig. 2(a). Such very small negative frequencies often result from the numerical noises in the direct phonon calculation method with molecular dynamics simulations.[26] The good agreement of the calculated phonon dispersion curve with experimental data show the validity of the EAM potential for Al. The TD-PDOSs of Al with atomic volume Å are obtained by Fourier transform of autocorrelation of atomic position function and plotted in Fig. 2(b). The PDOSs are from 0 to 900 K with the interval of 100 K. The density of states of higher frequencies increase with temperature, attributed to the increasing collective excitations of higher frequencies from the phonon-phonon interactions. On the contrary, the lower frequencies of vibrations are inhibited with increasing temperature. The 900 K PDOS does not show any negative frequency and thus does not affect the free energy calculation.

Fig. 2 (a) The comparison of the calculated 0 GPa phonon dispersion curves of Al with experimental data at 298 K.[26] The circle indicates the negative frequencies at point. (b) The phonon DOS of Al at atomic volume of 16.61 Å from 0 to 900 K with the interval of 100 K along the arrow direction.

The volumes of supercells used for PDOS calculations had volumes varying from 1.08 to 0.64 with the interval of 0.1 , where is the equilibrium volume at ambient pressure. The simulation temperature for each volume ranged from 0 K to 950 K with the interval of 50 K. The volume range and interval made a good sample for the description of the equation of states of Al (Fig. 3(a)) compared with the experimental data,[27] indicating that the anharmonic free energy interpolation based on the PDOS with the temperature interval of 50 K is sufficient.

Fig. 3 (a) The comparison of the calculated isothermal compression curve with experimental data.[27] (b) The calculated thermal expansion coefficients of Al compared with experimental data.[31]
3.2 Thermal Expansion Coefficients

We calculate the Helmholtz free energy from the PDOS according to Eq. (1). The third-order Birch–Murnaghan equation of states[28] was fitted to the calculated free energy FV data at each temperature. The third-order Birch–Murnaghan equation of states is given by,

where , and , , and Bʹ are fitting parameters. The thermodynamic properties and the anharmonic effects are automatically analyzed using the our PhaseGO package.[2930]

The accuracy of the calculated thermal properties was checked by the thermal expansion coefficient defined by,

The calculated thermal expansion coefficients as a function of temperature are shown in Fig. 3(b). The QHA results are in good agreement with experimental data[31] below 400 K, while when the temperature is above 400 K the zero-pressure thermal expansion coefficient gradually deviates from experiment. This attributes to the neglect of anharmonicity caused by phonon-phonon interactions. This deviation is also observed in the calculations for other transition metals, such as Ta,[32] Pt,[33] and Pd.[34] However, the DFEI results show good agreement with the experimental data[31] in Fig. 3(b).

3.3 Heat Capacity

The specific heat at constant volume was calculated by

where F is the Helmholtz free energy calculated from Eq. (6). The thermal expansion caused by anharmonic effects results in a difference between and . The difference between the two can be written as

where is the volume thermal expansion coefficient and is the bulk modulus. Because the heat capacities are obtained from a second derivative of the Helmholtz free energy, they are more sensitive to the tiny errors in the Helmholtz free energy.

Figure 4 shows and as a function of temperature at 0 GPa. The calculated accords reasonably well with experimental data[35] below 600 K, and first increases dramatically as pressure increases and then finally approaches to 3R. The DFEI and QHA results are very similar. The calculated is also in good comparison with experimental data.[35] The better agreement with experimental data is also found after anharmonic correction (DFEI), especially when T is beyond 800 K.

Fig. 4 The specific heat of Al at constant volume and at constant pressure compared with the experimental data.[35]
3.4 Grüneisen Parameter and Bulk Modulus

The thermodynamic Grüneisen parameter was achieved by

where is isothermal bulk modulus. The isothermal bulk modulus was calculated from

The calculated isothermal bulk modulus versus temperature curves at different pressures are shown in Fig. 5(a). The isothermal bulk modulus curve at 0 GPa is very good agreement with the experimental data.[36] The calculated thermodynamic Grüneisen parameter is compared with the ab initio data from Ref. [37] in Fig. 5(b). The calculated thermodynamic Grüneisen parameter is also in very good agreement with the reference data from Ref. [38].

Fig. 5 (a) The calculated isothermal bulk modulus of Al at different pressures, in comparison with zero-pressure data[36] (open circles). (b) The calculated thermodynamic Grüneisen parameter compared with ab initio data from Ref. [37].
4 Conclusion

In conclusion, we calculate and correct the thermodynamic properties of Al using the direct calculation method of full free energy of lattice vibrations, i.e., the DFEI method which makes accurate anharmonic corrections for the thermodynamic properties of materials beyond the QHA. The calculated thermal expansion coefficients of Al using DFEI method agree better with experiment than the QHA results. Furthermore, the calculated isotherms, the constant volume and constant pressure heat capacities, the bulk moduli using DFEI are all in good agreement with experimental data. This indicates that the DFEI method is indeed an efficient and accurate method to determining the thermodynamic properties of materials from the high temperature phonon density of states.

Reference
[1] Pickard C. J. Needs R. J. Nat. Mater. 9 2010 624
[2] Martin R. Nature (London) 400 1999 117
[3] Boettger J. C. Trickey S. B. Phys. Rev. B 53 1996 3007
[4] Hansen U. Vogl P. Fiorentini V. Phys. Rev. B 60 1999 5055
[5] Baroni S. Gironcoli S. D. Corso A. D. Giannozzi P. Rev. Mod. Phys. 73 2001 515
[6] Baroni S. Giannozzi P. Isaev E. Rev. Miner. Geochem. 71 2010 39
[7] Alfè D. Price G. D. Gillan M. J. Phys. Rev. B 64 2001 45123
[8] Alfè D. Price G. D. Gillan M. J. Phys. Rev. B 65 2002 165118
[9] Souvatzis P. Eriksson O. Katsnelson M. I. Rudin S. P. Phys. Rev. Lett. 100 2008 95901
[10] Souvatzis P. Eriksson O. Katsnelson M. I. Rudin S. P. Comput. Mater. Sci. 44 2009 888
[11] Errea I. Calandra M. Mauri F. Phys. Rev. B 89 2014 64302
[12] Car R. Parrinello M. Phys. Rev. Lett. 55 1985 2471
[13] Alfè D. Comput. Phys. Commun. 180 2009 2622
[14] Togo A. Oba F. Tanaka I. Phys. Rev. B 78 2008 134106
[15] Gonze X. Phys. Rev. B 55 1997 10337
[16] Thomas M. Brehm M. Fligg R. et al. Phys. Chem. Chem. Phys. 15 2013 6608
[17] Wiener N. Acta Math. 55 1930 117
[18] Khintchine A. Math. Ann. 109 1934 604
[19] Daw M. S. Baskes M. I. Phys. Rev. B 29 1984 6443
[20] Foiles S. M. Baskes M. I. Daw M. S. Phys. Rev. B 33 1986 7983
[21] Winey J. M. Kubota A. Gupta Y. M. Modell. Simul. Mater. Sci. Eng. 17 2009 55004
[22] Winey J. M. Kubota A. Gupta Y. M. Modell. Simul. Mater. Sci. Eng. 18 2010 29801
[23] Plimpton S. J. J. Comput. Phys. 117 1995 1
[24] http://lammps.sandia.gov
[25] Kong L. T. Comput. Phys. Commun. 182 2011 2201
[26] Stedman R. Nilsson G. Phys. Rev. 145 1966 492
[27] Hnstrm A. Lazor P. J. Alloy Compd. 305 2000 209
[28] Birch F. Phys. Rev. 71 1947 809
[29] Liu Z. L. Comput. Phys. Commun. 191 2015 150
[30] Liu Z. L. Comput. Phys. Commun. 197 2015 341
[31] Nix F. C. MacNair D. Phys. Rev. 60 1941 597
[32] Liu Z. L. Cai L. C. Chen X. R. et al. J. Phys.: Condens. Matter 21 2009 95408
[33] Sun T. Umemoto K. Wu Z. Zheng J. C. Wentzcovitch R. M. Phys. Rev. B 78 2008 24304
[34] Liu Z. L. Yang J. H. Cai L. C. Jing F. Q. Alfè D. Phys. Rev. B 83 2011 144113
[35] Forsblom M. Sandberg N. Grimvall G. Phys. Rev. B 69 2004 165106
[36] Dewaele A. Loubeyre P. Mezouar M. Phys. Rev. B 70 2004 94112
[37] Nie J. L. Ao L. Zhao F. A. Jiang M. Zu X. T. Can. J. Phys. 93 2015 55004
[38] Holzapfel W. B. Hartwig M. Sievers W. J. Phys. Chem. Ref. Data 30 2001 515