文章信息
- 钟宇, 田芳, 周姝, 邹明宇, 张立波, 刘文源
- ZHONG Yu, TIAN Fang, ZHOU Shu, ZOU Mingyu, ZHANG Libo, LIU Wenyuan
- PI-RADS v2.1联合前列腺特异性抗原相关参数诊断临床显著性前列腺癌的预测模型及内部验证
- Prediction model and internal validation of PI-RADS v2.1 combined with PSA-related parameters in the diagnosis of clinically significant prostate cancer
- 中国医科大学学报, 2022, 51(12): 1090-1094, 1101
- Journal of China Medical University, 2022, 51(12): 1090-1094, 1101
-
文章历史
- 收稿日期:2022-03-21
- 网络出版时间:2022-12-08 12:18:17
前列腺癌是男性常见的恶性肿瘤,发病率及死亡率逐年攀升。2020年全球癌症数据[1]报告,前列腺癌发病率为全球癌症第四位和男性癌症第二位,死亡率为男性癌症第五位。目前,磁共振成像(magnetic resonance imaging,MRI)在前列腺癌的诊断、治疗和复发评估中发挥着核心作用[2]。2019年,前列腺影像报告和数据系统(prostate imaging reporting and data system,PI-RADS)更新至PI-RADS v2.1[3]。美国国立综合癌症网络(National Comprehensive Cancer Network,NCCN)指南[4]建议对前列腺特异性抗原(prostate-specific antigen,PSA)升高的前列腺癌早期检测首先行多参数MRI(multi-parametric MRI,mp-MRI),以减少过度检测和治疗的风险。mp-MRI包括T2加权成像(T2 weighted imaging,T2WI)、扩散加权成像(diffusion weighted imaging,DWI)和动态对比增强成像(dynamic contrast enhanced imaging,DCE)。mp-MRI可增加临床显著性前列腺癌(clinically significant prostate cancer,csPCa)的检出率,同时指南指出前列腺mp-MRI中出现阴性结果并不排除癌症的可能性。PSA是前列腺癌最重要的筛查标志物,但诊断特异性不高,特别是总PSA(total PSA,tPSA)4~10 ng/mL时,与前列腺增生、前列腺炎、急性尿潴留、尿路感染等疾病引起的PSA升高存在交叉重叠[5]。本研究旨在建立PI-RADS v2.1联合PSA相关参数的logistic回归预测模型,探讨其诊断效能并进行内部验证,旨在提高临床诊断准确率,进而减少不必要的穿刺活检。
1 材料与方法 1.1 临床资料及分组收集2016年1月至2021年4月北部战区总医院放射诊断科就诊的活检前接受前列腺磁共振检查且tPSA > 4 ng/mL患者的临床资料。纳入标准:(1)通过前列腺穿刺活检或根治性切除术获得病理结果确诊。(2)磁共振影像及PSA相关数据完整。排除标准:磁共振检查前进行过穿刺活检或手术、前列腺增生治疗、放疗、药物或激素治疗。共纳入150例,将Gleason评分≥7分的患者作为csPCa组(n = 71),Gleason评分 < 7分及良性疾病(前列腺增生、前列腺炎)患者作为非csPCa组(n = 79)。从2组中按7∶3比例随机分配至建模组和验证组。建模组105例(csPCa组50例、非csPCa组55例),验证组45例(csPCa组21例、非csPCa组24例)。移行带107例,外周带43例。本研究中,tPSA 4~≤10 ng/mL 34例,其中csPCa组5例,非csPCa组29例,tPSA > 10 ng/mL 116例,其中csPCa组66例,非csPCa组50例。本研究已获得医院伦理委员会批准。
1.2 影像学检查方法磁共振检查采用3.0T西门子Verio扫描装置,序列包括T2WI、T1WI、DWI和DCE。T1WI:TR 680 ms,TE 16 ms;T2WI:TR 3 000 ms,TE 89 ms,FOV 200 mm×200 mm,层厚4 mm。DWI:采用EPI单次激发序列(TR 4 500 ms,TE 93 ms,FOV 250 mm×210 mm,层厚4 mm,b值(50、1 000 s/mm2)。DCE:采用快速梯度序列,高压注射器经肘静脉以0.1 mmoL/kg、2.5 mL/s给予钆喷酸葡胺,TR 3.3 ms,TE 1.6 ms,FOV 200 mm×200 mm,层厚4 mm,扫描时间约5 min。
1.3 PSA相关参数获取抽取静脉血,获得tPSA及游离PSA(free PSA,fPSA),计算fPSA/tPSA比值(f/t PSA)。读取MRI测量腺体的横径、前后径及纵径,前列腺体积(prostate volume,PV)=横径×前后径×纵径×0.52,PSA密度(PSA density,PSAD)=tPSA/PV。
1.4 图像分析由2位具有5年以上前列腺磁共振阅片经验的主治医师以PI-RADS v2.1[3]为诊断标准共同阅读图像,意见不统一时经协商达成一致。根据csPCa存在的可能性给出总体评估类别:PI-RADS 1,极低;PI-RADS 2,低;PI-RADS 3,中等;PI-RADS 4,高;PI-RADS 5,极高。
1.5 统计学分析采用SPSS 23.0软件进行统计学分析。建模组采用独立样本t检验比较csPCa组与非csPCa组PI-RADS v2.1、tPSA、t/fPSA、PSAD指标差异,将有统计学差异(P < 0.05)指标作为自变量,建立PI-RADS v2.1与PSA相关参数的logistic回归预测模型:(1)PI-RADS v2.1+tPSA;(2)PI-RADS v2.1+t/fPSA;(3)PI-RADS v2.1+PSAD。验证组采用独立样本t检验比较csPCa组与非csPCa组间PI-RADS v2.1、tPSA、t/fPSA、PSAD指标差异,绘制PSA相关参数诊断csPCa受试者操作特征(receiver operating characteristic,ROC)曲线,比较曲线下面积。将验证组数据代入logistic回归方程,产生预测概率(P):P = 1/{1+exp(-logit P)};绘制P及PI-RADS v2.1诊断csPCa的ROC曲线,比较曲线下面积,计算约登指数确定临界值,比较灵敏度、特异度、准确度、阴性预测值及阳性预测值。P < 0.05为差异有统计学意义。
2 结果 2.1 建模组患者基线特征比较及模型建立结果显示,csPCa组与非csPCa组PI-RADS v2.1、tPSA、t/fPSA、PSAD比较差异均有统计学意义(均P < 0.05),见表 1。
| Item | Non-csPCA group | csPCA group | t | P |
| tPSA | 12.97±6.45 | 53.79±38.98 | -7.314 | < 0.001 |
| f/tPSA | 0.19±0.06 | 0.10±0.05 | 8.881 | < 0.001 |
| PSAD | 0.13±0.04 | 1.06±1.06 | -6.260 | < 0.001 |
| PI-RADS v2.1 | 2.58±0.69 | 4.12±1.00 | -9.288 | < 0.001 |
将有统计学差异(P < 0.05)指标作为自变量,建立PI-RADS v2.1与PSA相关参数联合的logistic回归预测模型:(1)Logit P = -7.313+1.62PI-RADS v2.1+0.088tPSA(χ2=81.933,P < 0.05);(2)Logit P = -0.453+1.833PI-RADS v2.1-39.811f/tPSA(χ2=95.803,P < 0.05);(3)Logit P = -12.031+1.917PI-RADS v2.1+29.206PSAD(χ2=108.144,P < 0.05)。
模型(1)(χ2=34.759,P = 0.689)、(2)(χ2=7.255,P = 0.509)、(3)(χ2=3.868,P = 0.795)的霍斯默-莱梅肖拟合优度检验结果均为P > 0.05,表明预测模型与观察数据拟合度状况良好。
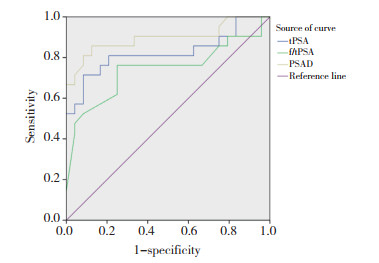
2.2 模型内部验证结果显示,验证组中csPCa组与非csPCa组间tPSA、f/tPSA、PSAD、PI-RADS v2.1指标比较差异均有统计学意义(t分别为-4.513、3.421、-5.203、-6.595,均P < 0.05)。绘制PSA相关参数诊断csPCa的ROC曲线,tPSA、f/tPSA、PSAD曲线下面积分别为0.823,0.741,0.897。见图 1。

|
| 图 1 PSA相关参数诊断csPCa的ROC曲线 Fig.1 ROC curve of three PSA-related parameters in the diagnosis of csPCa |
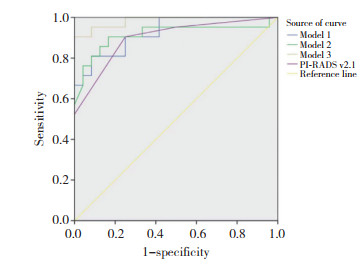
将验证组数据代入预测模型获得预测概率(P),各P值与PI-RADS v2.1共同建立ROC曲线,见图 2。模型(1)、(2)、(3)及PI-RADS v2.1诊断csPCa的曲线下面积分别为0.927、0.915、0.984和0.899,Z检验进行两两比较结果显示,模型(1)、(2)与PI-RADS v2.1诊断csPCa的差异无统计学意义(均P > 0.05);模型(3)与PI-RADS v2.1诊断csPCa的差异有统计学意义(P < 0.05)。

|
| 图 2 3种回归预测模型和PI-RADS v2.1诊断csPCa的ROC曲线 Fig.2 ROC curve of three regression prediction models and PI-RADS v2.1 in the diagnosis of csPCa |
计算约登指数,取其最大值所对应模型(1)、(2)、(3)的预测概率临界值分别为0.535、0.245、0.373,PI-RADS v2.1以3.5分为临界值(1~3分为良性,4~5分为恶性),计算3种模型和PI-RADS v2.1诊断的灵敏度、特异度、准确度、阴性预测值及阳性预测值。结果显示,模型(3)各指标均较PI-RADS v2.1提高,见表 2。前列腺炎、良性前列腺增生及csPCa的典型MRI表现见图 3~5。
| Item | Sensitivity(%) | Specificity(%) | Accuracy(%) | Youden index | NPV(%) | PPV(%) |
| Model 1 | 81.0 | 91.7 | 86.7 | 0.727 | 84.6 | 89.5 |
| Model 2 | 90.5 | 83.3 | 86.7 | 0.738 | 90.9 | 82.6 |
| Model 3 | 95.2 | 91.7 | 93.3 | 0.869 | 95.7 | 90.9 |
| PI-RADS v2.1 | 90.5 | 75.0 | 82.2 | 0.655 | 90.0 | 76.0 |
| NPV,negative predictive value;PPV,positive predictive value. | ||||||

|
| A, B, T2WI transaxial and coronal views show a moderately low signal in the right peripheral zone with clear borders; C, DWI shows a significantly high signal; D, DCE shows focal, early enhancement, corresponding to the findings of T2WI and DWI. 图 3 前列腺炎患者(69岁,tPSA 10.2 ng/mL,f/tPSA 0.34,PSAD 0.09)MRI表现 Fig.3 MRI performance in a patient with prostatitis (69 years old, tPSA 10.2 ng/mL, f/tPSA 0.34, PSAD 0.09 ng/mL·cm-3) |

|
| A, T2WI showing a low-signal nodule (atypical nodule) with well-defined borders in the right metastatic zone; B, C, DWI shows significantly high signal and ADC shows significantly low signal; D, DCE shows mild inhomogeneous enhancement. 图 4 良性前列腺增生患者(61岁,tPSA 10.8 ng/mL,f/tPSA 0.11,PSAD 0.13)MRI表现 Fig.4 MRI presentation of a patient with benign prostatic hyperplasia (61 years old, tPSA 10.8 ng/mL, f/tPSA 0.11, PSAD 0.13 ng/mL·cm-3) |

|
| A, T2WI shows diffuse inhomogeneous reduction of signal in the migrating zone; B, C, DWI shows a significantly high signal and ADC shows a low signal; D, DCE shows early enhancement, corresponding to the findings of T2WI and DWI. 图 5 csPCa患者(69岁,tPSA 9.98 ng/mL,f/tPSA 0.16,PSAD 0.19)的MRI表现 Fig.5 MRI presentation of a patient with csPCa (69 years old, tPSA 9.98 ng/mL, f/tPSA 0.16, PSAD 0.19 ng/mL·cm-3) |
3 讨论
PI-RADS评分对csPCa诊断效能较高[6-8],本研究中PI-RADS v2.1诊断csPCa的灵敏度为90.5%,特异度为75.0%,与以往报道基本一致。PI-RADS v2.1提出非典型结节,澄清DWI评分2、3分的标准,新增中央带及前纤维肌肉基质带评分标准,良性病变的界限更加清楚,增加了诊断特异度。外周带DCE检出前列腺癌的价值有限,仅当DWI评分为3分时,阳性DCE会使总评分“升级”为4分。阳性DCE由于前列腺癌产生血管源性因子,随着肿瘤体积增大,新生血管增多、渗透性增高,增强扫描早期快速强化,但发生于外周带的小部分前列腺炎及肉芽肿等也呈相似的强化表现,影响PI-RADS v2.1评分[9]。移行带T2WI为主要序列,DWI为次要序列。前列腺增生表现为腺体型和间质型,腺体型常表现为长T2信号,清楚、完全的边界或被膜(典型结节);间质型常表现为短T2信号,大部分或无被膜(非典型结节),间质型为主结节相对腺体型含有更多的细胞,组织稠密,细胞外水分较少,DWI也难以对移行带间质型增生结节与前列腺癌进行准确鉴别,增加不确定性的结果[10]。
PSA普遍应用于前列腺癌筛查中,常用的相关参数包括tPSA、fPSA、f/tPSA、PSAD等。tPSA是最常用的肿瘤标志物,但良恶性疾病存在重叠区间。fPSA主要由正常前列腺细胞产生,前列腺癌时tPSA显著升高而fPSA相对降低,即f/tPSA与前列腺癌的发生呈负相关。已有研究[11]表明f/tPSA以0.16为标准时,灵敏度为71.64%,特异度为67.57%。PSAD综合了tPSA与PV指标,可校正因增生导致体积增大而引起的tPSA升高。我国泌尿外科疾病诊断治疗指南[12]表明f/tPSA及PSAD对tPSA 4~10 ng/mL的前列腺穿刺具有指导意义。本研究csPCa组中tPSA 4~10 ng/mL 5例(7.0%),若仅参考f/tPSA、PSAD,则漏诊1例csPCa,结合PI-RADS v2.1评分则全部建议穿刺活检。
本研究将影像学与非影像学方法结合,建立了PI-RADS v2.1与PSA相关参数联合诊断的logistic回归预测模型:(1)Logit P = -7.313+1.62PI-RADS v2.1+0.088tPSA;(2)Logit P = -0.453+1.833PI-RADS v2.1-39.811f/tPSA;(3)Logit P = -12.031+1.917PI-RADS v2.1+29.206PSAD。霍斯默-莱梅肖拟合优度检验表明3种模型与观察数据拟合度良好;模型(3)诊断效能优于单独PI-RADS v2.1。说明PI-RADS v2.1联合PSAD诊断较单一PI-RADS v2.1诊断csPCa的灵敏度、特异度均有不同程度提升。最近研究[13]认为,PSAD正常值为0.12 ng/mL·cm-3,数值越高恶性可能性越大,尤其在PSA灰区(4~10 ng/mL)时有很大参考价值。可见,PI-RADS v2.1结合PSA相关参数可以弥补单一诊断的不足,尤其当PI-RADS 3分影像无法进一步诊断时,可减少非前列腺癌患者过度穿刺活检。
综上所述,PI-RADS v2.1与PSAD联合诊断csPCa的预测模型较单独PI-RADS v2.1诊断效能明显提高。本研究的不足之处:(1)随机抽样中可能存在选择偏倚,样本量相对有限,发生于移行带或外周带的比例也会影响良恶性鉴别诊断的评价;(2)穿刺活检与根治性前列腺切除术获得的病理结果可能存在一定偏差;(3)只针对主要病灶进行分析,不能涵盖所有病灶对PSA相关参数的影响。今后会扩大样本量,同时结合人工智能对数据进行更为精准、全面分析。
| [1] |
SUNG H, FERLAY J, SIEGEL RL, et al. Global cancer statistics 2020:globocan estimates of incidence and mortality worldwide for 36 cancers in 185 countries[J]. CA Cancer J Clin, 2021, 71(3): 209-249. DOI:10.3322/caac.21660 |
| [2] |
刘南, 杨斌, 徐骏, 等. 通过2019年欧洲泌尿外科学会年会解读前列腺癌诊疗进展[J]. 中华泌尿外科杂志, 2019(4): 241-246. DOI:10.3760/cma.j.issn.1000-6702.2019.04.001 |
| [3] |
TURKBEY B, ROSENKRANTZ AB, HAIDER MA, et al. Prostate imaging reporting and data system version 2.1:2019 update of prostate imaging reporting and data system version 2[J]. Eur Urol, 2019, 76(3): 340-351. DOI:10.1016/j.eururo.2019.02.033 |
| [4] |
MASON BR, EASTHAM JA, DAVIS BJ, et al. Current status of MRI and PET in the NCCN guidelines for prostate cancer[J]. J Natl Compr Canc Netw, 2019, 17(5): 506-513. DOI:10.6004/jnccn.2019.7306 |
| [5] |
BARUAH SK, DAS N, BARUAH SJ, et al. Combining prostate-specific antigen parameters with prostate imaging reporting and data system score version 2.0, to improve diagnostic accuracy[J]. World J Oncol, 2019, 10(6): 218-225. DOI:10.14740/wjon1230 |
| [6] |
WOO S, S UH, C H, K IM, S Y, et al. Diagnostic performance of prostate imaging reporting and data system version 2 for detection of prostate cancer: a systematic review and diagnostic meta-analysis[J]. Eur Urol, 2017, 72(2): 177-188. DOI:10.1016/j.eururo.2017.01.042 |
| [7] |
方志伟, 许克新, 胡浩, 等. 第2版前列腺影像报告及数据系统评分在前列腺癌诊断中的价值[J]. 中华泌尿外科杂志, 2018, 39(1): 19-23. DOI:10.3760/cma.j.issn.1000-6702.2018.01.005 |
| [8] |
檀双秀, 张跃跃, 王姗, 等. 第2版和第2.1版前列腺影像报告与数据系统对临床显著性前列腺癌诊断效能的比较分析[J]. 中华放射学杂志, 2021, 55(2): 160-165. DOI:10.3760/cma.j.cn112149-20200212-00144 |
| [9] |
MA DJ, LU F, ZOU XX, et al. Intravoxel incoherent motion diffusion-weighted imaging as an adjunct to dynamic contrast-enhanced MRI to improve the accuracy of the differential diagnosis of benign and malignant breast lesions[J]. Magn Reson Imaging, 2017, 36: 175-179. DOI:10.1016/j.mri.2016.10.005 |
| [10] |
张琨, 张晓晶, 钟燕, 等. 超高b值扩散加权成像诊断前列腺中央腺体癌的价值[J]. 中华放射学杂志, 2016, 50(5): 357-361. DOI:10.3760/cma.j.issn.1005-1201.2016.05.009 |
| [11] |
王炜, 李传刚, 刘辉, 等. 前列腺特异性抗原对前列腺癌诊断价值的探讨[J]. 中国医科大学学报, 2016, 45(1): 61-65, 69. DOI:10.12007/j.issn.0258-4646.2016.01.014 |
| [12] |
那彦群, 叶章群, 孙颖浩. 中国泌尿外科疾病诊断治疗指南手册: 2014版[M]. 北京: 人民卫生出版社, 2014.
|
| [13] |
TEOH JY, YUEN SK, TSU JH, et al. The performance characteristics of prostate-specific antigen and prostate-specific antigen density in Chinese men[J]. Asian J Androl, 2017, 19(1): 113-116. DOI:10.4103/1008-682x.167103 |
 2022, Vol. 51


