文章信息
- 孙英伟, 刘学勇, 邓纯博, 张展, 马驯
- SUN Yingwei, LIU Xueyong, DENG Chunbo, ZHANG Zhan, MA Xun
- 骨小梁纹理参数对膝骨关节炎进展的预测效能
- The predictive efficacy of trabecular bone texture parameters for knee osteoarthritis progression
- 中国医科大学学报, 2021, 50(8): 704-708
- Journal of China Medical University, 2021, 50(8): 704-708
-
文章历史
- 收稿日期:2021-05-16
- 网络出版时间:2021-07-27 15:31
2. 中国医科大学附属盛京医院放射科, 沈阳 110004;
3. 中国医科大学附属盛京医院康复科, 沈阳 110134;
4. 沈阳医学院附属中心医院运动创伤科, 沈阳 110024;
5. 中国医科大学附属盛京医院脊柱外科, 沈阳 110004
2. Department of Radiology, Shengjing Hospital of China Medical University, Shenyang 110004, China;
3. Department of Rehabilitation, Shengjing Hospital of China Medical University, Shenyang 110134, China;
4. Department of Orthopedics, Central Hospital of Shenyang Medical College, Shenyang 110024, China;
5. Department of Orthopedics, Shengjing Hospital of China Medical University, Shenyang 110004, China
骨关节炎(osteoarthritis,OA)是最常见的慢性骨骼肌肉系统疾病之一,随着人口老龄化的加速,OA发病率逐年增高,给社会和个人带来了巨大的负担[1]。OA的发病机制尚不清楚,其病理改变不可逆转。重要的是,目前尚无可以治愈该病或预防该病进展的方法。目前的药物仅对缓解疼痛等症状有效,但药物可能引起严重的不良事件甚至死亡[2]。X线是诊断膝OA的主要影像学方法。OA的放射学分级包括国际骨关节炎研究学会(Osteoarthritis Research Society International,OARSI)分级和Kellgren-Lawrence(KL)分级。X线缺乏敏感性,不能反映局部软骨损伤情况。KL分级和OARSI分级受主观因素影响,对OA早期分级的准确率不高。多项研究表明,KL分级组内系数在0.5~0.7。并且传统放射学检查难以早期诊断OA,OA的诊断主要发生在该病的中至重度(晚期)阶段[3]。
随着对OA发病机制的深入研究,软骨下骨的重塑与OA进展之间的密切关系被证实[4]。纹理分析是指将图像划分为感兴趣的区域,并对这些区域的特征进行分类,纹理分析具有识别疾病早期细微变化的潜能。应用纹理分析方法分析影像图像来诊断疾病,已成为人工智能领域研究的热点。软骨下骨纹理分析能够评估膝关节软骨下骨小梁和股骨颈的结构[5]。HIRVASNIEMI等[6]对不同分级的膝OA患者的骨小梁纹理进行定量分析,发现不同程度膝OA的骨小梁纹理不同。膝关节放射学纹理分析有望成为一种早期预测、诊断OA的方法。本研究通过自行研发的纹理分析软件,采用局部二值模式(local binary pattern,LBP)与灰度共生矩阵(gray level co-occurrence matrix,GLCM)相结合的纹理特征分析方法,提取、筛选基线软骨下骨小梁的纹理参数,评估纹理参数预测OA进展的能力,以期发现一种能够早期预测膝OA进展的放射学纹理参数。
1 材料与方法 1.1 研究对象和分组研究对象的相关临床信息和影像学资料来自OA公共数据库Osteoarthritis initiative(OAI,https://nda.nih.gov/oai/)。研究对象的个人信息分别来自登记临床数据集Enrollees_SAS.zip 25,基线期临床数据集AllClinical00_ 0.2.3,随访36个月后的数据集AllClinical_05_SAS.zip5.2.1。研究对象的X线资料和KL分级分别来自数据集kXR_SQ_BU00_SAS.zip 0.8和kXR_SQ_BU05_SAS.zip 5.7。
将研究对象分为放射学进展组和对照组。放射学进展组纳入标准:基线双侧膝关节KL分级均为0级,随访36个月后右膝关节KL≥2级。放射学进展组排除标准:(1)图像质量不佳,影响图像分析结果;(2)随访结束后KL分级 < 2级。对照组纳入标准:双侧膝关节KL分级均为0级,随访结束后右膝关节KL分级仍为0级。对照组排除标准:(1)图片质量不佳,影响图像分析结果;(2)随访36个月后,膝关节KL分级≥1级。
收集研究对象的相关临床信息,包括年龄、性别、老年人体力活动量表(the physical activity scale for the elderly,PASE)总评分以及体质量指数(body mass index,BMI)。OAI数据库中的所有研究均获伦理委员会批准(批号:10-00532),本研究所有研究对象均签署知情同意书[7]。
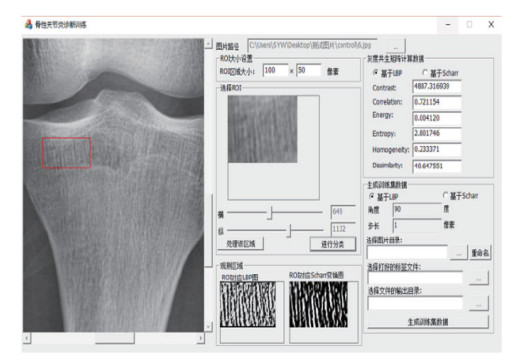
1.2 X线检查方法和图像纹理提取研究对象在基线和随访期内每年拍摄双侧膝关节站立后前位X线,管电压65~72 kV,焦片距72 cm。数据库中提供的KL分级为一名骨科、一名放射科医师和两名风湿病学家对膝关节进行的分级,出现分歧时协商解决,最后达成一致意见[8]。本研究选取研究对象膝关节X线片内侧胫骨平台中1/3软骨下骨小梁作为感兴趣区(region of interest,ROI),应用C++软件编制的程序,分别计算不同构造因子组合(图像灰度统一设置为256,移动步长取1、2、3、4、5,移动方向取0°、45°、90°、135°)时,膝关节X线ROI的6个纹理特征参数,包括能量(energy)、熵(entropy)、同质性(homogeneity)、对比度(contrast)、相关性(correlation)、异质性(dissimilarity),见图 1。本研究中纹理参数的表示方法为角度-步长-纹理特征参数,如当移动方向为0°、步长为1时骨小梁的对比度表示为0° 1 contrast。

|
| 图 1 骨纹理特征参数提取过程图 Fig.1 Diagram of the extraction process of the trabecular bone texture parameters |
1.3 统计学分析
应用SPSS 22.0软件和Empower Stats软件进行统计分析。因不同纹理参数取值范围不同,为了使纹理参数1个单位的变化在各纹理参数中具有可比性,将所有纹理参数转化为Z值。符合正态分布的计量资料采用独立样本t检验进行比较,非正态分布的计量资料采用Mann-Whitney U检验进行比较,分类变量采用χ2检验进行比较。应用logistic回归分析基线期骨纹理参数与OA进展的关系。应用受试者操作特征(receiver operating characteristic,ROC)曲线的曲线下面积(area under the curve,AUC)评价各纹理参数的诊断效能。同时计算参数的诊断比值比(diagnostic odd ratio,DOR),DOR是病例组阳性比值与对照组阳性比值的比,是评价诊断效能的综合指标。P < 0.05为差异有统计学意义。
2 结果 2.1 研究对象的临床特征分析按照纳入标准对OAI数据库进行筛选,34例研究对象纳入放射学进展组,30例研究对象纳入对照组。2组比较,年龄、BMI、PASE评分、性别均无统计学差异(P > 0.05),见表 1。
| Clinical characteristics | Progress group(n = 34) | Control group(n = 30) | P |
| Body mass index(kg/m2) | 27.64±3.47 | 27.40±3.47 | 0.63 |
| Age(year) | 63.50±8.32 | 62.00±8.41 | 0.47 |
| PASE score | 190.82±69.42 | 159.77±61.90 | 0.06 |
| Male [n(%)] | 20(58.82) | 17(56.67) | 0.83 |
2.2 膝关节X线纹理特征
2组比较,部分不同角度和步长的纹理参数有统计学差异(P < 0.05)。二元回归分析结果显示,部分纹理参数与OA进展有相关性。见表 2。
| Texture parameter | Control group(n = 30) | Progress group(n = 34) | OR(95% CI) | P |
| 0° 3 energy | -0.36±0.65 | 0.32±1.15 | 2.01(1.02-3.95) | 0.042 2 |
| 0° 3 homogeneity | -0.36±0.76 | 0.32±1.08 | 1.98(1.05-3.75) | 0.035 7 |
| 0° 5 correlation | -0.36±0.67 | 0.32±1.14 | 2.11(1.06-4.17) | 0.032 4 |
| 0° 5 homogeneity | -0.35±0.63 | 0.31±1.16 | 2.10(1.05-4.18) | 0.034 9 |
| 45° 1 correlation | 0.37±0.81 | -0.33±1.04 | 0.47(0.25-0.90) | 0.023 1 |
| 45° 1 dissimilarity | -0.40±0.81 | 0.35±1.03 | 2.34(1.21-4.53) | 0.011 8 |
| 45° 4 correlation | -0.37±0.72 | 0.33±1.10 | 2.17(1.07-4.40) | 0.031 0 |
| 45° 4 homogeneity | -0.36±0.64 | 0.32±1.15 | 2.05(1.03-4.10) | 0.042 4 |
| 45° 5 contrast | -0.41±0.78 | 0.36±1.04 | 2.26(1.20-4.29) | 0.012 2 |
| 45° 5 dissimilarity | -0.41±0.78 | 0.37±1.04 | 2.31(1.20-4.43) | 0.012 2 |
| 90° 1 homogeneity | 0.34±0.91 | -0.30±0.99 | 0.48(0.26-0.89) | 0.020 8 |
| 90° 2 correlation | -0.32±0.76 | 0.29±1.11 | 1.82(1.01-3.27) | 0.045 2 |
| 135° 1 homogeneity | 0.37±1.05 | -0.33±0.84 | 0.46(0.25-0.86) | 0.015 4 |
| 135° 3 contrast | -0.36±0.69 | 0.32±1.13 | 2.02(1.06-3.87) | 0.033 1 |
| 135° 3 dissimilarity | -0.35±0.70 | 0.31±1.13 | 1.93(1.01-3.67) | 0.045 9 |
| 135° 4 contrast | -0.41±0.77 | 0.36±1.05 | 2.32(1.17-4.63) | 0.017 4 |
| 135° 4 dissimilarity | -0.41±0.75 | 0.36±1.07 | 2.34(1.16-4.72) | 0.017 4 |
| Adjusted for sex,age,body mass index,and PASE score. | ||||
2.3 ROC曲线分析
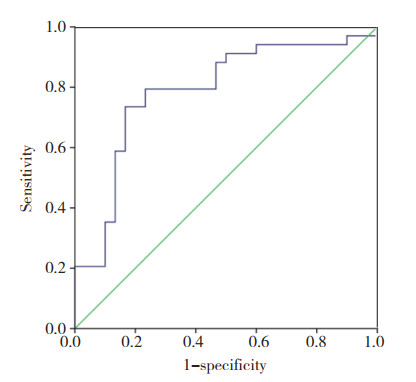
将筛选的纹理参数联合临床协变量(年龄、性别、BMI、PASE评分)进行ROC曲线分析,结果显示联合协变量的各纹理参数的AUC为0.69~0.79,诊断比值比为5.75~15.60。当角度为45°、步长为1时异质性的AUC值最大,为0.79。见表 3、图 2。
| Texture parameter | Area under the curve | Best cut-off | Specificity | Sensitivity | Accuracy | Diagnostic odd ratio |
| 0° 3 energy | 0.73 | -0.05 | 0.77 | 0.71 | 0.73 | 7.89 |
| 0° 3 homogeneity | 0.73 | -0.21 | 0.67 | 0.79 | 0.73 | 7.71 |
| 0° 5 correlation | 0.73 | -0.06 | 0.73 | 0.74 | 0.73 | 7.64 |
| 0° 5 homogeneity | 0.72 | 0.14 | 0.83 | 0.65 | 0.73 | 9.17 |
| 45° 1 correlation | 0.76 | 0.07 | 0.80 | 0.71 | 0.75 | 9.60 |
| 45° 1 dissimilarity | 0.79 | 0.08 | 0.83 | 0.74 | 0.78 | 13.89 |
| 45° 4 correlation | 0.75 | 0.12 | 0.87 | 0.71 | 0.78 | 15.60 |
| 45° 4 homogeneity | 0.75 | 0.08 | 0.83 | 0.71 | 0.77 | 12.00 |
| 45° 5 contrast | 0.77 | 0.24 | 0.83 | 0.65 | 0.73 | 9.17 |
| 45° 5 dissimilarity | 0.76 | 0.21 | 0.80 | 0.65 | 0.72 | 7.33 |
| 90° 1 homogeneity | 0.75 | -0.29 | 0.67 | 0.82 | 0.75 | 9.33 |
| 90° 2 correlation | 0.72 | 0.20 | 0.83 | 0.68 | 0.75 | 10.45 |
| 135° 1 homogeneity | 0.76 | -0.14 | 0.70 | 0.82 | 0.77 | 10.89 |
| 135° 3 contrast | 0.75 | -0.10 | 0.73 | 0.79 | 0.77 | 10.61 |
| 135° 3 dissimilarity | 0.74 | -0.01 | 0.73 | 0.76 | 0.75 | 8.94 |
| 135° 4 contrast | 0.69 | 0.20 | 0.73 | 0.68 | 0.70 | 5.75 |
| 135° 4 dissimilarity | 0.70 | 0.31 | 0.80 | 0.62 | 0.70 | 6.46 |

|
| 图 2 45° 1异质性对OA的预测价值 Fig.2 The predictive value of heterogeneity with an angle of 45° and a step size of 1 on osteoarthritis |
3 讨论
本研究先将ROI原始图像转化成LBP图像,此时每个像素点的值不再是灰度值,而是图像局部微观模式的LBP值,再应用GLCM对LBP图像进行分析,计算具有某种位置关系的局部微观模式出现的频率。使用LBP创建的共生矩阵,运算速度得到了较大提升,不仅在一定程度上反映了更细节的纹理特征,而且强化了原始图像的纹理特征。结果表明,将LBP和GLCM两种算法结合后进行放射学纹理分析,对膝OA发生具有较高的预测能力。
越来越多的研究[9]发现,软骨下骨小梁的结构变化在OA的发生、发展的进程中发挥重要作用,可能是OA的始发因素。在膝关节X线图像中,软骨下骨小梁的纹理变化与OA严重程度密切相关[10-11]。HIRVASNIEMI等[12]发现,在有无关节软骨损伤或骨髓损伤的不同受试者之间,膝关节胫骨内侧软骨下骨小梁纹理存在明显差异。同时,早期的研究[13]证实,软骨下骨小梁的粗糙度、各向异性的方向和角度的变化能够预测膝关节间隙的变化。本研究通过计算膝关节X线软骨下骨小梁纹理参数,并应用AUC评价预测随访3年发生OA的效能,应用DOR比较不同参数下的诊断价值。本研究结果显示,预测OA发生的最大AUC为0.79,DOR为13.89,与上述研究结果相近。
早期的分形分析研究[14]发现,OA早期纵向骨小梁发生改变,应以水平方向观察骨小梁纹理结构。JANIVER等[15]进一步分析认为,在OA早期,水平方向、大间距下分形分析的预测能力最强。早期研究[6]应用GLCM进行纹理分析时,在90°、步长为1时进行参数计数。与上述研究不同,本研究发现在角度为45°、步长为1时具有最佳的预测能力。尽管不同研究筛选出不同的参数,但纹理的预测能力主要与ROI的选择以及适合的算法有关[16]。
综上所述,本研究表明,软骨下骨小梁具有早期放射学诊断OA和预测OA进展的能力。在接下来的研究中,应深度筛选临床变量,优化算法筛选骨纹理参数,提高预测的效能,并扩大研究样本量进行验证。膝关节骨纹理参数有望成为一种新的可行的生物标志物,用于预测OA的发生和识别高危人群。
致谢:感谢Osteoarthritis Initiative(OAI)数据库的所有研究人员、工作人员和受试者。
| [1] |
YAHAYA I, WRIGHT T, BABATUNDE OO, et al. Prevalence of osteoarthritis in lower middle- and low-income countries: a systematic review and meta-analysis[J]. Rheumatol Int, 2021, 41(7): 1221-1231. DOI:10.1007/s00296-021-04838-y |
| [2] |
SOLOMON DH, RASSEN JA, GLYNN RJ, et al. The comparative safety of analgesics in older adults with arthritis[J]. Arch Intern Med, 2010, 170(22): 1968-1976. DOI:10.1001/archinternmed.2010.391 |
| [3] |
SOWERS M, KARVONEN-GUTIERREZ CA, JACOBSON JA, et al. Associations of anatomical measures from MRI with radiographically defined knee osteoarthritis score, pain, and physical functioning[J]. J Bone Joint Surg Am, 2011, 93(3): 241-251. DOI:10.2106/jbjs.i.00667 |
| [4] |
NEOGI T, FELSON DT. Osteoarthritis: bone as an imaging biomarker and treatment target in OA[J]. Nat Rev Rheumatol, 2016, 12(9): 503-504. DOI:10.1038/nrrheum.2016.113 |
| [5] |
HARRISON LCV, NIKANDER R, SIKIÖ M, et al. MRI texture analysis of femoral neck: detection of exercise load-associated differences in trabecular bone[J]. J Magn Reson Imaging, 2011, 34(6): 1359-1366. DOI:10.1002/jmri.22751 |
| [6] |
HIRVASNIEMI J, THEVENOT J, IMMONEN V, et al. Quantification of differences in bone texture from plain radiographs in knees with and without osteoarthritis[J]. Osteoarthritis Cartilage, 2014, 22(10): 1724-1731. DOI:10.1016/j.joca.2014.06.021 |
| [7] |
KAWAHARA T, SASHO T, OHNISHI T, et al. Stage-specific meniscal features predict progression of osteoarthritis of the knee: a retrospective cohort study using data from the osteoarthritis initiative[J]. BMC Musculoskelet Disord, 2019, 20(1): 33. DOI:10.1186/s12891-019-2413-7 |
| [8] |
FELSON DT, NIU J, GUERMAZI A, et al. Defining radiographic incidence and progression of knee osteoarthritis: suggested modifications of the Kellgren and Lawrence scale[J]. Ann Rheum Dis, 2011, 70(11): 1884-1886. DOI:10.1136/ard.2011.155119 |
| [9] |
CASTAÑEDA S, ROMAN-BLAS JA, LARGO R, et al. Subchondral bone as a key target for osteoarthritis treatment[J]. Biochem Pharmacol, 2012, 83(3): 315-323. DOI:10.1016/j.bcp.2011.09.018 |
| [10] |
KRAUS VB, COLLINS JE, CHARLES HC, et al. Predictive validity of radiographic trabecular bone texture in knee osteoarthritis: the osteoarthritis research society international/foundation for the national institutes of health osteoarthritis biomarkers consortium[J]. Arthritis Rheumatol, 2018, 70(1): 80-87. DOI:10.1002/art.40348 |
| [11] |
WOLSKI M, PODSIADLO P, STACHOWIAK GW, et al. Differences in trabecular bone texture between knees with and without radiographic osteoarthritis detected by directional fractal signature method[J]. Osteoarthritis Cartilage, 2010, 18(5): 682-690. DOI:10.1016/j.joca.2010.01.002 |
| [12] |
HIRVASNIEMI J, THEVENOT J, GUERMAZI A, et al. Differences in tibial subchondral bone structure evaluated using plain radiographs between knees with and without cartilage damage or bone marrow lesions-the Oulu Knee Osteoarthritis study[J]. Eur Radiol, 2017, 27(11): 4874-4882. DOI:10.1007/s00330-017-4826-8 |
| [13] |
WOLOSZYNSKI T, PODSIADLO P, STACHOWIAK GW, et al. Prediction of progression of radiographic knee osteoarthritis using tibial trabecular bone texture[J]. Arthritis Rheum, 2012, 64(3): 688-695. DOI:10.1002/art.33410 |
| [14] |
PODSIADLO P, NEVITT MC, WOLSKI M, et al. Baseline trabecular bone and its relation to incident radiographic knee osteoarthritis and increase in joint space narrowing score: directional fractal signature analysis in the MOST study[J]. Osteoarthritis Cartilage, 2016, 24(10): 1736-1744. DOI:10.1016/j.joca.2016.05.003 |
| [15] |
JANVIER T, JENNANE R, TOUMI H, et al. Subchondral tibial bone texture predicts the incidence of radiographic knee osteoarthritis: data from the Osteoarthritis Initiative[J]. Osteoarthritis Cartilage, 2017, 25(12): 2047-2054. DOI:10.1016/j.joca.2017.09.004 |
| [16] |
BAYRAMOGLU N, TIULPIN A, HIRVASNIEMI J, et al. Adaptive segmentation of knee radiographs for selecting the optimal ROI in texture analysis[J]. Osteoarthritis Cartilage, 2020, 28(7): 941-952. DOI:10.1016/j.joca.2020.03.006 |
 2021, Vol. 50


