文章信息
- 彭荣荣, 刘芸男, 杨冬燕, 王含柔, 赵明烽, 杨小丽
- PENG Rongrong, LIU Yunnan, YANG Dongyan, WANG Hanrou, ZHAO Mingfeng, YANG Xiaoli
- 基于时间序列分析的悬浮红细胞临床需求预测模型研究
- Examination of the clinical demand prediction model of suspended red blood cells using a time series analysis
- 中国医科大学学报, 2020, 49(6): 532-536
- Journal of China Medical University, 2020, 49(6): 532-536
-
文章历史
- 收稿日期:2019-01-08
- 网络出版时间:2020-05-18 14:26
2. 重庆市血液中心, 重庆 400015
2. Chongqing Blood Center, Chongqing 400015, China
近年来,随着地市级医疗机构服务能力的提高,医院规模不断扩大,患者更多选择到中心血站覆盖的地市级医疗机构接受治疗,使地市级医疗机构血液用量迅速增长,中心血站血液供需矛盾突出,区域性、季节性和结构性缺血常常发生[1]。目前,重庆市对临床血液需求预测主要依据相关人员既往经验粗略估算,存在较多局限,本研究拟采用差分整合移动平均自回归(autoregrescive integrated moving average,ARIMA)模型建立临床血液需求预测模型,以实现血液资源的科学采集和储备。
1 材料与方法 1.1 数据来源及处理获取2006年至2016年重庆市万州中心血站每月向医院提供的悬浮红细胞ABO各血型用量以及悬浮红细胞总用量的数据;运用Excel软件建立数据库,按月统计悬浮红细胞ABO各血型用量以及总用量;然后运用SPSS 19.0软件进行统计分析。临床用量以单位(U)计算,1 U悬浮红细胞由200 mL全血分离制备。
1.2 ARIMA模型建立ARIMA模型建立的基本步骤:(1)时间序列分析及平稳处理。对于存在趋势性和季节周期性的序列分别进行差分和季节差分处理使其平稳。(2)模型识别与参数估计。观察经过差分后平稳序列的自相关函数(autocorrelation function,ACF)图和偏自相关函数(partial autocorrelation function,PACF)图,确定模型的阶数;然后对模型进行参数估计与假设检验,根据t检验结果中的P值进行判定,若P > 0.05则检验未通过,则需重新选定模型;最后依据贝叶斯信息准则(Bayesian information criterion,BIC)确定最佳模型。(3)模型检验。对模型的残差序列进行白噪声检验,可通过观察残差序列ACF和PACF是否落在95%可信区间(confidence intervals,CI)内或根据Ljung-Box Q检验结果中的P值判定。(4)模型预测。运用最优模型预测2016年7月至12月每月悬浮红细胞临床用量,计算95%CI及相对误差,并与同期悬浮红细胞临床实际用量比较,验证模型的拟合效果。
2 结果 2.1 悬浮红细胞用量时间序列分析及平稳处理以A型悬浮红细胞为例,绘制2006年1月至2016年6月每月用量原始序列图(图 1A),可见2006年至2012年用量逐年上升,2013年至2016年上升趋势逐渐变缓。同时该序列还存在明显的季节周期性,以12个月为1个周期,每年1、2月用量较低,8、9月用量较高。上升趋势及季节周期性表明该序列呈现不平稳的特征,为了消除原序列趋势性和季节周期性的影响,对其进行差分和季节差分处理,处理后序列中每个值都围绕在固定值附近波动,为平稳序列,见图 1B。因B型、O型、AB型和总量原始序列也呈现相同特征,故进行了类似处理。

|
| A,original sequence diagram of type A;B,the sequence diagram of type A after difference and seasonal difference. 图 1 A型原始序列图和差分、季节差分后的序列图 Fig.1 Original sequence diagram of type A and the sequence diagram after the difference and seasonal differences |
2.2 悬浮红细胞模型识别与参数估计
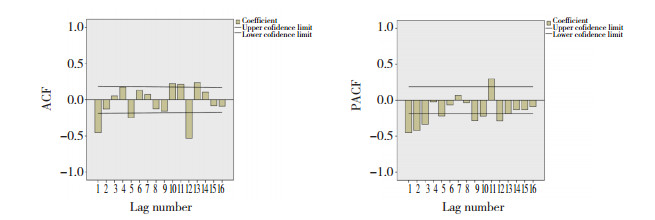
悬浮红细胞A型血用量的原始序列存在季节周期性,故选用季节乘积模型ARIMA (p,d,q) (P,D,Q) s。A型血原始序列以12个月为1个周期,故s=12;且对其进行了一阶差分和一阶季节差分,因此d=1、D=1。绘制A型经过一阶差分和一阶季节差分的ACF和PACF图(图 2)。根据图 2,初步判断PACF呈3阶截尾特征,p=3;ACF拖尾或截尾特征不明显,q=0。同时,ACF和PACF在滞后12阶均显著不等于0,故Q=1、P = 1。综上可知,A型识别模型为ARIMA (3,1,0) (1,1,1) 12。

|
| 图 2 A型差分、季节差分后的ACF和PACF图 Fig.2 Autocorrelation function and partial autocorrelation function diagram of type A after the difference and seasonal differences |
A型识别模型的参数估计与假设检验见表 1。A型识别模型ARIMA (3,1,0) (1,1,1) 12的参数显著性检验未通过(P > 0.05) [2],故需重新选定模型。A型ACF在滞后1、5、10、11、12、13阶显著不为0,考虑q取1、5、10、11、12、13;PACF在滞后1~3、5、9、10、11、12阶显著不为0,故考虑p取3、5、9、10、11、12;为了将模型考虑得更加全面,尝试p和q取0的情况。相关学者认为P、D、Q三者取值一般不大于2[3-4],即取0、1或2,并考虑p、q、P、D、Q取不同值的各种模型。将残差不是白噪声(Ljung-Box Q检验,P < 0.05)和参数显著性检验未通过的模型除去,再根据贝叶斯判定准则[5],最终选定A型的最优模型为ARIMA (0,1,1) (0,1,1) 12。
| Parameter | ARIMA(3,1,0) (1,1,1)12 | ARIMA(0,1,1) (0,1,1)12 | |||||
| β | t | P | β | t | P | ||
| AR (1) | -0.798 | -8.630 | < 0.001 | - | - | - | |
| AR (2) | -0.547 | -4.941 | < 0.001 | - | - | - | |
| AR (3) | -0.317 | -3.379 | 0.001 | - | - | - | |
| MA (1) | - | - | - | 0.918 | 18.796 | < 0.001 | |
| SAR (1) | 0.008 | 0.059 | 0.953 | - | - | - | |
| SMA (1) | 0.926 | 2.571 | 0.012 | 0.937 | 3.016 | 0.003 | |
与悬浮红细胞A型识别过程类似,B型、O型、AB型和总用量的最优模型分别为ARIMA (0,1,1) (1,0,0) 12、ARIMA (0,1,1) (0,1,1) 12、ARIMA (0,1,1) (0,1,1) 12和ARIMA (3,1,0) (0,1,1) 12。各最优模型的参数估计与假设检验见表 2。
| Parameter | B ARIMA(0,1,1) (1,0,0)12 |
O ARIMA(0,1,1) (0,1,1)12 |
AB ARIMA(0,1,1) (0,1,1)12 |
Total ARIMA(3,1,0) (0,1,1)12 |
|||||||||||
| β | t | P | β | t | P | β | t | P | β | t | P | ||||
| AR (1) | - | - | - | - | - | - | - | - | - | -0.825 | -8.693 | < 0.001 | |||
| AR (2) | - | - | - | - | - | - | - | - | - | -0.643 | -5.983 | < 0.001 | |||
| AR (3) | - | - | - | - | - | - | - | - | - | -0.219 | -2.290 | 0.024 | |||
| MA (1) | 0.832 | 16.094 | < 0.001 | 0.902 | 18.174 | < 0.001 | 0.903 | 18.100 | < 0.001 | - | - | - | |||
| SAR (1) | 0.365 | 4.049 | < 0.001 | - | - | - | - | - | - | - | - | - | |||
| SMA (1) | - | - | - | 0.760 | 7.412 | < 0.001 | 0.931 | 3.424 | 0.001 | -0.714 | 7.663 | < 0.001 | |||
2.3 模型检验
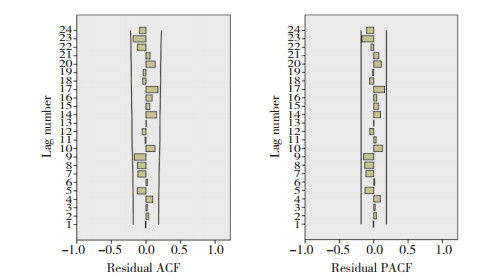
对悬浮红细胞ABO各血型用量以及总用量的最优模型进行白噪声检验。以A型为例(图 3),A型残差序列ACF和PACF均落在95%CI内;且模型残差序列Ljung-Box Q检验结果显示无统计学意义(统计量为21.736,P > 0.05),说明残差序列呈白噪声过程,残差为随机性误差,适用于临床悬浮红细胞需求量的预测。B型、O型、AB型和总用量的模型检验过程类似,结果显示均通过白噪声检验。

|
| 图 3 A型模型残差序列ACF图和PACF图 Fig.3 Autocorrelation function and partial autocorrelation function diagram of the residual sequence of the type A model |
2.4 模型预测(表 3)
| Models | July | August | September | October | November | December |
| Type A | ||||||
| Actual values (U) | 1 796.5 | 1 663.5 | 1 985.0 | 1 913.0 | 1 838.0 | 2 240.5 |
| Predicted values (U) | 1 986.8 | 1 964.2 | 1 904.3 | 1 851.6 | 1 798.9 | 1 862.0 |
| 95% UCL (U) | 2 239.5 | 2 217.8 | 2 158.6 | 2 106.8 | 2 054.9 | 2 118.9 |
| 95% LCL (U) | 1 734.1 | 1 710.7 | 1 649.9 | 1 596.4 | 1 542.9 | 1 605.2 |
| Relative error (%) | 10.6 | 18.1 | 4.1 | 3.2 | 2.1 | 16.9 |
| Type B | ||||||
| Actual values (U) | 1 333.5 | 1 388.0 | 1 424.5 | 1 180.0 | 1 236.5 | 1 312.0 |
| Predicted values (U) | 1 392.0 | 1 316.9 | 1 400.9 | 1 379.3 | 1 357.6 | 1 403.9 |
| 95% UCL (U) | 1 603.9 | 1 531.8 | 1 618.7 | 1 599.9 | 1 581.1 | 1 630.2 |
| 95% LCL (U) | 1 180.2 | 1 102.1 | 1 183.2 | 1 158.6 | 1 134.1 | 1 177.5 |
| Relative error (%) | 4.4 | 5.1 | 1.7 | 16.9 | 9.8 | 7.0 |
| Type O | ||||||
| Actual values (U) | 2 096.5 | 1 848.0 | 2 046.5 | 2 021.5 | 1 902.5 | 2 036.5 |
| Predicted values (U) | 2 031.8 | 2 006.2 | 1 923.5 | 1 913.5 | 1 880.6 | 1 926.4 |
| 95% UCL (U) | 2 289.0 | 2 264.6 | 2 183.1 | 2 174.3 | 2 142.6 | 2 189.6 |
| 95% LCL (U) | 1 774.7 | 1 747.8 | 1 663.8 | 1 652.6 | 1 618.5 | 1 663.2 |
| Relative error (%) | 3.1 | 8.6 | 6.0 | 5.3 | 1.2 | 5.4 |
| Type AB | ||||||
| Actual values (U) | 467.0 | 461.0 | 449.0 | 463.5 | 425.5 | 389.0 |
| Predicted values (U) | 502.0 | 508.1 | 497.1 | 484.3 | 457.6 | 484.1 |
| 95% UCL (U) | 616.0 | 622.6 | 612.1 | 599.8 | 573.7 | 600.7 |
| 95% LCL (U) | 388.1 | 393.6 | 382.0 | 368.7 | 341.6 | 367.5 |
| Relative error (%) | 7.5 | 10.2 | 10.7 | 4.5 | 7.5 | 24.4 |
| Total | ||||||
| Actual values (U) | 5 693.5 | 5 360.5 | 5 905.0 | 5 578.0 | 5 402.5 | 5 978.0 |
| Predicted values (U) | 6 008.4 | 5 954.9 | 5 948.7 | 5 780.5 | 5 529.3 | 5 842.1 |
| 95% UCL (U) | 6 587.2 | 6 542.5 | 6 549.0 | 6 445.2 | 6 236.7 | 6 569.3 |
| 95% LCL (U) | 5 429.6 | 5 367.4 | 5 348.4 | 5 115.7 | 4 821.9 | 5 114.9 |
| Relative error (%) | 5.5 | 11.1 | 0.7 | 3.6 | 2.3 | 2.3 |
| UCL,upper confidence limit;LCL,lower conficlence limit. | ||||||
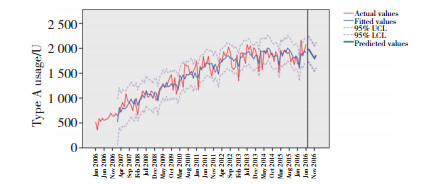
应用各最优模型对2016年7月至12月每月悬浮红细胞A型、B型、O型、AB型用量及总用量进行预测,预测值均在95%CI内,并将预测值与同期实际值进行比较,平均相对误差分别为9.2%、7.5%、4.9%、10.8%、4.3%。以A型为例,模型拟合图中实际值与预测值变化趋势吻合度较高(图 4),B型、O型、AB型和总用量的模型拟合图特征类似。平均相对误差在10%左右,说明模型预测结果精度较高,预测拟合效果好。

|
| 图 4 A型模型拟合效果图 Fig.4 Fitting effect diagram of the type A model |
3 讨论
时间序列是一组按照某种时间间隔(年、月、日、季节等)顺序排列的实测值。时间序列分析是探究这一组数据中所反映出来的发展过程、方向和趋势,进行类推或延伸,并根据这组数据资料对未来情况进行预测[6]。ARIMA模型是时间序列分析中最重要的方法之一,该模型能综合提取时间序列中的趋势信息以及季节周期性信息,预测其未来走势[7],适用于与季节周期性相关的临床悬浮红细胞需求预测。
本研究以重庆市采供血量最大的万州中心血站为研究对象,运用ARIMA季节乘积模型方法对该中心血站2006年1月至2016年6月每月悬浮红细胞ABO各血型用量以及总用量的时间序列数据进行统计分析并建立模型,然后运用最优模型对2016年7月至12月每月悬浮红细胞ABO各血型用量以及总用量进行预测,预测结果显示平均相对误差较小,说明各模型预测精度较高,具有良好的拟合效果,与以往研究结果一致[8-10]。
悬浮红细胞是一种红细胞成分血,它能够提高机体血液运氧能力,改善组织缺氧状态,但保存期限短(< 35 d)。建立悬浮红细胞临床用量ARIMA模型,利于血站科学地制定招募采血计划,提高血液供需间的契合度,避免区域性血液资源短缺现象发生。然而,ARIMA模型是依据历史数据进行统计分析并建立的数学模型,未考虑到其他因素(国家重大政策出台、突发自然灾害事件等)的影响,故ARIMA模型仅适用于短期(以1年较为恰当[11])结果预测。因此,每年应及时补充临床悬浮红细胞用量信息,并根据最新数据重新识别、诊断以选出最优模型,从而提高预测精度以及保证拟合效果,及时准确地为临床用血提供科学依据。
| [1] |
刘嘉馨. 中国输血行业发展报告(2017)[M]. 北京: 社会科学文献出版社, 2017.
|
| [2] |
刘晓迪, 马洁, 修璟威, 等. 乘积季节模型在我国肺结核疫情预测中的应用[J]. 山东大学学报(医学版), 2018, 56(09): 71-76. DOI:10.6040/j.issn.1671-7554.0.2017.1266 |
| [3] |
陈欣, 吴晓敏, 包名家, 等. 佳木斯市2004-2017年流行性腮腺炎流行特征分析及趋势预测[J]. 中华疾病控制杂志, 2019, 23(2): 185-190. DOI:10.16462/j.cnki.zhjbkz.2019.02.013 |
| [4] |
肖良. 基于季节性ARIMA模型的居民消费水平预测[J]. 统计与决策, 2016, 8: 83-86. DOI:10.13546/j.cnki.tjyjc.2016.08.023 |
| [5] |
陈国平, 张进, 史永林, 等. 乘法季节回归求和移动平均模型在安徽省手足口病预测中的应用研究[J]. 中国预防医学杂志, 2017, 18(1): 11-14. DOI:10.16506/j.1009-6639.2017.01.003 |
| [6] |
何晶晶, 明鑫, 刘勋, 等. 重庆市手足口病多种预警模型的建立与评估[J]. 重庆医科大学学报, 2018, 43(07): 969-974. DOI:10.13406/j.cnki.cyxb.001542 |
| [7] |
马晓梅, 徐学琴, 闫国立, 等. 基于ARIMA模型预测梅毒月发病率的价值[J]. 西安交通大学学报(医学版), 2018, 39(1): 131-134. DOI:10.7652/jdyxb201801028 |
| [8] |
温亮, 张秀山, 李承毅, 等. 季节分解法和ARIMA法预测乌鲁木齐市肺结核发病趋势效果分析[J]. 军事医学, 2017, 41(4): 287-290. DOI:10.7644/j.issn.1674-9960.2017.04.009 |
| [9] |
傅伟杰, 谢昀, 曾志笠, 等. 三种模型在江西省流感样病例预测中的应用与比较[J]. 中华疾病控制杂志, 2019, 23(1): 101-105. DOI:10.16462/j.cnki.zhjbkz.2019.01.021 |
| [10] |
牟敬锋, 赵星, 樊静洁, 等. 基于ARIMA模型的深圳市空气质量指数时间序列预测研究[J]. 环境卫生学杂志, 2017, 7(2): 102-107. DOI:10.13421/j.cnki.hjwsxzz.2017.02.004 |
| [11] |
叶柱江, 刘赴平. 时间序列自回归移动平均模型在临床红细胞用量预测中的应用[J]. 中国输血杂志, 2013, 26(2): 131-134. DOI:10.13303/j.cjbt.issn.1004-549x.2013.02.038 |
 2020, Vol. 49


