 2025, Vol. 36
扩展功能
文章信息
- 沙含雨, 郑效瑾, 阿塞提·布开, 甘志强, 鲁新民, 王利, 吕东月, 秦帅, 肖萌, 段然, 杨琳璇, 景怀琦, 王鑫
- SHA Han-yu, ZHENG Xiao-jin, Asaiti BUKAI, GAN Zhi-qiang, LU Xin-min, WANG Li, LYU Dong-yue, QIN Shuai, XIAO Meng, DUAN Ran, YANG Lin-xuan, JING Huai-qi, WANG Xin
- 集中度和圆形分布法计算阿尔金山地区喜马拉雅旱獭鼠疫疫源地动物鼠疫监测的最佳有效时期
- Determination of the optimal period for animal plague surveillance in Marmota himalayana plague foci in the Altun Mountains using concentration and circular distribution methods
- 中国媒介生物学及控制杂志, 2025, 36(2): 232-237
- Chin J Vector Biol & Control, 2025, 36(2): 232-237
- 10.11853/j.issn.1003.8280.2025.02.015
-
文章历史
- 收稿日期: 2024-10-08


2 阿克塞哈萨克族自治县疾病预防控制中心, 甘肃 酒泉 736400;
3 酒泉市疾病预防控制中心, 甘肃 酒泉 735000
2 Akesai Kazak Autonomous County Center for Disease Control and Prevention, Jiuquan, Gansu 736400, China;
3 Jiuquan Center for Disease Control and Prevention, Jiuquan, Gansu 735000, China
鼠疫是一种自然疫源性疾病,在《中华人民共和国传染病防治法》中被列为甲类传染病,被世界卫生组织列为再发感染病(re-emerging infectious disease,RID)[1]。阿克塞哈萨克族自治县(阿克塞县)鼠疫自然疫源地位于甘肃省酒泉市最西端,是甘肃省最偏远的鼠疫自然疫源地,地处青藏高原喜马拉雅旱獭(Marmota himalayana)鼠疫自然疫源地的阿尔金山地带,有“中国鼠疫菌库”之称。1988年,该县被卫生部确定为“鼠疫全国重点监测点”,目前全县共判定鼠疫疫点48个。疫源地面积达4 100 km2,占全县总面积的13.1%,现年均监测面积达2 600 km2[2]。喜马拉雅旱獭为该疫源地的主要宿主动物,分布广泛,种群结构稳定,自然带菌率高,生活在海拔2 700~5 450 m的高山灌丛和高山草甸中,每年9-10月进入冬眠,次年3月底-4月初出蛰[3],自然感染鼠疫耶尔森菌(Yersinia pestis,鼠疫菌)的旱獭机体产生严重的炎症反应,其中脾脏的肿大及组织病理改变特征明显[4-5]。
集中度法在流行病学中用于分析疾病在时间上的分布特征,特别是传染病季节性分布[6-7]、疾病的时间聚集性研究[8-9]。圆形分布法用于角度、昼夜时间等资料的分析,这类数据的特点是具有“周期性”。通过三角函数将具有周期性变化的资料转换成线性数据,一组圆形分布资料如果有集中分布的倾向,这一倾向性可以用平均角表示,其不仅可以分析传染病发病季节性,即集中趋势,亦可准确计算发病高峰时点和高峰期[7, 10]。动物间鼠疫流行具有季节性,呈单峰分布,有研究表明气候的变化对鼠疫流行有滞后效应[11],掌握其流行时期及流行高峰时间,有利于早期和迅速发现疫情,以便及时采取必要的防治措施。
本研究根据阿克塞县鼠疫监测资料,用集中度法和圆形分布法对2020-2024年青藏高原喜马拉雅旱獭鼠疫疫源地阿尔金山地区动物间鼠疫疫情流行特征和季节性进行探讨,以为今后有针对性地开展鼠疫防控工作提供科学依据。
1 材料与方法 1.1 资料来源2020-2024年甘肃省酒泉市阿克塞县鼠疫监测系统。在每年4-10月旱獭出蛰时间内,通过主动监测和被动监测在研究范围内搜集自毙动物,包括牧民发现报告的自毙动物和研究范围内捡获的自毙动物,进行鼠疫菌分离培养。
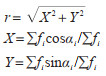
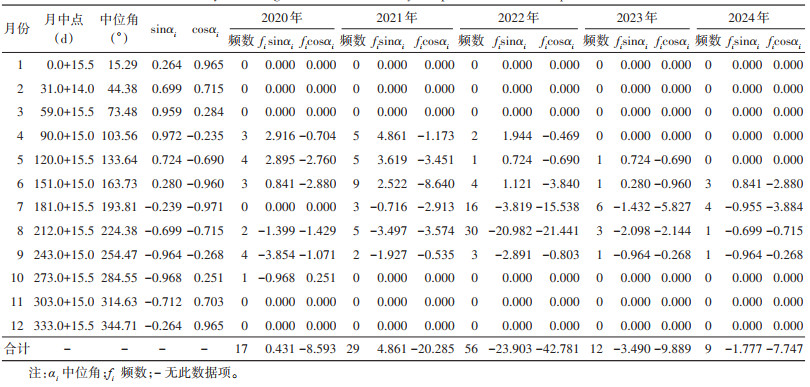
1.2 圆形分布法[12]圆形分布法适用于单峰的圆分布数据,不适用于分析分散的发病数据,使用时可用雷氏检验进行均衡性检验[13]。通过对趋势性、季节性和一定周期规律资料的分析,能够得到较为实际的预测效果。先求出各月的月中点,再将时间天数换算成角度,将1年365 d变换成360°,1 d相当于0.986 3°,1月月中点为15.5 d,则1月中位角为0.986 3×15.5=15.29°,2月月中点为31.0+14.0=45.0 d,则2月中位角为0.986 3×45=44.38°,······,依此类推,即每个月的中位角用αi表示,α1=15.29°、α2=44.38°,······,再通过三角函数代换原理,算出各组中位角的正弦(sinαi)和余弦(cosαi),其值乘以各组的频数fi。
圆形分布的r值表示数据集中的度量,范围为0~1,r=0表示没有一个集中方向,r=1,表示全部数据集中在同一方向,计算公式为[14]:
|
式中,fi表示月发病数,αi表示月中位角度。
α、α ± s转换的日期分别为青藏高原喜马拉雅旱獭鼠疫自然疫源地阿尔金山地区动物鼠疫流行的高峰日和高峰期。检出高峰日为通过角度反推α对应的日期,计算平均角的95%置信区间:α±1.96s,通过角度反推其对应的日期,即检出高峰区间。其中s为角标准差,亦称圆形标准差或平均角离差,简称角离差,是表示圆形分布变异程度的指标,计算公式为:

|
平均角α描述圆形分布资料的集中方向。当X > 0,Y > 0,平均角α在第一象限;当X < 0,Y > 0,平均角α在第二象限;当X < 0,Y < 0,平均角α在第三象限;当X > 0,Y < 0,平均角α在第四象限。计算公式为[14]:

|
当X > 0,α=arctg(Y/X);当X < 0,α=180°+ arctg(Y/X);当X=0,Y > 0,α=90°;当X=0,Y < 0,α=270°;当X=0,Y=0,α不定。
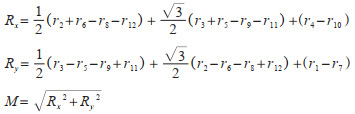
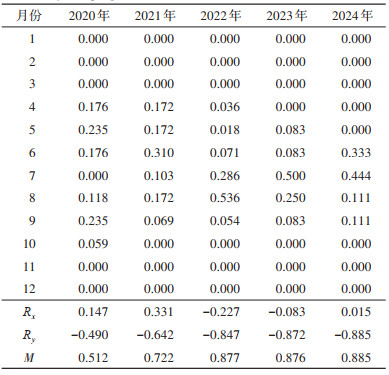
1.3 集中度法[7]向量合成表示法—集中度(M)说明传染病的群体现象在1年中的集中程度,其结果判断不受样本大小的影响,能较真实地反映动物鼠疫的季节性分布。M=1,表示最大极限,说明该疫源地动物鼠疫1年内集中发生在某1月内;M=0,表示最小极限,说明1年内该疫源地动物鼠疫均匀分布在12个月内;M > 0.9,说明该疫源地动物鼠疫有严格的季节性;M=(0.7~0.9],说明有很强的季节性;M=(0.5~0.7],说明有较强的季节性;M=(0.3~0.5],说明有一定的季节性;M≤0.3[15],说明疫源地动物鼠疫的发生在时间分布上比较均匀。按下列公式[7]计算集中度M值。
|
式中,Rx和Ry是根据旱獭鼠疫月阳性样本数计算得到的2个分量,r表示旱獭鼠疫月阳性样本数量与其全年阳性样本总数之比,右下角数字表示月份。
1.4 统计学分析使用Excel 2019软件建立数据库,进行集中度法和圆形分布法分析。
平均角α的检验采用Rayleigh分布检验,均匀性检验根据样本大小n和r值计算检验统计量,Z=nr2,其中n=∑fi。根据雷氏检验Z的临界值表,Z > Z0.05表示平均角存在,P < 0.05为差异有统计学意义,数据分布具有集中趋势,平均角有意义。
多样本角均数的比较,采用Watson-Williams检验[16],查F分布界值表,P < 0.05为差异有统计学意义。
|
式中,K是校正因子,查表可得;N为样本含量总和,k为样本个数,Rj为j样本的R值,Rj=njrj,R为合并值,自由度v1=k-1,v2=N-k。
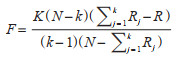
2 结果 2.1 鼠疫流行概况2020-2024年共检测293只自毙旱獭,其中鼠疫菌阳性旱獭123只,鼠疫菌分离率为41.98%,2022年自毙旱獭鼠疫菌分离率最高,为51.85%,2023年最低,为24.00%。见表 1。
|
将2020-2024年发现的喜马拉雅旱獭鼠疫菌阳性旱獭数按时间逐个标绘于圆形的频数分布图上,见图 1。

|
| 图 1 2020-2024年阿尔金山地区检出鼠疫耶尔森菌喜马拉雅旱獭数月分布图 Figure 1 Monthly distribution of Marmota himalayana with Yersinia pestis in the Altun Mountains, 2020-2024 |
| |
根据圆形分布法的原理和计算方法,分别计算各月的月中位角αi和相应的三角函数值,见表 2。
|
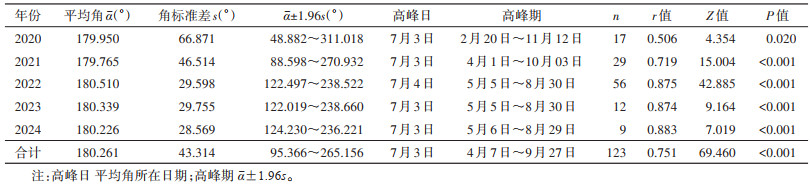
根据表 2数据计算得出,2020年(r=0.506,Z=4.354,P=0.020),2021年(r=0.719,Z=15.004,P < 0.001),2022年(r=0.875,Z=42.885,P < 0.001),2023年(r=0.874,Z=9.164,P < 0.001)和2024年(r=0.883,Z=7.019,P < 0.001),均P < 0.05,显示2020-2024年存在平均角,见表 3。按圆形分布计算的监测最佳有效时期的可信度超过95%乃至99%。对不同年份数据平均角进行Watson-Williams检验,2020-2024年各年的平均角全相等,差异无统计学意义(F=5.908,P > 0.05)。
|
2020-2024年阿尔金山地区喜马拉雅旱獭鼠疫疫源地动物鼠疫的集中度分析M=0.755,其中2020年M=0.512,介于0.5~0.7,显示该疫源地动物鼠疫的分布有较强的季节性;2021-2024年M分别为0.722、0.877、0.876、0.885,均介于0.7~0.9,显示该疫源地动物鼠疫的分布有很强的季节性。见表 4。
|
喜马拉雅旱獭鼠疫自然疫源地是中国已发现的12种鼠疫疫源地类型之一,该疫源地鼠疫染疫动物种类多,菌株毒力较强[17-18],动物间鼠疫活跃[19],人间疫情病情重。21世纪以来,我国甘肃地区人间鼠疫共发生10例(病死率为80%)[20],其中阿克塞地区发生3例(病死率为100%),说明阿克塞的喜马拉雅旱獭鼠疫疫源地一直存在人间鼠疫的威胁[2]。
本文对2020-2024年青藏高原喜马拉雅旱獭鼠疫疫源地阿尔金山地区动物疫情的季节分布进行了分析,应用圆形分布法计算了喜马拉雅旱獭鼠疫流行时期、高峰期和高峰日。其结果比以往常用的构成比或相对比表达方式,能更精确地掌握在流行期间不同时期内的动物流行强度,便于根据不同目的选择最佳有效监测时期。本研究发现,该地区动物鼠疫出现的高峰日为7月3日,动物鼠疫出现的高峰期为4月7日-9月27日,r值表示数据集中的程度,2020-2024年值各年的r值均介于0.5~0.9,其中2022、2023和2024年数据的集中度较高。每年数据的集中度不同,影响所在高峰期(α±1.96s)的离散度,因此r值越接近于1,离散度越小,估测的流行时期相对较短,流行呈明显的锐角式的单峰型,根据数据集中度较高的2022-2024年估测阳性样本出现的高峰期为5月初-8月底。此外,本文2020年数据不服从单峰分布。对于双峰型数据,可采用周期分解法分别计算各个周期内的平均角和角标准差[21]。集中度法发现阿尔金山地区喜马拉雅旱獭鼠疫疫源地动物鼠疫的分布均有较好的时间聚集性,但各年聚集性强度有所不同,其中以2022、2023和2024年季节性较强,此结论与圆形分布法研究结果基本一致。
旱獭每年从9-10月冬眠,直到次年的3-4月初出蛰。在7-9月,随着气温的升高和湿度的增加,旱獭繁殖较为活跃,其体表寄生蚤的活动也更加频繁,这使得鼠疫菌检出率较高,鼠疫菌也更容易传播给人类,例如2014年7月,甘肃省报道1例肺鼠疫病例。值得注意的是,有研究提供了冬眠旱獭携带鼠疫菌的直接证据[22],旱獭冬眠期间鼠疫的防控工作也不能松懈。
本文通过集中度法和圆形分布法了解动物间鼠疫的季节性流行特征,科学预判动物间鼠疫的流行期,能够精准预测重点防控时间,对科学防控鼠疫有重要的理论和实际指导意义。通过比较阿尔金山地区2020-2024年各年鼠疫菌阳性喜马拉雅旱獭的检出时期和本文通过计算95%置信区间估测的喜马拉雅旱獭鼠疫疫源地动物鼠疫分布的的高峰期,证明用圆形分布法计算的该疫源地动物鼠疫分布高峰期是可靠的,按该高峰期选择监测时期,可视为最佳有效监测时期。
利益冲突 无
| [1] |
World Health Organization. Plague around the world, 2010-2015[J]. Wkly Epidemiol Rec, 2016, 91(8): 89-104. |
| [2] |
阿塞提·布开, 鲁新民, 赵晓玲, 等. 1960-2020年喜马拉雅旱獭鼠疫疫源地阿尔金山地区鼠疫监测数据分析[J]. 首都公共卫生, 2023, 17(1): 6-10. Bukai A, Lu XM, Zhao XL, et al. Marmota himalayana plague foci surveillance results in the Altun Mountains, 1960-2020[J]. Cap J Public Health, 2023, 17(1): 6-10. DOI:10.16760/j.cnki.sdggws.2023.01.016 |
| [3] |
蒋可, 熊浩明, 靳海晓, 等. 喜马拉雅旱獭生态学研究进展[J]. 中国媒介生物学及控制杂志, 2024, 35(1): 121-127. Jiang K, Xiong HM, Jin HX, et al. Research progress on ecology of Marmota himalayana[J]. Chin J Vector Biol Control, 2024, 35(1): 121-127. DOI:10.11853/j.issn.1003.8280.2024.01.022 |
| [4] |
张芃, 周永运, 吕东月, 等. 喜马拉雅旱獭自然感染鼠疫耶尔森菌后部分脏器病理变化的研究[J]. 中国媒介生物学及控制杂志, 2023, 34(1): 9-13. Zhang P, Zhou YY, Lyu DY, et al. Pathological changes of some organs of Marmota himalayana naturally infected with Yersinia pestis[J]. Chin J Vector Biol Control, 2023, 34(1): 9-13. DOI:10.11853/j.issn.1003.8280.2023.01.002 |
| [5] |
Lyu DY, Duan Q, Duan R, et al. Symbiosis of a lytic bacteriophage and Yersinia pestis and characteristics of plague in Marmota himalayana[J]. Appl Environ Microbiol, 2024, 90(8): e0099524. DOI:10.1128/aem.00995-24 |
| [6] |
刘伊宁, 张颖, 马飞飞, 等. 2009-2019年中国麻疹流行特征分析[J]. 职业与健康, 2021, 37(17): 2402-2405. Liu YN, Zhang Y, Ma FF, et al. Analysis on epidemiological characteristics of measles in China from 2009-2019[J]. Occup Health, 2021, 37(17): 2402-2405. DOI:10.13329/j.cnki.zyyjk.2021.0582 |
| [7] |
高桂玲, 王超, 姚春霞. 基于集中度和圆形分布法的中国登革热季节性流行特征分析[J]. 热带病与寄生虫学, 2024, 22(4): 208-211. Gao GL, Wang C, Yao CX. Seasonal characteristics of dengue fever in China: Analysis based on concentration and circular distribution approaches[J]. J Trop Dis Parasitol, 2024, 22(4): 208-211. DOI:10.20199/j.issn.1672-2302.2024.04.004 |
| [8] |
郑艳泽, 陈玉格, 张嘉陵, 等. 2010-2022年连云港市恙虫病流行病学特征分析[J]. 公共卫生与预防医学, 2024, 35(3): 95-98. Zheng YZ, Chen YG, Zhang JL, et al. Epidemiological characteristics of scrub typhus in Lianyungang City in 2010-2022[J]. J Public Health Prev Med, 2024, 35(3): 95-98. DOI:10.3969/j.issn.1006-2483.2024.03.022 |
| [9] |
孙建伟, 王大江, 许汴利, 等. 卫生相关事件数据时间聚集性的综合分析与判定[J]. 中国卫生统计, 2017, 34(2): 257-259. Sun JW, Wang DJ, Xu BL, et al. Comprehensive analysis and determination of time aggregation of health-related event data[J]. Chin J Health Stat, 2017, 34(2): 257-259. |
| [10] |
陈永明, 康东梅, 牛艳芬, 等. 动物鼠疫季节性分布的集中度法和圆形分布法分析[J]. 中华卫生杀虫药械, 2021, 27(4): 351-354. Chen YM, Kang DM, Niu YF, et al. Seasonal distribution analysis of animal plague with concentration ratio and circular distribution[J]. Chin J Hyg Insectic Equip, 2021, 27(4): 351-354. DOI:10.19821/j.1671-2781.2021.04.016 |
| [11] |
Duan Q, Zheng XJ, Gan ZQ, et al. Relationship between climate change and marmot plague of Marmota himalayana plague focus- the Altun mountains of the Qinghai-Xizang Plateau, China, 2000-2022[J]. China CDC Wkly, 2024, 6(4): 69-74. DOI:10.46234/ccdcw2024.015 |
| [12] |
朱林旭, 王洪源. 圆形分布统计分析方法的使用现状[J]. 临床医药文献电子杂志, 2018, 5(57): 187-188. Zhu LX, Wang HY. Application status of circular distribution statistical analysis method[J]. J Clin Med, 2018, 5(57): 187-188. DOI:10.16281/j.cnki.jocml.2018.57.104 |
| [13] |
马堃. 圆形分布法在传染病分析中的应用[D]. 沈阳: 中国医科大学, 2013. Ma K. Application of circular distribution method in infectious disease analysis [D]. Shenyang: China Medical University, 2013. (in Chinese) |
| [14] |
阙少聪, 潘宝骏, 游明基. 圆形分布构成比法计算疾病季节高峰月日的探讨[J]. 中国公共卫生, 1994, 10(5): 217-219. Que SC, Pan BJ, You MJ. Discussion on calculating seasonal peak month and day of disease by circular distribution component ratio method[J]. Chin J Public Health, 1994, 10(5): 217-219. |
| [15] |
刘冠纯, 康东梅, 闫东, 等. 应用集中度法探讨鼠疫宿主动物达乌尔黄鼠密度变化规律[J]. 中国媒介生物学及控制杂志, 2021, 32(2): 158-160. Liu GC, Kang DM, Yan D, et al. A study of the density of plague host Spermophilus dauricus by concentration method[J]. Chin J Vector Biol Control, 2021, 32(2): 158-160. DOI:10.11853/j.issn.1003.8280.2021.02.007 |
| [16] |
史珊珊, 周振宇. 2012-2021年浙江省余姚市手足口病季节性特征分析[J]. 疾病监测, 2022, 37(8): 1070-1073. Shi SS, Zhou ZY. Seasonal characteristics of hand foot and mouth disease in Yuyao, Zhejiang, 2012-2021[J]. Dis Surveill, 2022, 37(8): 1070-1073. DOI:10.3784/jbjc.202203170106 |
| [17] |
陈显赫, 王卓, 许卫东. 喜马拉雅旱獭疫源地2008-2017年人间鼠疫流行病分析[J]. 中国地方病防治杂志, 2018, 33(6): 642. Chen XH, Wang Z, Xu WD. Epidemiological analysis of human plague in Marmota himalayana foci from 2008 to 2017[J]. Chin J Ctrl Endem Dis, 2018, 33(6): 642. |
| [18] |
He ZK, Wei BQ, Zhang YJ, et al. Distribution and characteristics of human plague cases and Yersinia pestis isolates from 4 Marmota plague foci, China, 1950-2019[J]. Emerg Infect Dis, 2021, 27(10): 2544-2553. DOI:10.3201/eid2710.202239 |
| [19] |
Ge PF, Xi JX, Ding J, et al. Primary case of human pneumonic plague occurring in a Himalayan marmot natural focus area Gansu Province, China[J]. Int J Infect Dis, 2015, 33: 67-70. DOI:10.1016/j.ijid.2014.12.044 |
| [20] |
汤德铭, 吕东月, 阿塞提·布开, 等. 2000-2020年中国人间鼠疫分布特征分析[J]. 中国校医, 2022, 36(4): 260-264, 282. Tang DM, Lyu DY, Bukai A, et al. Distribution characteristics of human plague in China, 2000-2020[J]. Chin J School Doctor, 2022, 36(4): 260-264, 282. |
| [21] |
李科峰, 仝振东, 李鹏, 等. 舟山市呼吸道传染病季节特征的圆形分布法分析[J]. 预防医学, 2018, 30(10): 1016-1020. Li KF, Tong ZD, Li P, et al. Circular distribution analysis on seasonal characteristics of respiratory infectious diseases in Zhoushan[J]. Prev Med, 2018, 30(10): 1016-1020. DOI:10.19485/j.cnki.issn2096-5087.2018.10.010 |
| [22] |
Tang DM, Duan R, Chen YH, et al. Plague outbreak of a Marmota himalayana family emerging from hibernation[J]. Vector-Borne Zoonotic Dis, 2022, 22(8): 410-418. DOI:10.1089/vbz.2022.0010 |