2. 青岛海洋科学与技术试点国家实验室海洋生态与环境科学功能实验室, 山东 青岛 266237
大气气溶胶磷(P)沉降是表层海水中P营养盐的重要外源补充,在海洋生物的固碳、固氮中起着重要作用[1-3]。但通常认为沉降入海的P只有溶解态P能被海洋生物直接利用,这部分溶解态磷(DP)在总P(TP)中的百分比称为P溶解度,常以此表征气溶胶P的生物可利用性[4]。
大气中P的来源广泛,天然源包括矿物沙尘、生物气溶胶、火山灰和海盐气溶胶等的排放;人为源包括化石燃料和生物质燃烧排放、工业和农业活动等的排放[5]。其中,矿物沙尘源一直被认为是大气气溶胶中TP的主要来源,如Mahowald等[6]报道在全球尺度上气溶胶中TP的82%来自矿物沙尘源的贡献,人为燃烧源的贡献仅为5%。但越来越多的研究发现与燃烧有关的人为源对大气P也有重要贡献,在全球尺度上这一贡献可能超过50%[5]。
沙尘源和人为源气溶胶中P浓度及溶解度存在很大差异。观测研究发现新生成的沙尘气溶胶含有大量的P,但沙尘源P往往以矿物结合体的形式存在而难溶于水[7];人为源P往往与微粒松散地结合在一起,所以更易于溶解[8]。在矿物沙尘中溶解态P的比例很低,只占TP的8%~10%[9],而人为源气溶胶中P溶解度能达到30%~79%[10]。也有研究估计,人为源排放的P中约有50%以溶解态无机P(DIP)或有机P(DOP)形式存在[11]。
人为源P排放往往伴随着大量SO2和NOx等污染物的排放,这些酸组分的存在可能使气溶胶中不溶态P通过酸溶解转化为可溶态P,从而提升P溶解度。Nenes等[12]模拟酸化的研究表明,经酸化处理后大气颗粒物中P溶解度增加了10~40倍。Srinivas等[13]的研究也表明,受到沙尘影响的孟加拉湾气溶胶在经历酸化过程后DP浓度为(1.1±0.3) nmol/m3,而未经历大气酸化过程的则为(0.3±0.1) nmol/m3。与沙尘源气溶胶相比,人为源气溶胶由于粒径较小而具有较大的比表面积[14-15],为气溶胶P的酸化溶解提供更大的反应空间,从而使酸化作用增强、P溶解度进一步提升。但沙尘源和人为源气溶胶P溶解度主要决定于P的初始溶解度,还是传输过程中酸化作用对P溶解度的二次提升尚缺乏定量认识。
青岛位于东亚沙尘源区及华北城市群的下风带,受到沙尘源和人为源的共同影响,本文选择其为研究区域,在西风盛行的冬春季采集样品,重点研究沙尘源和人为源气溶胶中不同形态P浓度和P溶解度的差异及影响因素,定量认识了气溶胶P的一次源和二次源对P溶解度的贡献,为准确评估大气生物可利用性P的沉降通量及其对海洋初级生产力的贡献奠定基础。
1 材料与方法 1.1 样品采集于2012年12月1日至2013年1月31日和2013年3月1日至4月30日采集大气总悬浮颗粒物(TSP)样品112个,采样时间选择在冬、春季,因为冬、春季时盛行西风将亚洲大陆内部污染物带到西北太平洋,使青岛受到沙尘源和人为源的共同影响。采样地点位于中国海洋大学鱼山校区办公楼顶平台(36°06′N, 120°33′E,~65 m asl.),距离黄海海岸线1 km以内。采样器为大流量TSP采样器(KC-1000,青岛崂山电子有限公司),采样膜为经酸洗后的Whatman-41#纤维滤膜,采样流量为1.05 m3/min,每个样品采集约24 h,同时采集过程空白。样品膜和空白膜密封在聚乙烯袋中,-20 ℃冷冻保存。
采用激光光学粒子计数器(OPC,ARTI模型HHPC-6)测量观测期间的粒子数浓度。粒子计数器有6个通道,粒径分别为0.3、0.5、1.0、3.0、5.0和10.0 μm,采样流量为2.83 L·min-1,时间分辨率为15 min。将颗粒物看作为球体,根据其空气动力学直径计算颗粒物的表面积和体积,结合不同粒径颗粒物的数浓度,计算了每个样品采集期间颗粒物的比表面积,即颗粒物总表面积与总体积的比值。
1.2 样品分析对样品中TP、DP和DIP采用磷钼蓝分光光度法进行分析,DOP由DP和DIP差减得到。用于TP分析的样品膜经69%HNO3和40%HF在180 ℃下消解完全后,于160 ℃下赶酸蒸至近干,残渣用超纯水溶解后定容待测。用于溶解态P分析的样品膜用超纯水在0 ℃下超声萃取,萃取液经过0.45 μm滤膜过滤后定容。取25 mL该溶液直接用于DIP分析。取15 mL该溶液加入2.5 mL碱性过硫酸钾氧化剂(0.375 mol/L NaOH, 0.185 mol/L K2S2O8和0.484 mol/L H3BO3混合液)于120 ℃下消解30 min,消解液定容至25 mL用于DP分析。此测定方法检出限为0.07 μmol/L,过程空白值低于检出限。样品重复分析的相对标准差在3%以内。TP消解的回收率为95%~105%,平均为98%(n=10)。
另外,采用ICP-MS(Agilent 7500c)分析样品中Al、Pb等11种微量元素的总态和溶解态浓度。采用离子色谱法(DionexICS-3000)分析NO3-、SO42-等9种水溶性离子浓度。
样品中P组分、微量元素和水溶性离子的详细分析步骤和质量控制见文献[16-17]。
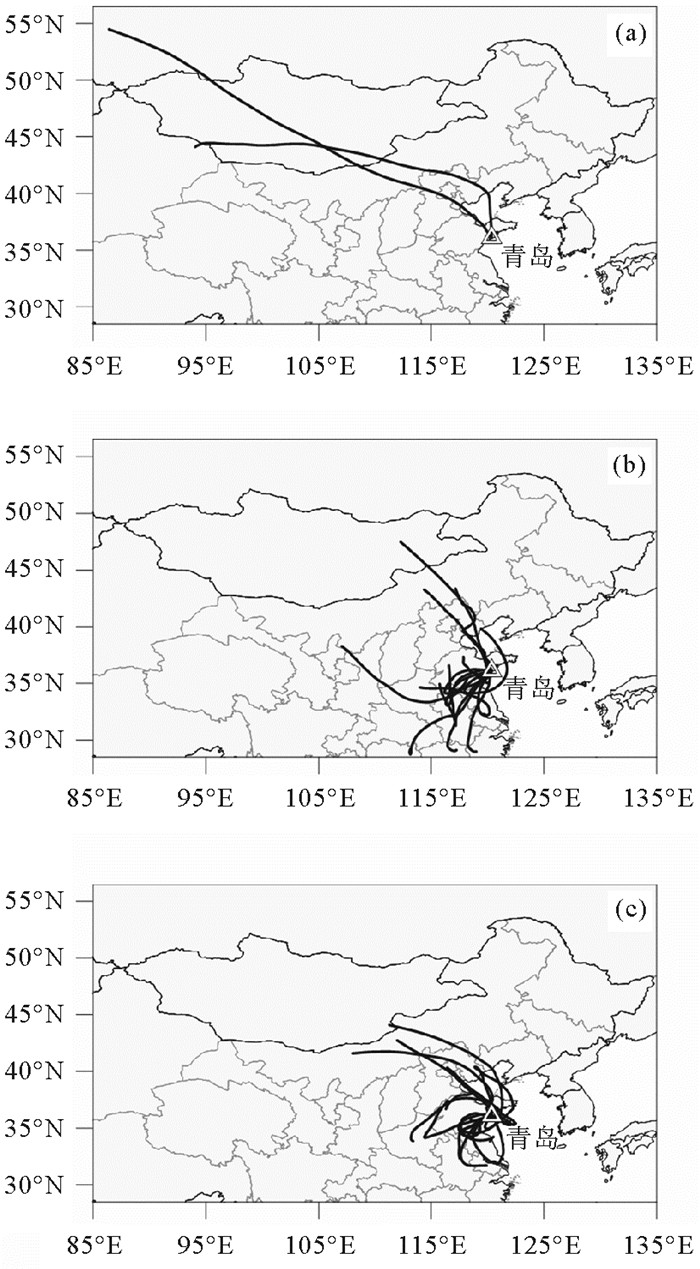
1.3 样品分类根据采样期间青岛发生雾、霾和沙尘等天气现象(中国气象局3 h Micaps天气图资料)对样品进行分类。3月9日和4月8日样品采集期间青岛出现浮尘,且这两个样品中沙尘源的代表性元素Al浓度超过10 000 ng/m3。为考察长距离输送和局地低空污染气团的影响,模拟的样品采集期间气团48h后向轨迹(500 m)也显示它们起源自西北沙尘源区(见图 1(a)),因此,认为它们是沙尘源样品。当雾或霾的持续时间超过样品采集时间的70%时,这些样品记为雾或霾样品,其中雾样品19个、霾样品13个。气团后向轨迹显示雾样品中有5个样品主要来自海上,其余14个雾样品和霾样品均受到京津冀或华东城市群局地污染源的影响(见图 1(b), (c)),认为这些样品为人为源样品。由于雾样品和霾样品采集期间的相对湿度(RH)有显著差异,平均分别为85%和63%,所以将人为源样品分为霾样品(13个)和雾样品(14个)两组,与沙尘源气溶胶样品对比讨论。
|
( (a)沙尘源样品;(b) 人为源-霾样品;(c)人为源-雾样品(500 m高度)。(a) Dust samples; (b) Anthropogenic haze samples; (c) Anthropogenic fog samples (500 m above ground level). ) 图 1 每个气溶胶样品采集期间气团48 h后向轨迹 Fig. 1 The 48 h backward trajectories of air mass |
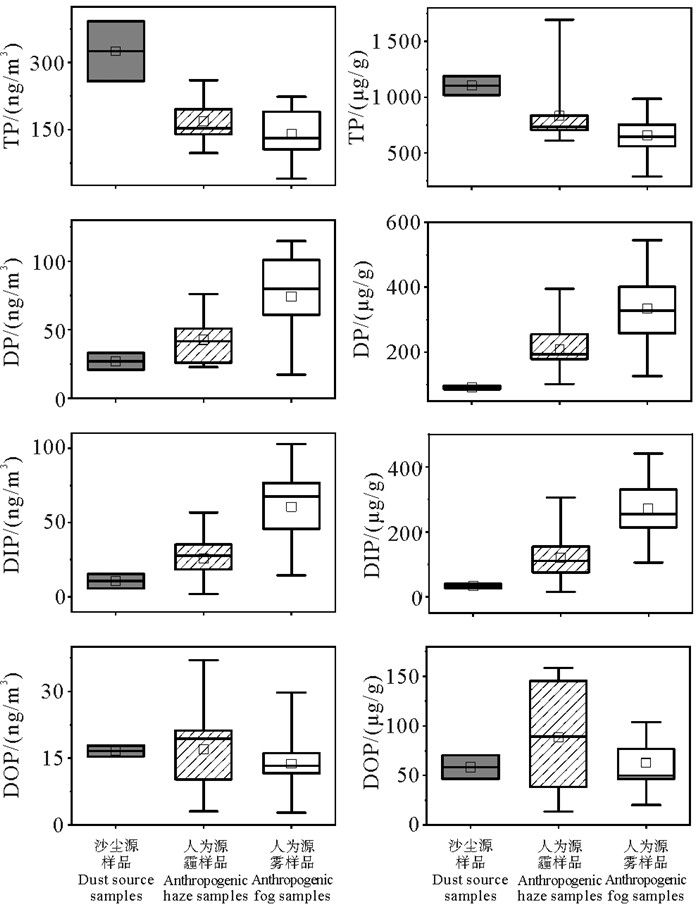
TP浓度中值在沙尘源气溶胶样品中为325.5 ng/m3,在人为源-霾气溶胶和雾气溶胶样品中分别为152.9和142.2 ng/m3(见图 2)。沙尘源气溶胶中TP浓度显著高于人为源气溶胶,约为后者的2倍。Guo等[18]研究亚洲沙尘对东中国海的大气输入时也发现,沙尘天气下气溶胶中TP浓度为155 ng/m3,显著高于非沙尘天气下的43 ng/m3。但DP浓度中值在沙尘源气溶胶中仅为27.1 ng/m3,显著低于人为源-雾气溶胶中的80.0 ng/m3,也低于人为源霾气溶胶中的41.8 ng/m3。Zamora等[9]在北大西洋沿岸迈阿密的研究也显示,受人为污染影响的气溶胶中DP浓度比未受污染影响的高70%。与TP浓度在雾、霾气溶胶中基本相当不同,DP浓度在雾气溶胶中约为霾气溶胶中的2倍。DP浓度在人为源气溶胶中较之沙尘气溶胶中的升高主要是由于人为源贡献了更多DIP的缘故,其对DP的贡献在人为源气溶胶中为68%~84%,在沙尘源气溶胶中约为40%。DOP浓度在人为源和沙尘源气溶胶中无显著差异,浓度中值基本相当,约为15~20 ng/m3。但DOP在沙尘源气溶胶中对DP的相对贡献明显高于人为源气溶胶,这与Violaki[19]报道的沙尘和生物气溶胶是大气颗粒物中有机P的最主要来源一致。
|
图 2 沙尘源和人为源气溶胶中不同形态P浓度(ng/m3) 及其在单位质量颗粒物中浓度(μg/g) Fig. 2 Concentrations of P species (ng/m3) and contents of P species per unit mass particle (μg/g) in dust aerosols and anthropogenic aerosols |
进一步计算了单位质量颗粒物中P浓度(μg/g),结果显示TP浓度中值在沙尘源气溶胶样品中为1 104.0 μg/g,高于地壳中TP含量(1 000 μg/g),在人为源-霾气溶胶和雾气溶胶样品中分别为736.2和646.2 μg/g(见图 2)。沙尘源样品中TP浓度比人为源气溶胶高约50%~70%。但DP浓度中值在人为源-雾气溶胶中为327.3 μg/g、霾气溶胶中为193.2 μg/g,比沙尘源气溶胶中91.5 μg/g高约1~2.5倍。人为源气溶胶中负载的DP主要是DIP,占57%~78%。DOP在沙尘源和人为源气溶胶中的负载无显著差异,霾气溶胶略高于雾气溶胶和沙尘源气溶胶。在地中海采集的沙尘气溶胶中TP含量基本在900~1 300 μg/g[20],与本文的结果相当。人为燃烧源释放的颗粒物中TP含量很高,如燃油飞灰中为(5.77±2.49) mg/g,燃煤飞灰中为(2.56±2.51) mg/g[21]。但也有研究报道世界各地225个燃煤样本中P含量的变化范围很宽,从4 μg/g到7 700 μg/g,平均为500 μg/g[5]。
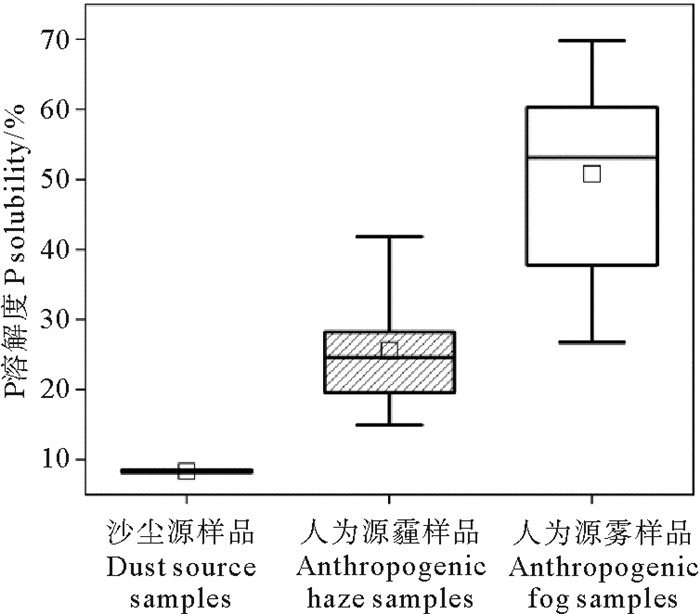
2.2 沙尘源和人为源气溶胶中P溶解度P溶解度中值在沙尘源气溶胶中为8.3%,在人为源-霾气溶胶中为24.6%、雾气溶胶中为55.5%(见图 3)。人为源气溶胶中P溶解度显著高于沙尘源气溶胶,这与全球其他地区的研究结果一致。在撒哈拉沙漠、中国内蒙古沙尘源地和以色列内盖夫沙漠采集的沙尘气溶胶的分析结果显示,P溶解度分别为8%~10%,5.5%和11%[9, 22-23]。Guo等[19]在东中国海近海岛屿上的观测发现,未受酸化过程影响的沙尘气溶胶中P溶解度约为10%,明显低于人为源气溶胶中的23%。Weinberger等[24]研究发现人为源排放煤飞灰中P溶解度为38%~45%。模式估计全球尺度上人为源排放的P溶解度约50%[18, 25]。
|
图 3 沙尘源和人为源气溶胶中P溶解度 Fig. 3 Comparison of P solubility in dust and anthropogenic aerosols |
人为源雾气溶胶样品中P溶解度显著高于霾样品,可能是雾样品中P的初始溶解度就高于霾样品,和/或者雾样品中不溶态P的酸溶解效率更高使P溶解度二次升高的缘故。相关性分析显示,P溶解度与一次排放的人为源元素Pb和Zn在雾样品和霾样品中均有显著相关关系,且霾样品中的相关性(r=0.72~0.73,p < 0.01)好于雾样品(r=0.55~0.60,p < 0.05);但P溶解度与二次生成酸组分NO3-和SO42-的显著相关关系仅在雾样品中存在(r=0.58~0.62,p < 0.05)。这些结果可能表明霾样品中P溶解度主要受一次源排放P的初始溶解度影响,而雾样品中P溶解度除了与P初始溶解度有关外,还受到大气酸化作用的影响。
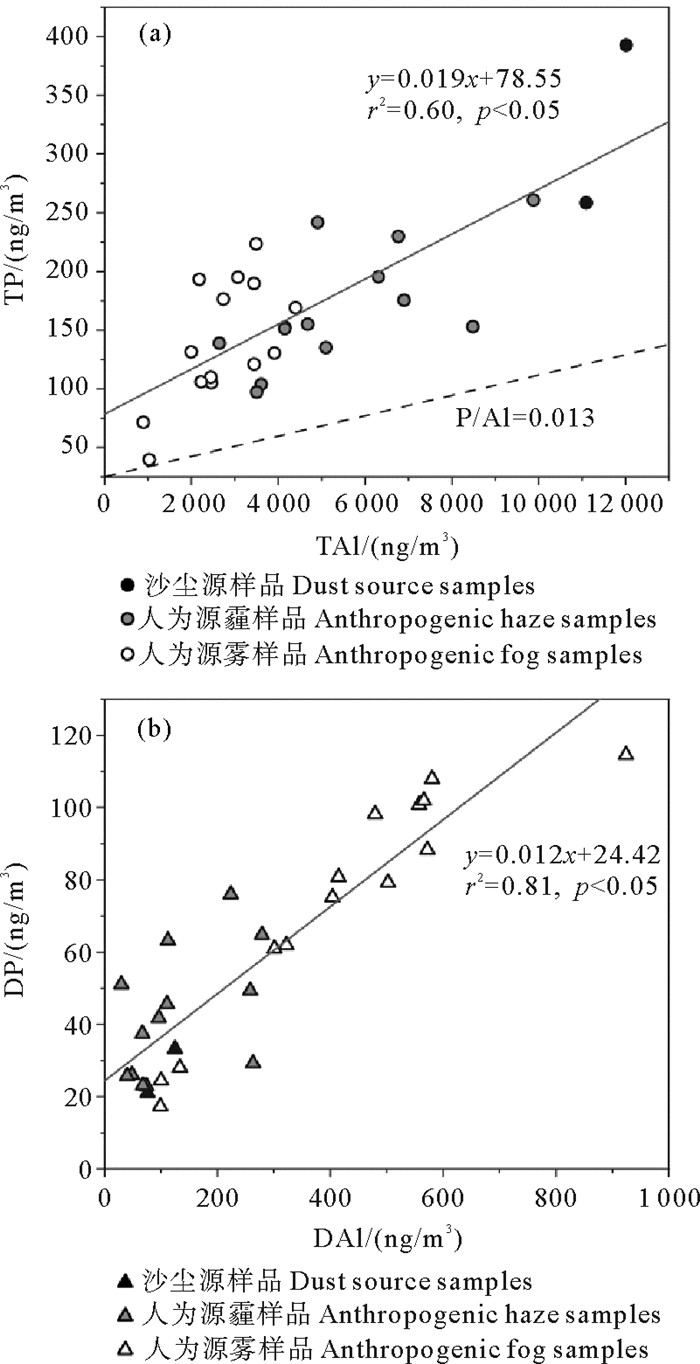
2.3 P浓度及溶解度与气溶胶P来源的关系矿物沙尘气溶胶是大气TP的主要来源[5]。相关性分析显示沙尘源和人为源气溶胶中TP与Al、Fe、Ba、Mn等地壳元素均存在统计意义上的相关关系(r=0.78~0.91,p < 0.01)。由于Al在矿物沙尘中含量稳定,且几乎没有其他来源[26],故选择Al作为地壳源指示元素,讨论P浓度及溶解度与气溶胶来源的关系。TP与总Al(TAl)拟合的线性方程为y=0.019x+78.55,其斜率大于地壳中P与Al的比值0.013[17],且包括两个沙尘源样品在内的所有数据点均位于P/Al=0.013之上(见图 4(a)),表明即使是采集的沙尘源样品,TP也有其他来源。假设气溶胶中的Al全部来自地壳源,根据地壳中Al的丰度(8%)及P与Al的比值(0.013),可计算气溶胶样品中矿物源(Mineral sources)贡献的颗粒物(PMm=TAl/0.08)和TP(TPm=0.013TAl)的质量浓度,其他非矿物源(Non-mineral source)对颗粒物(PMnm)和TP(TPnm)的贡献可以由颗粒物质量浓度和TP浓度与矿物源贡献的部分差减得到。大气中P主要来源于人为活动和自然沙尘以及一小部分生物P[5],雾霾天采集的气溶胶颗粒则主要来自人为源,因此,矿物源之外的其他源的贡献可以粗略的看作是人为源贡献的最大值。
|
( P/Al=0.013代表地壳中P与Al的比值。The line of P/Al=0.013 represents the ratio of P to Al in the crust. ) 图 4 沙尘源和人为源气溶胶中TP与总Al(a);DP与溶解态Al(b) 的关系 Fig. 4 Correlations of TP with total Al (a) and DP with dissolved Al (b) in dust aerosols and anthropogenic aerosols |
计算结果显示,非矿物源对气溶胶样品中颗粒物质量的贡献在雾样品中为86%,霾样品中为71%,沙尘样品中也混有48%的非矿物源颗粒,这与我们在腾格里沙漠源地采集的沙尘气溶胶样品中,观测到含有较多煤飞灰和焦油球等人为源颗粒的结果一致。非矿物源P对气溶胶样品中TP的贡献在雾样品和霾样品中分别约为75%和60%,在沙尘样品中约为50%。在孟加拉湾的观测发现,气溶胶中TP的75%来自农业肥料和生物质燃烧[13]。模式研究显示,全球尺度上与燃烧源相关的排放约贡献了大气TP的50%[5]。
DP与溶解态Al(DAl)也呈显著相关关系(见图 4(b)),二者之间拟合直线的斜率为0.12,高于TP与TAl的拟合斜率,表明二者有相似的来源或者经历了相似的大气化学过程,且P比Al更易溶解[8]。矿物沙尘中P溶解度一般为5%~10%[27],以5%作为矿物源贡献的TP的溶解度,据此可粗略计算矿物源DP(DPm=0.05TPm)和非矿物源DP(DPnm=DP-DPm)浓度及对DP的相对贡献。结果显示人为源-雾样品和霾样品中DP的90%以上来自非矿物源的贡献;沙尘源样品中非矿物源对DP的贡献约为70%。
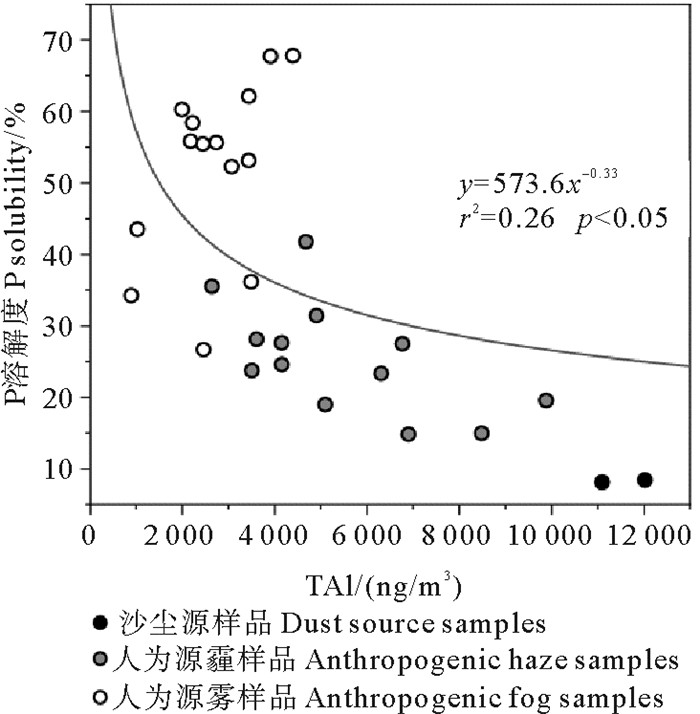
P溶解度和TAl浓度呈负幂指数关系(见图 5),这种关系可以归因于两个端源的混合,即低P溶解度和高Al负载的矿物沙尘源气溶胶和高P溶解度和低Al负载的人为源气溶胶的混合。可以看出从人为源端到沙尘源端依次是人为源的雾样品、霾样品以及沙尘源样品,这些样品中非矿物源P的贡献也呈现75%、60%、50%依次降低的趋势。P溶解度与TAl之间的反比关系也反映了气溶胶颗粒粒径的影响。颗粒粒径越小表面积越大,这可以更有效地作为酸组分的汇,从而易导致矿物沙尘源元素溶解度增加[14, 28]。P溶解度与气溶胶比表面积之间存在显著线性相关关系(r=0.32,p < 0.05),也证实了这一点。
|
图 5 沙尘源和人为源气溶胶中P溶解度和总Al的关系 Fig. 5 Relationship between P solubility and total Al in dust and anthropogenic aerosol samples |
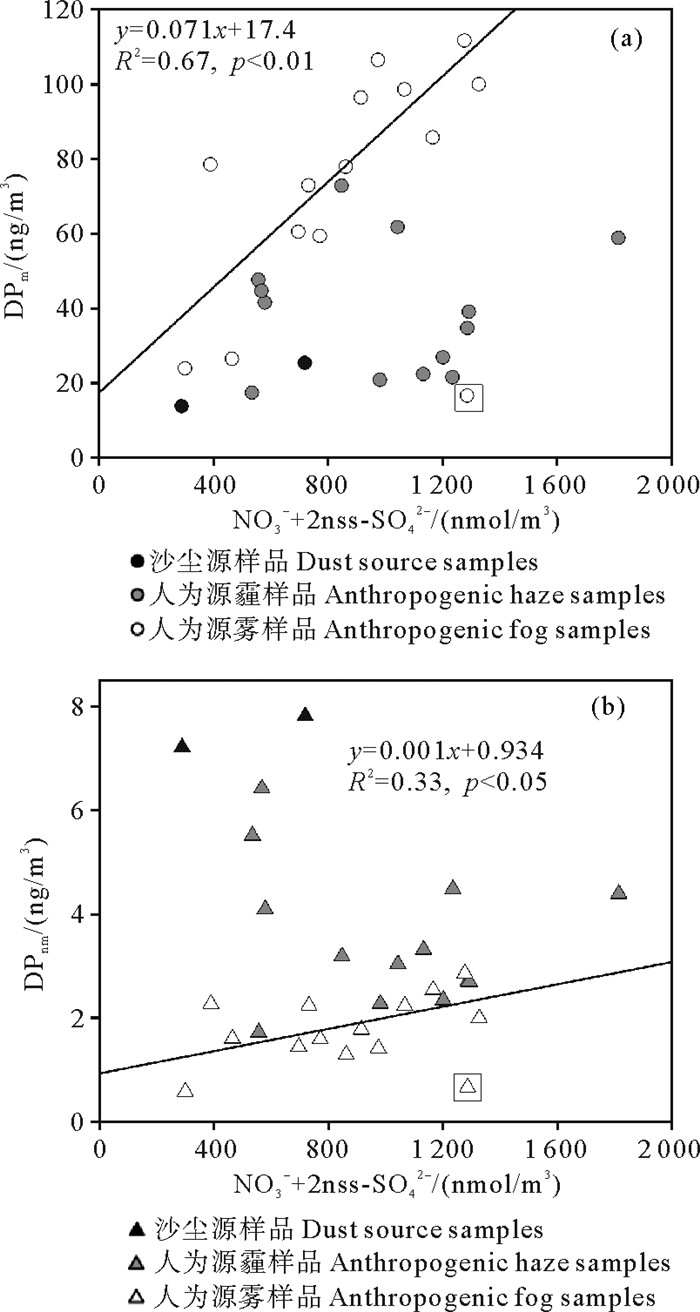
大气酸化作用被普遍认为是影响气溶胶中溶解态P浓度及P溶解度的重要因素[6, 29]。SO42-和NO3-是气溶胶中两个主要酸组分,考虑到海盐对SO42-的贡献,计算了非海盐nss-SO42-摩尔浓度([nss-SO42-] =[SO42-] -0.06[Na+]),并合并nss-SO42-和NO3-,以总酸当量浓度([2nss-SO42-+NO3-])及酸化程度([2nss-SO42-+NO3-]/TP, nmol/nmol)进行讨论。酸化作用对矿物源P和非矿物源P的影响程度可能不同,因此,将DP分为DPm和DPnm,P溶解度也相应分为Pm溶解度(DPm/TP)和Pnm溶解度(Pnm/TP),讨论DP浓度与总酸当量浓度以及P溶解度与酸化程度的关系。DPm和DPnm浓度与[2nss-SO42-+NO3-]的相关关系总体上不显著,这可能与沙尘源样品和雾、霾样品中DP产生机理不同有关。雾样品中除一个离散样品外,非矿物源DP与酸浓度呈显著相关关系(见图 6)。分析这个离散样品与其他雾样品的差异,发现该样品TP含量很低,酸组分含量很高,其后向轨迹显示气团从污染区域向青岛传输时速度较快,约为其他样品的4倍。在污染区域停留时间较短,使得该样品中尽管酸组分含量高,但气溶胶P没有充足的反应时间,因此DP浓度并不高。不包括这个离散点,其他数据点拟合的斜率对矿物源P为0.001,明显低于非矿物源P的0.071,表明酸化作用对矿物源P的溶解转化远远低于非矿物源P。
|
( 直线为雾样品数据点的拟合线,不包括方块中的数据点。The regression line fits the data points of fog samples excluding the data point within the square. ) 图 6 气溶胶样品中矿物源DP (a)和非矿物源DP(b)与[2nss-SO42-+NO3-]的关系 Fig. 6 Correlations of mineral DP (DPm) and non-mineral DP (DPnm) with the molar concentration of [2nss-SO42-+NO3-] in aerosol samples |
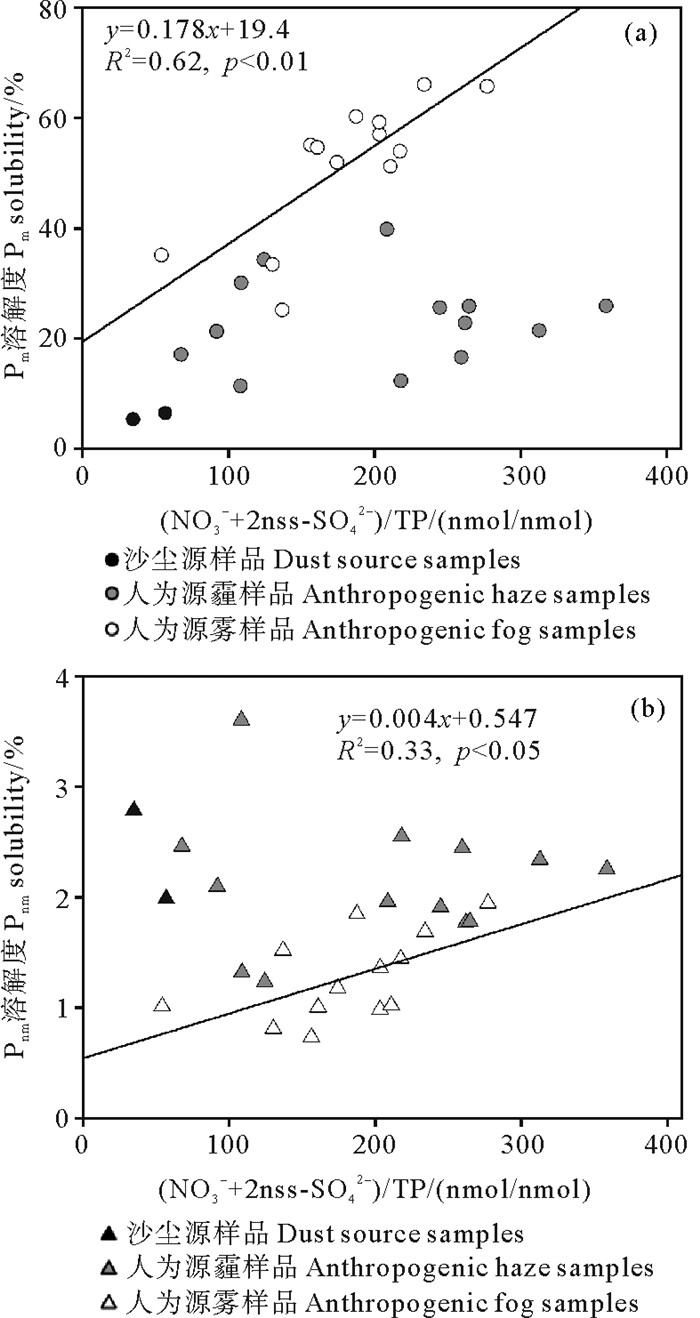
Pm溶解度和Pnm溶解度与[2nss-SO42-+NO3-]/TP的相关关系也显示,雾样品中矿物源P和非矿物源P均与酸化程度呈显著相关关系,拟合斜率分别为0.004和0.178(见图 7)。酸化作用对矿物源P溶解度的提高非常有限,但对非矿物源P的酸化效率较高,为矿物源P的近50倍。总体上,矿物源P溶解度的贡献不大,约为1%~3%。P溶解度主要决定于非矿物源P的初始溶解度以及大气P的酸溶解转化对溶解度的二次提升。由拟合直线的截距可知,雾天样品中非矿物源P的初始溶解度至少为20%,酸化作用使溶解度升高约10%~40%。雾天较高的相对湿度有利于SO2、NO2发生非均相反应生成相应的酸,从而促进气溶胶P的酸溶解转化提高P溶解度[17]。有研究报道,在全球尺度上,气溶胶中DP的65%来自一次排放源的贡献,35%来自二次酸化溶解的贡献[11]。
|
( 直线为雾样品数据点的拟合线,不包括方块中的数据点。The regression line fits the data points of fog samples excluding the data point within the square. ) 图 7 气溶胶样品中矿物源DP贡献的溶解度(Pm%)(a)和非矿物源DP贡献的溶解度(Pnm%) (b)与酸化程度的关系 Fig. 7 Correlations of mineral P solubility (Pm%) (a) and non-mineral P solubility (Pnm%) (b)with acidification degree in aerosol samples |
霾天样品中P溶解度与酸化程度相关关系不显著,且DP浓度与酸组分也无相关关系,表明霾天样品中P溶解度主要决定于非矿物源P的初始溶解度,即DP主要来自非矿物源P的一次排放,二次酸转化的贡献较小,这可能与霾天相对较低的相对湿度有关。Shi等[17]研究发现,RH是影响P溶解度的重要因子,当RH低于60%时,即使在高的气溶胶酸度下,P溶解度也很难超过30%;当RH高于60%时,在酸性条件下,相对湿度越大,越有利于气溶胶中磷溶解度的提升。霾样品采集期间RH中值为62%,这可能限制了霾样品中P的酸溶解转化以及P溶解度的二次提升。
3 结语TP浓度中值在沙尘源气溶胶样品中最高,为325.5 ng/m3,约为人为源霾气溶胶和雾气溶胶样品的2倍。DP浓度中值则在人为源雾样品中最高,为80.0 ng/m3,约为霾样品的2倍、沙尘源样品的3倍。人为源样品中较高DP浓度主要来自DIP的贡献,DOP浓度在人为源和沙尘源样品中相当。P溶解度中值在人为源雾样品中为55.5%,显著高于霾样品的24.6%,二者均显著高于沙尘源样品中的8.3%。矿物P和非矿物P对沙尘源和人为源样品中TP和DP的相对贡献不同。非矿物P对TP的贡献在人为源雾样品和霾样品中分别约为75%和60%,在沙尘源样品中约为50%。对DP,人为源样品中90%以上来自非矿物P的贡献,沙尘源样品中则为70%。酸化作用对矿物P的溶解转化效率远远低于非矿物P。雾样品中P溶解度主要决定于非矿物P的初始溶解度(>20%)及其二次酸化(10%~40%);霾样品则主要决定于非矿物P的初始溶解度,其二次酸化的贡献较小。矿物P对溶解度的贡献较小,约为1%~3%。
| [1] |
Xie L, Gao X, Liu Y, et al. Perpetual atmospheric dry deposition exacerbates the unbalance of dissolved inorganic nitrogen and phosphorus in coastal waters: A case study on a mariculture site in North China[J]. Marine Pollution Bulletin. DOI:10.1016/j.marpolbul.2021.112866 (  0) 0) |
| [2] |
White C, Ussher S J, Fitzsimons M F, et al. Inorganic nitrogen and phosphorus in Western European aerosol and the significance of dry deposition flux into stratified shelf waters[J]. Atmospheric Environment. DOI:10.1016/j.atmosenv.2021.118391 (  0) 0) |
| [3] |
Josep P, Benjamin P, Jordi S, et al. Human-induced nitrogen-phosphorus imbalances alter natural and managed ecosystems across the globe[J]. Nature Communications. DOI:10.1038/ncomms2934 (  0) 0) |
| [4] |
Carbo P, Krom M D, Homoky W B, et al. Impact of atmospheric deposition on N and P geochemistry in the southeastern Levantine basin[J]. Deep Sea Research Part Ⅱ: Topical Studies in Oceanography, 2005, 52(22-23): 3041-3053. DOI:10.1016/j.dsr2.2005.08.014 (  0) 0) |
| [5] |
Wang R, Balkanski Y, Boucher O, et al. Significant contribution of combustion-related emissions to the atmospheric phosphorus budget[J]. Nature Geoscience, 2015, 8(1): 48-54. DOI:10.1038/ngeo2324 (  0) 0) |
| [6] |
Mahowald N, Jickells T D, Baker A R, et al. Global distribution of atmospheric phosphorus sources, concentrations and deposition rates, and anthropogenic impacts[J]. Global Biogeochemical Cycles. DOI:10.1029/2008GB003240 (  0) 0) |
| [7] |
O'Day Peggy A, Nwosu Ugwumsinachi G, Barnes Morgan E, et al. Phosphorus speciation in atmospherically deposited particulate matter and implications for terrestrial ecosystem productivity[J]. Environmental Science & Technology, 2020, 54(8): 4984-4994. (  0) 0) |
| [8] |
Hsu S, Wong G T F, Gong G, et al. Sources, solubility, and dry deposition of aerosol trace elements over the East China Sea[J]. Marine Chemistry, 2010, 120(1-4): 116-127. DOI:10.1016/j.marchem.2008.10.003 (  0) 0) |
| [9] |
Zamora L M, Prospero J M, Hansell D A, et al. Atmospheric P deposition to the subtropical North Atlantic: Sources, properties, and relationship to N deposition[J]. Journal of Geophysical Research: Atmospheres, 2013, 118(3): 1546-1562. DOI:10.1002/jgrd.50187 (  0) 0) |
| [10] |
Hernt B, Collier R W, Kvom M D. The role of dust in supplying nitrogen and phosphorus to the southeast mediterranean[J]. Limnoloyt & Oceanography, 2002, 47(3): 870-878. (  0) 0) |
| [11] |
Myriokefalitakis S, Nenes A, Baker A R, et al. Bioavailable atmospheric phosphorous supply to the global ocean: A 3-D global modeling study[J]. Biogeosciences, 2016, 13(24): 6519-6543. DOI:10.5194/bg-13-6519-2016 (  0) 0) |
| [12] |
Nenes A. Atmospheric acidification of mineral aerosols: A source of bioavailable phosphorus for the oceans[J]. Atmospheric Chemistry and Physics, 2011, 11(235): 6265-6272. (  0) 0) |
| [13] |
Srinivas B, Sarin M M. Atmospheric pathways of phosphorous to the Bay of Bengal: Contribution from anthropogenic sources and mineral dust[J]. Tellus: Series B, Chemical and Physical Meteorology. DOI:10.3402/tellusb.v64i0.17174 (  0) 0) |
| [14] |
Baker A R, Jickells T D, Witt M, et al. Trends in the solubility of iron, aluminium, manganese and phosphorus in aerosol collected over the Atlantic Ocean[J]. Marine Chemistry, 2006, 98(1): 43-58. DOI:10.1016/j.marchem.2005.06.004 (  0) 0) |
| [15] |
Baker A R, French M, Linge K L. Trends in aerosol nutrient solubility along a west-east transect of the saharen olust plume[J]. Geophysical Research Letters. DOI:10.1029/200SGL024764 (  0) 0) |
| [16] |
Shi J, Zhang J, Gao H, et al. Concentration, solubility and deposition flux of atmospheric particulate nutrients over the Yellow Sea[J]. Deep-Sea Research Part Ⅱ, 2013, 97: 43-50. DOI:10.1016/j.dsr2.2013.05.004 (  0) 0) |
| [17] |
Shi J, Wang N, Gao H, et al. Phosphorus solubility in aerosol particles related to particle sources and atmospheric acidification in Asian continental outflow[J]. Atmospheric Chemistry and Physics, 2019, 19(2): 847-860. DOI:10.5194/acp-19-847-2019 (  0) 0) |
| [18] |
Guo L, Chen Y, Wang F, et al. Effects of Asian dust on the atmospheric input of trace elements to the East China Sea[J]. Marine Chemistry, 2014, 163: 19-27. DOI:10.1016/j.marchem.2014.04.003 (  0) 0) |
| [19] |
Kalliopi V, Athanasios N, Maria T, et al. Bioaerosols and dust are the dominant sources of organic P in atmospheric particles[J]. npj Climate and Atmospheric Science. DOI:10.1038/s41612-021-00215-5 (  0) 0) |
| [20] |
Patricia C, Michael D K, William B H, et al. Impact of atmospheric deposition on N and P geochemistry in the southeastern Levantine basin[J]. Deep Sea ResearchⅡ, 2005, 52: 3041-3053. (  0) 0) |
| [21] |
Li R, Zhang H, Wang F, et al. Abundance and fractional solubility of phosphorus and trace metals in combustion ash and desert dust: Implications for bioavailability and reactivity[J]. The Science of the Total Environment, 2021, 816: 151495. (  0) 0) |
| [22] |
Herut B, Krom M D, Pan G, et al. Atmospheric input of nitrogen and phosphorus to the southeast mediterranean: Sources, fluxes, and possible impact[J]. Limnology & Oceanography, 1999, 44(7): 253-265. (  0) 0) |
| [23] |
杨宏伟, 郭博书, 李经纬. 内蒙古沙漠与沙尘粒子中磷形态分布特征及其环境意义[J]. 环境化学, 2012, 31(7): 990-997. Yang H W, Guo B S, Li J W. Distribution characteristics of phosphorus forms in the sand-dust and the desert particles in Inner Mongolia and its environmental significance[J]. Environmental Chemistry, 2012, 31(7): 990-997. (  0) 0) |
| [24] |
Weinberger R, Weiner T, Angert A. Isotopic signature of atmospheric phosphate emitted from coal combustion[J]. Atmospheric Environment, 2016, 136: 22-30. DOI:10.1016/j.atmosenv.2016.04.006 (  0) 0) |
| [25] |
Kanakidou M, Duce R A, Prospero J M, et al. Atmospheric fluxes of organic N and P to the global ocean[J]. Global Biogeochemical Cycles. DOI:10.1029/2011GB004277 (  0) 0) |
| [26] |
Arimoto R, Kim Y J, Kim Y P, et al. Characterization of Asian Dust during ACE-Asia[J]. Global and Planetary Change, 2006, 52(1): 23-56. (  0) 0) |
| [27] |
Herbert R J, Krom M D, Carslaw K S, et al. The effect of atmospheric acid processing on the global deposition of bioavailable phosphorus from dust[J]. Global Biogeochemical Cycles, 2018, 32: 1367-1385. DOI:10.1029/2018GB005880 (  0) 0) |
| [28] |
Baker A R, Croot P L. Atmospheric and marine controls on aerosol iron solubility in seawater[J]. Marine Chemistry, 2010, 120(1-4): 4-13. DOI:10.1016/j.marchem.2008.09.003 (  0) 0) |
| [29] |
Stockdale A, Krom M D, Mortimer R J G, et al. Understanding the nature of atmospheric acid processing of mineral dusts in supplying bioavailable phosphorus to the oceans[J]. Proceedings of the National Academy of Sciences of the United States of America, 2016, 113(51): 14639-14644. DOI:10.1073/pnas.1608136113 (  0) 0) |
2. Laboratory for Marine Ecology and Environmental Science, Pilot National Laboratory for Marine Science and Technology (Qingdao), Qingdao 266237, China
 2023, Vol. 53


