有色溶解有机物(Chromophoric Dissolved Organic Matter,简称CDOM),也称为“黄色物质”或gilvin[1],主要是腐殖酸和棕黄酸组成的大分子混合物。CDOM对光具有强烈的吸收,特别是对紫外(UV-A和UV-B)和可见光吸收显著。它们吸收紫外光后可发射荧光[2],也称为溶解荧光有机物,是影响水体颜色的三大成分之一。根据CDOM荧光结构和性质的差异可将其分为类腐殖质荧光组分和类蛋白荧光组分[3]。类腐殖质荧光组分是由腐烂的有机物产生的脂肪族和芳香族化合物组成的一类复杂混合物,主要有腐殖酸和富里酸两大类[4]。类蛋白质荧光组分主要来源于水中游离或结合态的芳香环氨基酸[5-6]。CDOM主要有两种来源:外源输入[7]和现场生物活动产生[8-9]。光漂白[10]、细菌的降解和利用、浮游植物摄食利用、形成大的聚合物等都是CDOM重要的去除途径和归宿。海洋中的CDOM对水体生物活动、海洋环境保护、海洋生物地球化学循环有重要影响[11-12]。近年来,随着Stedmon[13]在2003年首次提出将平行因子算法(PARAFAC)和三维荧光光谱(EEMs)结合起来的方法。越来越多的学者,利用该方法来分析海水、淡水[14]、雨水[15]、沉积物[16]中的CDOM。马海平等[17]在秋季的东海进行分析,发现东海海区受长江冲淡水等陆源输入的影响,CDOM呈近岸高、远岸低的分布规律。同时,她还分析出在东海海域存在的4种荧光组分。闫丽红等[11]在长江口外海域通过EEMs-PARAFAC分析了CDOM的荧光组分特征及其河口动力学行为。发现在长江口外海域有6种荧光成分,并且它们的保守行为不同。因此,对冬季黄渤海CDOM光学性质的现场调查分析具有实际意义。
渤海是近封闭的内海,其中三面环陆,东侧通过渤海海峡与黄海相连,水的交换能力较差。黄海是我国的陆架边缘海。冬季黄渤海受蒙古-西伯利亚高压和太平洋阿留申低压的共同影响,刮强劲的西北风,常伴随着寒潮的产生。黄渤海区域受对马暖流、黄海暖流、黄海沿岸流、渤海沿岸流的共同作用,水文条件比较复杂。在冬季,苏北沿岸流在西北风的影响下流入东海北部,而黄海暖流作为补偿流流入黄海南部,形成气旋式流动[18-20]。中国现有的CDOM研究主要集中在河口、湖口等区域,中国近海海区已有开展调查,但对冬季的黄渤海海域CDOM的报道较少,本文基于此,通过测定CDOM的吸收和荧光性质,分析了冬季黄渤海的CDOM光学性质,对于丰富我国CDOM数据,进一步探讨我国近海海域溶解有机物的生物地球化学过程具有重要意义。
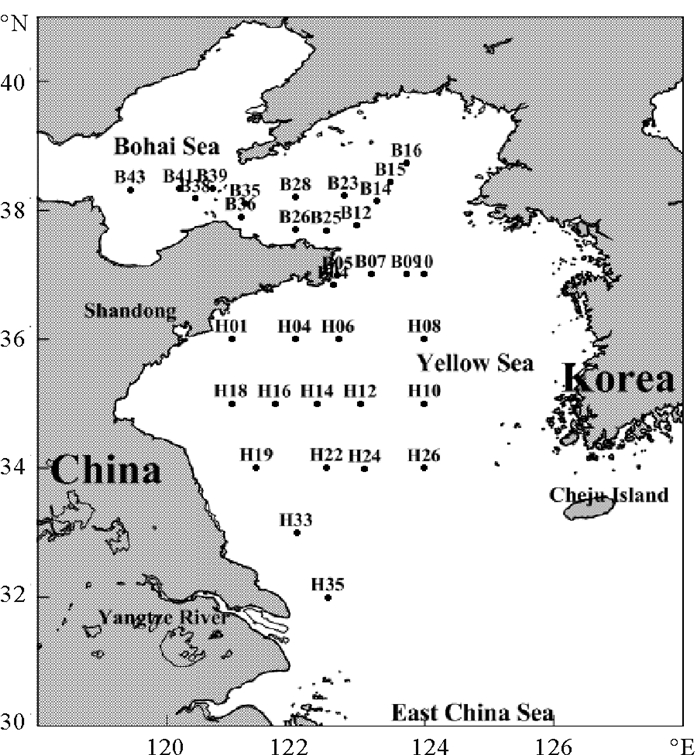
1 材料与方法 1.1 样品采集、预处理于2016年1~2月搭乘“东方红2号”海洋调查船对黄海和渤海进行调查,调查海区和站位如图 1所示。本文采集两个断面分析不同水深的CDOM,35°N断面(H10、H12、H14、H16、H18)以及成山角—东港断面(B12、B14、B15、B16),断面设置主要考虑近岸陆源输入和黄海暖流对黄海海区CDOM的影响。海水样品由Niskin采水器采集,现场海水温度、盐度等参数由CTD传感器在海水采集时同步测定。取300 mL海水样品用WhatmanGF/F玻璃纤维滤膜进行低压(<15 kPa)过滤,滤液倒入60 mL的棕色采样瓶中用于CDOM的测定,同时取40 mL滤液于采样瓶中用于DOC的测定,滤膜经锡纸包裹用于Chl-a的测定,所有的样品均在-20℃的条件下保存[1]。另外,采样所需的玻璃瓶、锡纸、滤膜均在设定温度为450 ℃的马弗炉下灼烧4 h。
|
图 1 冬季黄渤海调查站位图 Fig. 1 Location of research stations in the Bohai Sea and the Yellow Sea in winter |
将样品自然解冻至室温。采用紫外分光光度计(UV-2550 SHIMADZU,Japan)以Milli-Q水为空白,在200~800 nm下进行扫描,光谱分辨率为1 nm,得到一条吸收曲线。通过减去700~800 nm吸光值的平均值来减小仪器基线漂移、散射、折射的影响。据(1)计算吸收系数[22]:
| $ a = 2.303 \times A/L。$ | (1) |
式中:a为吸收系数(m-1);A为校正之后的吸光度;L为光路路径(0.1 m)。本文选在355 nm处的吸收系数a(355)来表示CDOM相对浓度。
自然水体中CDOM在500 nm以下的光谱吸收基本呈现指数递减趋势,可以用(2)表示[23]:
| $ a\left( \lambda \right) = a\left( {{\lambda _0}} \right)\exp \left( {s\left( {{\lambda _0}-\lambda } \right)} \right) + k。$ | (2) |
式中:a是CDOM的吸收系数(m-1);λ是波长(nm);λ0是参考波长(nm);S是光谱斜率(nm-1)。本文的参考波长选择为440 nm。光谱斜率比SR是S275-295和S350-400的比值,用来表示CDOM相对分子量的大小,SR值越大,分子量越小[24]。
1.2.2 三维荧光光谱的测定及分析采用F-4500荧光分光光度计(Hitachi Co., Japan)测定CDOM三维荧光光谱,配以1 cm的石英比色皿,以Milli-Q水为空白,进行荧光扫描。激发光源:150W氙灯;PMT电压:700V;激发波长:200~400 nm;发射波长:250~550 nm,波长间隔均为5 nm,扫描速度为1 200 nm/min。本文采用的荧光单位为拉曼单位(R.U.),以激发波长为350 nm时水的拉曼峰积分面积校准得到。
首先通过Delaunay差值法来消除光谱中的两大散射—拉曼散射和瑞利散射。通过Matlab软件中的“DOMFlour”程序,查看样品中出现的异常组分情况,一般leverage的数值越大,异常值存在的可能性越大。利用相邻两组分之间的残差突然大幅度减小,并且选择出残差值小的组分,这样可以初步确定样品中的最优组分的范围。通过折半分析来分析样品最优组分的个数。如果两次模拟的结果一致,则可确定最优组分。利用Matlab软件,进行反复的迭代过程,就可以将EEMs信号分解为单个的荧光组分[25]。
1.2.3 Chl-a(Chlorophyll a)的测定在样品管加10 mL 90%(体积比)丙酮水溶液在黑暗的条件下萃取滤膜24 h后,以4 000 r/min速度离心10 min,取上清液2 mL到比色皿中,使用荧光分光光度仪(Ex=436 nm,Em=670 nm)测定荧光强度,根据叶绿素的标准曲线进行浓度的转换。该方法的检出限为0.01 μg/L[26]。
1.2.4 DOC(Dissolved Organic Matter)的测定DOC的测定采用TOC-VCPH(SHIMADZU)型总有机碳分析仪,以邻苯二甲酸氢钾为标准溶液,手动进样,每次进样为50 μL。样品平行测定2~3次,取平均值,测定样品的相对标准偏差小于2%。
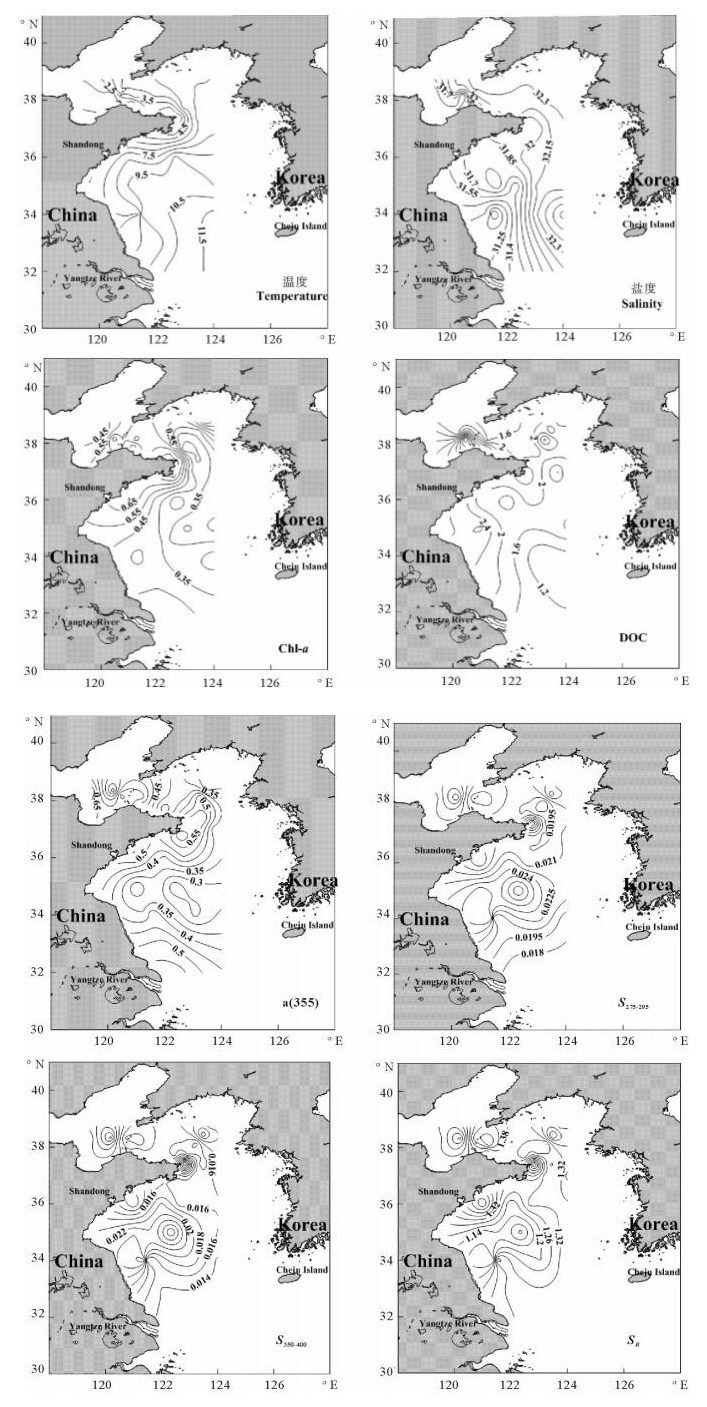
2 结果与讨论 2.1 黄渤海CDOM的吸收性质研究 2.1.1 表层海水中CDOM的水平分布特征表层参数分布如图 2所示。从分布图中看出,在鲁苏交界处出现低温低盐区域,分析原因是受到苏北沿岸流和鲁北沿岸流的影响。高温高盐水呈水舌状深入黄海中部,显然冬季黄渤海受到黄海暖流的影响[20]。a(355)范围为0.44~0.74 m-1,呈现出近岸高、远岸低的分布规律。在莱州湾等近岸出现高值区,显然在近岸海域易受到人类活动的影响。a(355)和叶绿素分布趋势一致,在黄海中部(H16、H22),a(355)数值相对较高,这可能是高温高盐的黄海暖流影响,同时冬季水体的混合作用加强,大量的有机物涌入到表层。与赵军杰在黄渤海研究的结果[21]相比,冬季a(355)值(0.44 m-1)低于秋季a(355)值(0.73 m-1),和春季a(355)值(0.40 m-1)基本一致,主要是不同季节的水动力环境的不同,冬季的风生涡动和垂直对流现象明显[27]。S275-295和S350-400的范围为0.017~0.031和0.010~0.034 nm-1。S275-295的最大值在H14附近,可能是远岸的CDOM主要受现场生物活动的影响,所含富里酸的比例较高,S275-295值偏高[28]。SR的变化范围为1.446~1.621,SR除在山东半岛附近出现高值外,基本上随着离岸的距离而逐渐增大。与赵军杰在黄渤海研究的结果[21]相比,发现冬季黄渤海的SR值低于秋季的SR值、和春季的SR值相当,分析原因是秋季的光照强烈,CDOM发生光降解使大分子物质降解为小分子物质,SR高[24]。
|
图 2 表层海水中温度(℃)、盐度、Chl-a (μg/L)、DOC(mg/L)、a(355)(m-1)、S275-295 (nm-1)、S350-400(nm-1)、SR的水平分布 Fig. 2 Horizontal distribution of temperature(℃), salinity, Chl-a(μg/L), DOC(mg/L), a(355)(m-1), S275-295 (nm-1), S350-400(nm-1) and SR |
|
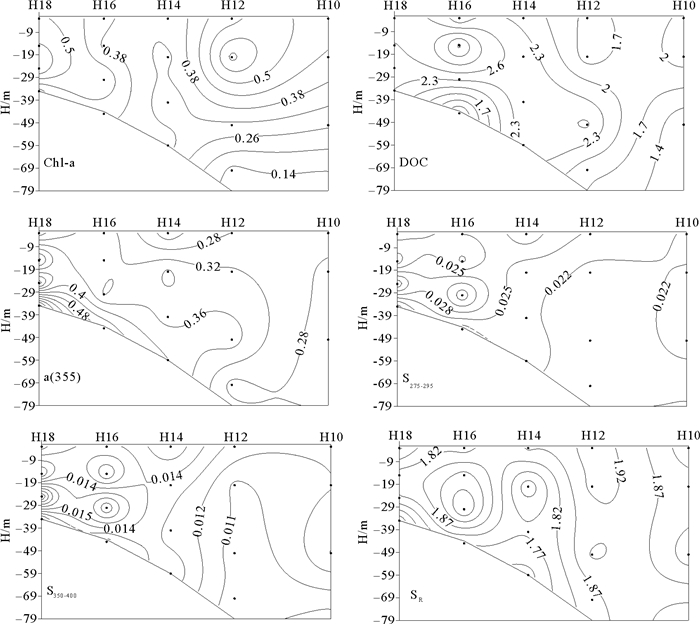
图 3 35°N断面Chl-a(μg/L)、DOC(mg/L)、a(355)(m-1)、S275-295 (nm-1)、S350-400(nm-1)、SR的垂直分布 Fig. 3 Vertical distribution ofChl-a(μg/L), DOC(mg/L), a(355)(m-1), S275-295(nm-1), S350-400(nm-1), and SR of 35°N section |
在35°N断面上采集了5个站位的水样,最大采样水深为80 m。冬季受西伯利亚和极地冷空气影响,太阳辐射明显减弱,西北风加强,海水有较强的垂直对流和风生涡动的混合作用[27]。a(355)的范围为0.21~0.71 m-1,总体呈现出近岸高、远岸低,表层低、底层高的分布趋势。底层值高是沉积物的再悬浮作用影响的结果。S275-295和S350-400的范围分别为0.017~0.037和0.012~0.093 nm-1,SR的范围为0.395~1.431,在近岸站位CDOM由于受到陆源输入和外海水共同影响,CDOM的来源和组成相对复杂。在站位H16以西,SR的分布比较均匀,CDOM的分子量变化范围不大。
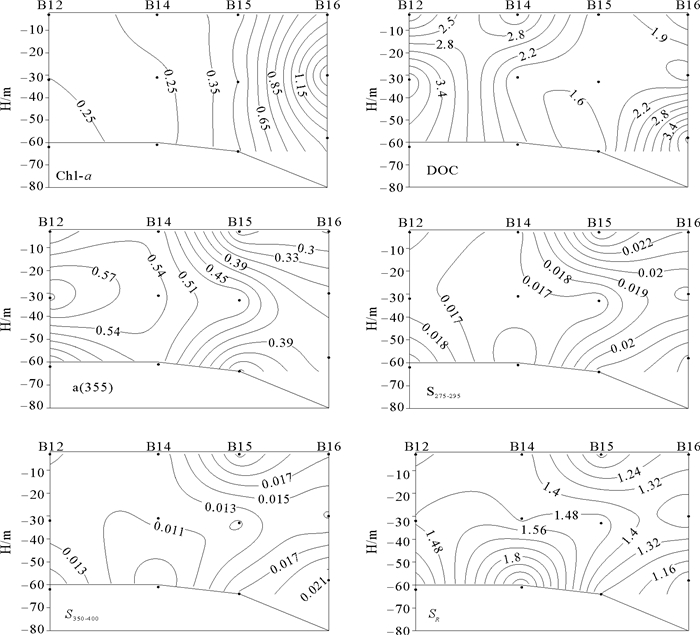
2.1.3 成山角—东港断面垂直分布特征在成山角—东港断面采集了4个站位的水样,最大采样水深为64 m。相比于35°N断面,该断面受到西北风的影响较大,海水的垂直混合作用明显。a(355)范围为0.26~0.64 m-1,整体分布呈现出中层高,表层、底层低的分布特征。从图 4看出,在站位(B12-B14)之间,a(355)的垂直混合不明显,在站位(B15-B16)之间,a(355)和叶绿素的最大值均出现在站位的中层。S275-295范围为0.014~0.025 nm-1,S350-400范围为0.007~0.024 nm-1,SR的变化范围为1.014~2.136,SR的分布比较复杂,总体呈表层值低、底层值高的分布规律,分析原因是底层受到沉积物再悬浮作用的影响。
|
图 4 成山角—东港断面Chl-a(μg/L)、DOC(mg/L)、a(355)(m-1)、S275-295(nm-1)、S350-400(nm-1)、SR的垂直分布 Fig. 4 Vertical distribution of Chl-a(μg/L), DOC(mg/L), a(355) (m-1), S275-295(nm-1), S350-400(nm-1), and SR of Cheng Shanjiao-East bay section |
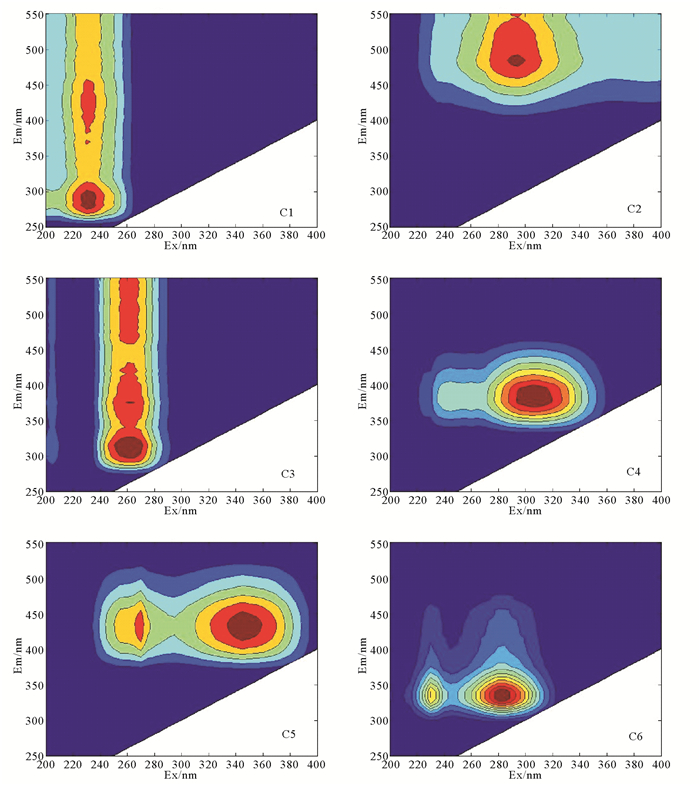
利用EEMs-PARAFAC对样品进行分析,在黄、渤海海水中鉴定出6种荧光组分(见表 1,图 5)。C1、C3是类酪氨酸荧光峰,相比于峰230(270)/306,C1的发射波长发生蓝移,同样C3的激发波长发生蓝移。分析原因是由于水文条件如pH、盐度等不同,加上不同微生物对氨基酸有不同的分解作用,造成类蛋白质荧光峰的蓝移[13;35]。C6为典型的类蛋白质荧光峰,285(230)/335分别为高激发波长、低激发波长处的类色氨酸[34],类色氨酸被认为是现场生物降解产生的不稳定成分[35]。类腐殖质C2有较高的发射波长,被认为与高分子量的具有芳香性的陆源有机物有关[13, 31]。组分C4被认为是海洋类腐殖质“M”峰,与Maie[33]报道的细菌类腐殖质荧光成分,Stedmon[32]报道的在废水中主要荧光组分相似。这种荧光成分很可能与细菌活动和外来有机物、自生源有机物的分解有关[33]。C5有两个激发波长分别为345和270nm,发射波长为430 nm,与类腐殖质荧光团相对应,被认为是传统的类腐殖质荧光“A”和类腐殖质荧光峰“C”相结合[3]。
|
|
表 1 六种荧光组分特征 Table 1 Six fluorescent component characteristics of CDOM |
|
图 5 冬季黄渤海的6种荧光谱图 Fig. 5 The six EEMs of CDOM of the Bohai Sea and the Yellow Sea in winter |
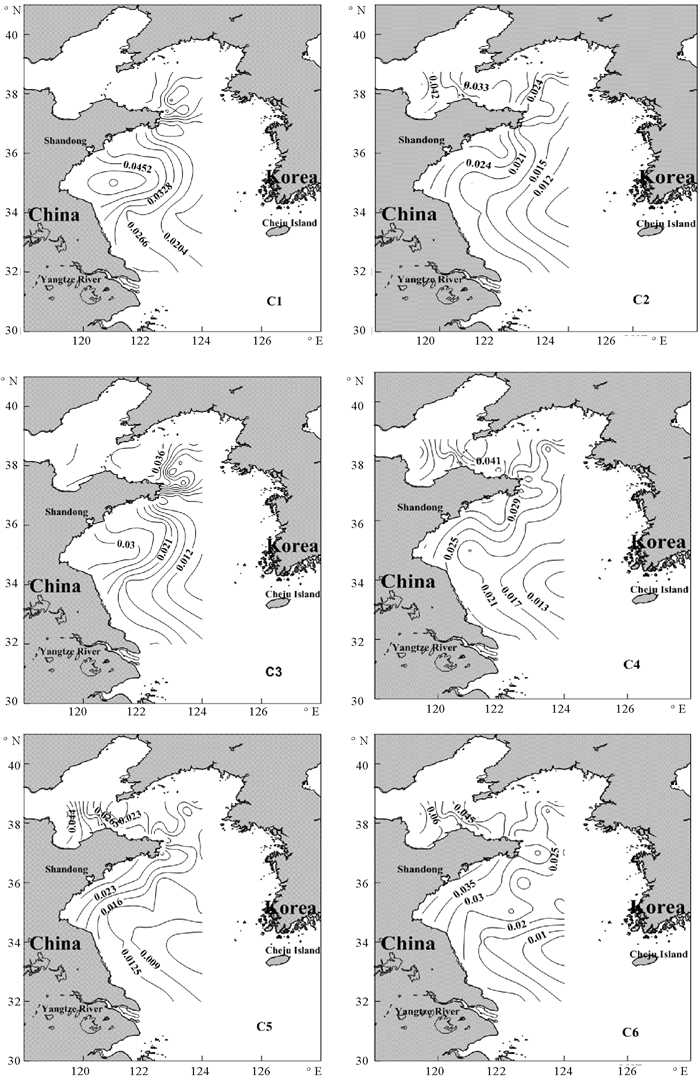
如图 6所示,这六种荧光组分在渤海的荧光平均值高于在黄海的荧光平均值,呈近岸高、远岸低的分布趋势,高值区出现在山东半岛沿岸一带,说明苏、鲁沿岸流是荧光成分分布的一个重要影响因素。其中,3种类腐殖质荧光成分水平分布相似,与盐度的分布趋势相反,说明陆源径流输入是水体类腐殖质的主要来源。此结果与Murphy等[6]分析结果一致。通常认为类蛋白质荧光成分与水体中的有机物现场降解有关[30],而在本文中,类蛋白质荧光成分呈现出近岸高、远岸低的分布规律,说明它们受到陆源输入和现场生物降解的共同影响[6]。
|
图 6 荧光组分(R.U.)的表层水平分布 Fig. 6 The surface distribution of fluorescence components (R.U.) |
|
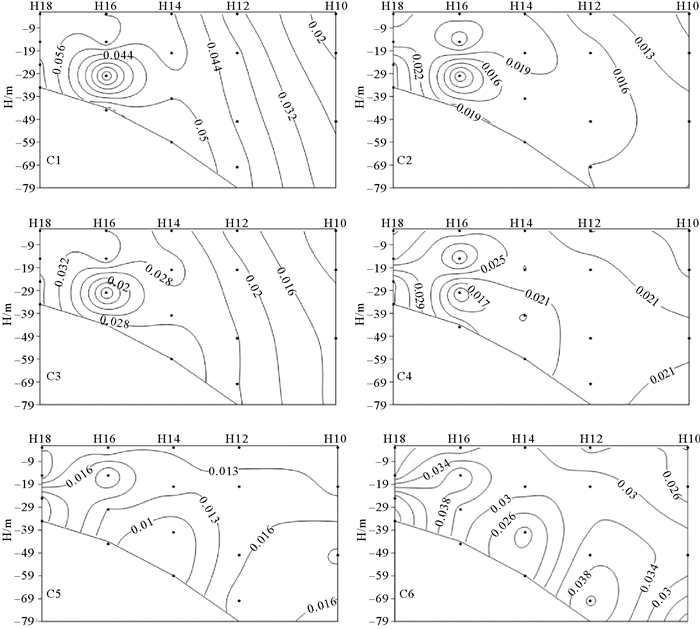
图 7 35°N断面各荧光组分(R.U.)的垂直分布 Fig. 7 Vertical distribution of fluorescence components (R.U.) of 35°N section |
|
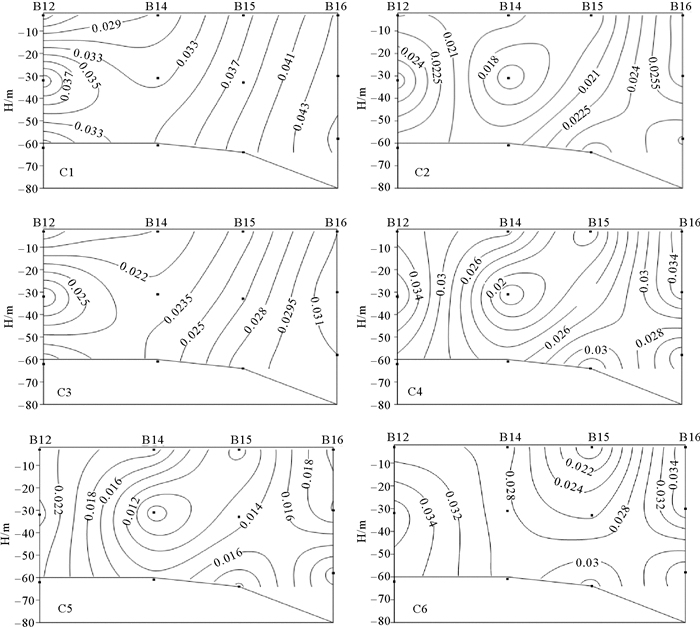
图 8 成山角—东港断面各荧光组分(R.U.)的垂直分布 Fig. 8 Vertical distribution of fluorescence components (R.U.) of Cheng Shanjiao-East bay section |
受底层沉积物中颗粒有机物再悬浮的影响,6种荧光组分在35°N断面底层均有较高的荧光值。类酪氨酸C1和C3分布图相似,在H16的30 m深处出现荧光极小值区,此处的叶绿素值较高,显然现场生产对CDOM的产生影响较小。在H14以西,海水垂直混合作用强烈,荧光强度在垂直方向上混合均匀,从近岸到远海呈现降低的趋势。类腐殖质C2和C4在H18的20 m深处出现高值区,与SR在该站位的垂直分布结果一致。近岸主要受陆源输入的影响,所含的腐殖质成分较多。C5和C6分布总体呈现出随深度的递增逐渐变小趋势,说明两种荧光成分有着相似的来源和迁移过程,陆源输入和现场生物生产等因素共同影响着荧光组分的分布。类腐殖质C5在中间层、底层的浓度相对较高,这与Yamashita Y等[31]研究结果并不一致,他发现在表层的浓度相对较高,指出原因很可能是在底层没有受到沉积物孔隙水的影响,而在研究海域的该断面海水的垂直混合作用较强,底层沉积物会释放一定的有机物,使中间层、底层的浓度相对较高。
2.2.4 成山角—东港断面的荧光组分垂直分布特征6种荧光成分在成山角—东港断面垂直方向上混合相对均匀,表底层荧光数值差异较小。类酪氨酸C1和C3的分布相似,在B12的30 m深处出现高值区,表底层数值差异不大,主要是近岸陆源输入的影响,风的搅动使表底层数值差异较小。类腐殖质组分C2、C4、C5分布相似,在B12的30 m深处存在一个高值区,而在B14的30 m深处出现极小值,总之,在B14以南,中间层荧光值均高于表层和底层的荧光值,站位B14以北,荧光成分在水体中的垂直混合现象比较明显。
2.3 冬季黄渤海不同参数的相关性分析从表 2中可以看出CDOM的发色团和荧光团与Chl-a、盐度没有明显的相关性,原因可能是在该海域CDOM的影响因素并不是单一的,影响CDOM的因素比较复杂。a(355)和类腐殖质荧光成分C2、C4、C5相关性较好,与C1、C3的相关性不明显,说明类腐殖质成分的发色团和荧光团在结构有密切的内在联系,这与郭卫东等人研究的结果一致[36]。从表 2中可以看出,C1和C3、C2和C4、C6和C4之间均呈显著的相关性,说明它们可能存在着共同的来源和相似的去除过程。
|
|
表 2 不同分析参数的相关性 Table 2 Correlations between the different analytical parameters |
(1) 表层a(355)范围为0.44~0.74 m-1,呈现出近岸高、远岸低的分布。SR的变化范围为1.446~1.621,SR除在山东半岛附近出现高值外,基本上随着离岸的距离而逐渐增大。在35°N断面上,a(355)的范围为0.21~0.71 m-1,呈现出近岸高、远岸低,表层低、底层高的分布。在成山角—东港断面上,a(355)的范围为0.26~0.64 m-1,呈现出中层高,表层、底层低的分布。
(2) EEMs-PARAFAC进行分析表明,CDOM在冬季黄渤海海水有6种组分:C1(230/295)、C3(260/315)、C6(285(230)/335)为类蛋白质荧光组分,C2(295/485)、C4(305/380)、C5(345(270)/430)为类腐殖质荧光组分。
(3) 由于受到陆源输入的影响,6种荧光组分在研究海区水平分布上呈现出近岸高、远岸低的趋势。在35°N断面上,这6种荧光组分在底层均有较高的荧光值,可能是受底层沉积物上的颗粒有机物再悬浮的影响。在成山角—东港断面上,这6种荧光成分在垂直方向上混合相对均匀,表底层数值差异极小。
(4) a(355)和C2、C4、C5的相关性较好,与C1、C3的相关性不明显,说明类腐殖质成分的发色团和荧光团在结构有密切的内在联系。另外,C1和C3、C2和C4、C6和C4之间均呈显著的相关性,说明它们可能存在着共同的来源和相似的去除过程。
| [1] |
Hancke K, Hoyland E K, Volent Z, et al. Optical properties of CDOM across the Polar Front in the Barents Sea: Origin, distribution and significance[J]. Journal of Marine Systems, 2014, 130(1): 219-227.
(  0) 0) |
| [2] |
Kalle K. The problem of the gelbstoff in the sea[J]. Oceanography Marine Biology Annual Review, 1966, 4: 91-104.
(  0) 0) |
| [3] |
Coble P G. Characterization of marine and terrestrial DOM in seawater using excitation-emission matrix spectroscopy[J]. Marine Chemistry, 1996, 51(4): 325-346. DOI:10.1016/0304-4203(95)00062-3
(  0) 0) |
| [4] |
Kowalczuk P, Cooper W J, Durako M J, et al. Characterization of dissolved organic matter fluorescence in the South Atlantic Bight with use of PARAFAC model: Relationships between fluorescence and its components, absorption coefficients and organic carbon concentrations[J]. Marine Chemistry, 2010, 118(1-2): 22-36. DOI:10.1016/j.marchem.2009.10.002
(  0) 0) |
| [5] |
Shatrughan S, D'SA E J, Swenson E M. Chromophoric dissolved organic matter (CDOM) variability in Barataria Basin using excitation-emission matrix (EEM) fluorescence and parallel factor analysis (PARAFAC)[J]. Science of the Total Environment, 2010, 408(16): 3211-3222. DOI:10.1016/j.scitotenv.2010.03.044
(  0) 0) |
| [6] |
Murphy K R, Stedmon C A, Waite T D, et al. Distinguishing between terrestrial and autochthonous organic matter sources in marine environments using fluorescence spectroscopy[J]. Marine Chemistry, 2008, 108(1-2): 40-58. DOI:10.1016/j.marchem.2007.10.003
(  0) 0) |
| [7] |
Rochelle-Newall E J, FISHER T R. Production of chromophoric dissolved organic matter fluorescence in marine and estuarine environments: an investigation into the role of phytoplankton[J]. Marine Chemistry, 2002, 77(1): 7-21. DOI:10.1016/S0304-4203(01)00072-X
(  0) 0) |
| [8] |
Wada S, Aoki M N, Tsuchiya Y, et al. Quantitative and qualitative analyses of dissolved organic matter released from Ecklonia cava, Kjellman, in Oura Bay, Shimoda, Izu Peninsula, Japan[J]. Journal of Experimental Marine Biology & Ecology, 2007, 349(2): 344-358.
(  0) 0) |
| [9] |
Zhang Y, van Dijk M A V, Liu M, et al. The contribution of phytoplankton degradation to chromophoric dissolved organic matter (CDOM) in eutrophic shallow lakes: Field and experimental evidence[J]. Water Research, 2009, 43(18): 4685-4697. DOI:10.1016/j.watres.2009.07.024
(  0) 0) |
| [10] |
Moran M A, Sheldon W M, Zepp R G. Carbon loss and optical property changes during long-term photochemical and biological degradation of estuarine dissolved organic matter[J]. Limnology & Oceanography, 2000, 45(6): 1254-1264.
(  0) 0) |
| [11] |
闫丽红, 陈学君, 苏荣国, 等. 2010年秋季长江口口外海域CDOM的三维荧光光谱-平行因子分析[J]. 环境科学, 2013, 34(1): 51-60. Yan L H, Chen X J, Su R G, et al. Resolving characteristics of CDOM by excitation-emission matrix spectroscopy combined with parallel factor analysis in the seawater of outer Yangtze estuary in autumn in 2010[J]. Environmental Science, 2013, 34(1): 51-60. (  0) 0) |
| [12] |
朱伟健, 沈芳, 洪官林. 长江口及邻近海域有色溶解有机物(CDOM)的光学特性[J]. 环境科学, 2010, 31(10): 2292-2298. Zhu W J, Shen F, Hong G L. Optical characteristics of colored dissolved organic material(CDOM) in Yangtze estuary[J]. Environmental Science, 2010, 31(10): 2292-2298. (  0) 0) |
| [13] |
Stedmon C A, Markager S, Bro R. Tracing dissolved organic matter in aquatic environments using a new approach to fluorescence spectroscopy[J]. Marine Chemistry, 2003, 82(3-4): 239-254. DOI:10.1016/S0304-4203(03)00072-0
(  0) 0) |
| [14] |
Hong H, Wu J, Shang S, et al. Absorption and fluorescence of chromophoric dissolved organic matter in the Pearl River Estuary, South China[J]. Marine Chemistry, 2005, 97(1-2): 78-89. DOI:10.1016/j.marchem.2005.01.008
(  0) 0) |
| [15] |
程远月, 郭卫东, 龙爱民, 等. 利用三维荧光光谱和吸收光谱研究雨水中CDOM的光学特性[J]. 光谱学与光谱分析, 2010, 30(9): 2413-2416. Cheng Y Y, Guo W D, Long A M, et al. Study on optical characteristics of chromophoric dissolved organic matter(CDOM) in rainwater byfluorescence excitation-emission matrix and absorption spectroscopy[J]. Spectroscopy and Spectral Analysis, 2010, 30(9): 2413-2416. (  0) 0) |
| [16] |
Burdige D J, Kline S W, Chen W. Fluorescent dissolved organic matter in marine sediment pore waters[J]. Marine Chemistry, 2004, 89(1-4): 289-311. DOI:10.1016/j.marchem.2004.02.015
(  0) 0) |
| [17] |
马海平, 张婧, 高先池, 等. 秋季东海有色溶解有机物(CDOM)的光学特性[J]. 海洋环境科学, 2014(6): 876-883. Mai H P, Zhang J, Gao X C, et al. Optical properties of the colored dissolved organic matter in the East China Sea in autumn[J]. Marine Environmental Science, 2014(6): 876-883. (  0) 0) |
| [18] |
Liu S, Shen X. Preliminary analysis of distribution and variation of perennialmonthly mean water masses inthe BohaiSea, theHuanghai Sea and the East China Sea[J]. Acta Oceanologica Sinica, 1992(4): 483-498.
(  0) 0) |
| [19] |
Su J. Circulation Dynamics of the China Seas: North of 18°N[C]. [s. 1. ]: The Sea, 1998: 13-19.
(  0) 0) |
| [20] |
Mask A C, O'brien J J, Ruth P. Wind-driven effects on the Yellow Sea Warm Current[J]. Journal of Geophysical Research Atmospheres, 1998, 103(C13): 30713-30729. DOI:10.1029/1998JC900007
(  0) 0) |
| [21] |
赵军杰. 基于吸收和荧光性质对中国黄渤海海域有色溶解有机物(CDOM)的分布特征研究[D]. 青岛: 中国海洋大学, 2013. Zhao J J. The Study on Characteristics and Distribution of Chromophoric Dissolved Organic Matter(CDOM) Based on Absorption and Fluorescence Properties in the Bohai Sea and the Yellow Sea[D]. Qingdao: Ocean University of China, 2013. http://cdmd.cnki.com.cn/Article/CDMD-10423-1013368451.htm (  0) 0) |
| [22] |
Loiselle S A, Luca B, Dattilo A M, et al. Optical characterization of chromophoric dissolved organic matter using wavelength distribution of absorption spectral slopes[J]. Limnology & Oceanography, 2009, 54(2): 590-597.
(  0) 0) |
| [23] |
Bricaud A, Morel A, Prieur L. Absorption by dissolved organic matter of the sea (yellow substance) in the UV and visible domains[J]. Limnology & Oceanography, 1981, 26(1): 43-53.
(  0) 0) |
| [24] |
Helms J R, Aron S, Ritchie J D, et al. Absorption spectral slopes and slope ratios as indicators of molecular weight, source, and photobleaching of chromophoric dissolved organic matter[J]. Limnology and Oceanography, 2008, 53(3): 955-969. DOI:10.4319/lo.2008.53.3.0955
(  0) 0) |
| [25] |
闫丽红. 基于三维荧光光谱—平行因子分析技术的黄东海有色溶解有机物(CDOM)的分布特征研究[D]. 青岛: 中国海洋大学, 2012. Yan L H. The Study on Distribution and Characteristics of Chromophoric Dissolved Organic Matter(CDOM) Using Excitation-Emission Matrix Spectroscopy-Parallel Factor Analysis in the Yellow Sea and the East China Sea[D]. Qingdao: Ocean University of China, 2012. http://www.bigengculture.com/kejilunwen/huaxue/252809.html (  0) 0) |
| [26] |
Parsons T R, Maita Y R, Lalli C M. A Manual of Chemical and Biological Methods of Seawater Analysis[M]. [s.1.]: Pergamon Press, 1984.
(  0) 0) |
| [27] |
鲍献文, 万修全, 吴德星, 等. 2000年夏末和翌年初冬渤海水文特征[J]. 海洋学报(中文版), 2004, 26(1): 14-24. Bao X W, Wan X Q, Wu D X, et al. Hydrologic characteristics of the end summertime in 2000 and early wintertime in 2001 in the Bohai sea[J]. Anta Ocean ologica Sinica, 2004, 26(1): 14-24. (  0) 0) |
| [28] |
Wang L, Zhao D Z, Yang J H, et al. The optical properties and remote sensing retrieval model of chromophoric dissolved organic matter in the DayangEstuary[J]. Acta Oceanologica Sinica, 2011, 33(1): 45-51.
(  0) 0) |
| [29] |
Yao X, Zhang Y, Zhu G, et al. Resolving the variability of CDOM fluorescence to differentiate the sources and fate of DOM in Lake Taihu and its tributaries[J]. Chemosphere, 2010, 82(2): 145-55.
(  0) 0) |
| [30] |
Coble P G, Carlos E, Del Castillo, Bernard Avril. Distribution and optical properties of CDOM in the Arabian Sea during the 1995[J]. Southwest Monsoon, 1998, 45: 2195-2223.
(  0) 0) |
| [31] |
Yamashita Y, Jaffe R, Maie N, et al. Assessing the dynamics of dissolved organic matter (DOM) in coastal environments by excitation emission matrix fluorescence and parallel factor analysis (EEM-PARAFAC)[J]. Limnology & Oceanography, 2008, 53(5): 1900-1908.
(  0) 0) |
| [32] |
Stedmon C A, Markager S. Resolving the variability in dissolved organic matter fluorescence in a temperate estuary and its catchment using PARAFAC analysis[J]. Limnology & Oceanography, 2005, 50(2): 686-697.
(  0) 0) |
| [33] |
Maie N, Yamashita Y, Cory R M, et al. Application of excitation emission matrix fluorescence monitoring in the assessment of spatial and seasonal drivers of dissolved organic matter composition: Sources and physical disturbance controls[J]. Applied Geochemistry, 2012, 27(4): 917-929. DOI:10.1016/j.apgeochem.2011.12.021
(  0) 0) |
| [34] |
Dubnick A, Barker J, Shapp M, et al. Characterization of dissolved organic matter (DOM) from glacial environments using total fluorescence spectroscopy and parallel factor analysis[J]. Annals of Glaciology, 2011, 51(56): 111-122.
(  0) 0) |
| [35] |
Determann S, Lobbes J M, Reuter R, et al. Ultraviolet fluorescence excitation and emission spectroscopy of marine algae and bacteria[J]. Marine Chemistry, 1998, 62(1): 137-156.
(  0) 0) |
| [36] |
郭卫东, 黄建平, 洪华生, 等. 河口区溶解有机物三维荧光光谱的平行因子分析及其示踪特性[J]. 环境科学, 2010(6): 1419-1427. Guo W D, Huang J P, Hong H S, et al. Resolving excitation and emission matrix spectroscopy of estuarine CDOM with parallel factor analysis and its application in organic pollution moriting[J]. Environmental Science, 2010(6): 1419-1427. (  0) 0) |
 2018, Vol. 48


