海上溢油是人类工业活动引发的严重海洋环境污染之一。上世纪90年代以来, 国际上可用于海洋观测的业务化卫星大发展, 为海上溢油事故监测提供了无可比拟的新技术支持。其中, 星载合成孔径雷达(Synthetic Aperture Radar, SAR)具有高空间分辨率、全天时全天候工作等优点, 且对海面油膜的探测灵敏度高, 被公认为监测海面溢油的理想传感器。
SAR对海面的成像机制基于雷达波与海面毛细波或短重力波的相互作用, 其简单模型是Bragg散射。海面油膜的存在, 引起局部海表面张力的变大, 导致海面粗糙度的变小, 从而使Bragg后向散射系数变小。在SAR图像上, 海面油膜相对于周围海面呈现为暗斑。但是, SAR图像中的暗斑不仅是海面溢油, 众多大气和海洋现象都可能导致SAR图像中的暗斑, 它们被称为疑似溢油(look-alikes)。因此, 利用星载SAR图像监测海面溢油的关键技术之一是海面溢油和疑似溢油的自动识别技术[1-3]。
目前, 用于海面油膜识别的分类方法主要有四种, 分别是概率统计模型[4-11]、神经网络[12-18]、决策树[2, 21-23]以及模糊逻辑[19-20, 32]。这些方法的共同点是, 通过各种方式试图建立一个高检测率的单分类器。实际上, 获得一个高检测率及优秀泛化性能和稳定性能的强单分类器是相当困难的, 因此, Schipire等于1990年代在计算机学习领域提出了将多个弱分类器组合为强分类器的算法[24], 其中包括Boosting算法及其改进型AdaBoost算法[25-26]和Bagging算法[30-31]。这些算法在计算机领域已成为分类器性能增强的通用方法。2006年, Geraldo L B Ramalho等在模式识别国际会议上首次以神经网络作为Boosting算法的内核对SAR图像进行海面溢油检测[27], 结果显示Boosting算法增强了神经网络的分类结果。2012年, Topouzelis等首次使用Bagging算法组合多个决策树分类器对溢油和疑似溢油SAR图像样本进行分类, 结果显示Bagging算法增强了决策树单分类器的识别性能[28]。
本研究针对1 448个Envisat/ASAR暗目标样本, 进一步验证AdaBoost算法和Bagging算法对单分类器在SAR图像海面溢油识别上的泛化性能和稳定性能的增强效果, 选择决策树(Decision Tree, DT)作为单分类器内核。同时, 在AdaBoost-DT分类器系统(DT-A)和Bagging-DT分类器系统(DT-B)的基础上, 本研究提出使用Bagging算法组合多个AdaBoost-DT分类器系统(DT-A)构成Bagging-AdaBoost-决策树分类器系统(DT-AB), 以期进一步增强自动识别分类器的检测率、泛化性能和稳定性能。
1 基本方法 1.1 决策树算法决策树是一种树形结构的识别、分类算法。其基本思想是以不纯度为度量指标, 构造一棵不纯度下降最快的树。不纯度是指某树节点上样本多类别的程度。以i(N)表示节点N的“不纯度”, 当节点上的样本属于同一类时, i(N) =0;当节点上的样本类别齐全且数量相当, 则i(N)很大。
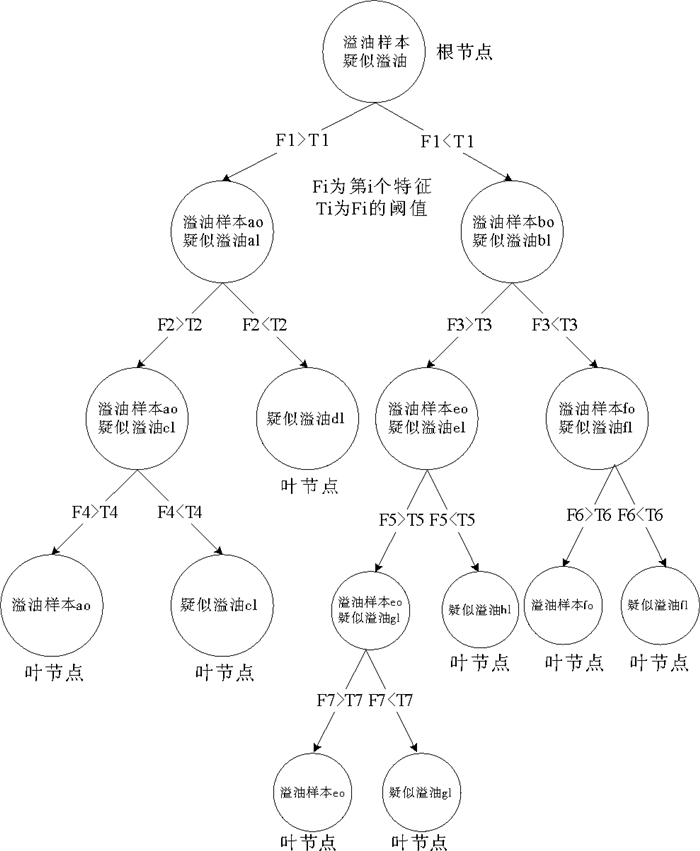
决策树的构造是通过对样本集的学习, 自顶向下建立决策规则(见图 1)。树中每个节点代表某些样本的集合, 每个分叉路径代表某一特征及其阈值对节点进行分裂生长。在每个非叶节点上, 遍历所有特征参数, 找到能使此节点的不纯度下降最大的特征参数及其阈值以进行分裂。以此类推, 直到叶节点处不纯度为0止, 此时每个叶节点中的样本都属于同一类别。

|
图 1 决策树示意图 Fig. 1 The scheme of decision tree |
常用的决策树算法有ID3, ID4, C4.5, C5.0, CART等, 本研究选择opencv函数库中的CART树算法。CART树的不纯度指标为Gini(基尼)不纯度:
| $ i\left( N \right) = \sum\limits_{i \ne j} {P({\omega _j})} = 1 - \sum\limits_j {{P^2}} 。$ | (1) |
其中:i, j为类的编号; P(ωj)是节点N处属于ωj类的样本数占总样本数的频度。
在决策树构造过程中, 如果树分支停止太晚, 决策树的泛化性能将较差, 被称为“过拟合”。相反, 如果树分支停止太早, 将导致分类性能较差, 被称为“欠拟合”。为解决“过拟合”问题, 有交叉验证、不纯度下降差门限、节点样本数门限以及剪枝等方法可供选择[22-23, 31, 66]。本研究同时使用opencv函数库中提供的交叉验证和剪枝方法。
1.2 AdaBoost算法AdaBoost是Adaptive Boosting(自适应增强)算法的缩写, 它是一种分类器的自适应增强算法。AdaBoost算法的基础是1990年Schapire构造的Boosting算法[40], 经Freund和Schapire对Boosting算法的改进[41-42], 解决了原Boosting算法中需要依靠弱学习器先验知识的限制, 最终形成了AdaBoost算法。AdaBoost算法的基本思想是:针对同一个训练样本集, 并选定某单分类器, 例如决策树, 通过调整样本权重, 训练一系列不同的分类器, 进而组合成一个分类器系统。调整样本权重的规则是提高分类错误样本的权重, 降低分类正确样本的权重。其目的是训练下一个分类器时, 更加关注上一个分类器错分的样本。如此迭代训练, 构建一系列单分类器, 直到足够小的分类错误率为止。AdaBoost算法目前已成为一族算法, 具有多个变种, 其中包括Discrete AdaBoost、Real AdaBoost、Logit Boost、Gentle AdBoost等。本研究表明, Gentle AdBoost算法对SAR溢油检测效果是较好的。本研究使用opencv函数库提供的Gentle AdaBoost算法。
Gentle AdaBoost的具体步骤如下:
第一步:定义权重分布空间。
| $ {D_m} = ({\omega _{m,1}},{\omega _{m,2}},{\omega _{m,3}}, \ldots \ldots {\omega _{m,i}} \ldots \ldots ,{\omega _{m,N}})。$ | (2) |
其中:m为迭代轮数, 即单分类器的个数; i为训练样本编号, i=1, 2, …N; 为m轮迭代时第i个样本的权重。
第二步:初始化权重空间。因为有N个训练样本, 因此每个训练样本的初始权重为1/N。首先训练第一个单分类器, 即迭代轮数为1, 因此权重分布空间为:
| $ \begin{array}{l} {D_1} = \left( {{\omega _{1,1}},{\omega _{1,2}},{\omega _{1,3}}, \ldots \ldots {\omega _{1,i}}, \ldots \ldots ,{\omega _{1,N}}} \right) = \\ (\frac{1}{N},\frac{1}{N},\frac{1}{N}, \ldots \ldots \frac{1}{N}, \ldots \ldots ,\frac{1}{N})。\end{array} $ | (3) |
第三步:进行多次迭代, 训练系列单分类器。
(1) 使用具有权重分布的训练样本集训练出第m个单分类器Gm(x)的回归函数fm(x), 其中fm(x)值域为[-1, 1], |fm(x)|反映了样本被分为某类的置信度, 其符号为分类器输出的类别, 即Gm(x)=sign(fm(x))。
(2) 更新权重分布空间, 从Dm更新至Dm+1:
| $ {\omega _{m + 1,i}} = {\omega _{m,i}}{\rm{exp}}( - {y_i}{f_m}({x_i}))。$ | (4) |
其中:是第m个分类器对某样本xi的回归函数值。yi是xi样本的真实值。此公式表明, 对于分类错误的样本, 其权重被增加, 且被错分样本的置信度越高其权重被增加越多。
规一化以使样本总权重为1, 即:
| $ \sum\nolimits_{i = 1}^M {{\omega _{m + 1,i}}} = 1 。$ | (5) |
第四步:组合各单分类器, 形成一个强分类器系统, 其回归函数由M个单分类器的回归函数之和求得。
| $ f\left( x \right) = \sum\nolimits_{m = 1}^M {{f_m}\left( x \right)}。$ | (6) |
其中, M是单分类器的系列总数。Gentle AdaBoost分类器系统的分类结果由下式描述:
| $ G\left( x \right) = {\rm{sign}}\left( {f\left( x \right)} \right) = {\rm{sign}}(\sum\nolimits_{m = 1}^M {{f_m}\left( x \right)} )。$ | (7) |
Bagging算法的名称源自bootstrap aggregation(自助聚集), 是一种组合系列同类型分类器构成一个强分类器系统的自助聚集算法。其基本思想是从个数为N的训练样本集中随机且有放回的抽取个数为n(n(N)的训练样本以形成一系列独立的自助数据集[30]。每个独立自助数据集训练一个选定类型的的分类器, 例如决策树。这一系列独立决策树分类器的分类结果的平均值被取为Bagging决策树分类器系统的最终分类结果。选定的分类器被称为Bagging分类器系统中的分量分类器。
研究表明[44, 50-51, 54-58], 当自助数据集的样本数n与训练样本集的样本数N相等时, 由于其随机且有放回的样本抽取方式, 某些样本可能被多次抽取, 某些样本可能从不被抽取, 而每个自助数据集中无重复的有效样本的概率为训练样本集总数N的63.2%, 许多研究均采用这种抽取方式。另一些研究者使用了不同的抽取方式, 包括按比例抽样[59]、无放回抽样[60-62, 65]、交叉验证抽样[61-62]、先验概率抽样[63]、EBBag抽样[64-65]、under-sampling和over-sampling抽样[64]等。对于SAR图像海面溢油自动识别系统, SAR观测到的海面油膜和疑似油膜的样本数是不平衡的, 即油膜样本往往远少于疑似油膜样本。我们希望保持各自助数据集中两种样本数比例为训练样本集中的原比例, 因此本研究使用按比例, 无放回抽样。
Bagging算法的关键问题是训练多少个分量分类器是最佳的。许多研究表明[48, 50-53], 并非分量分类器越多, Bagging系统的性能越好。许多研究者通过测试实验来确定Bagging系统中分量分类器的个数[29, 44-49]。本研究表明, 分量分类器过少, Bagging分类器系统的性能欠佳; 分量分类器过多, 会导致计算量过大而Bagging分类器系统的性能并无提高。
Bagging算法不仅是一个强分类器系统, 同时亦是一个稳定性系统[30]。这是因为Bagging分类器系统中的每个分量分类器都是使用不同的独立自助数据集训练而得, 因而组合的Bagging分类器系统得以适应各种样本特征空间分布情况, 并对不连续处作了平均化处理[30-31]。
2 数据与特征参数本文使用的1 448个SAR图像海面暗目标样本集源自65幅Envisat/ASAR精处理和宽刈幅图像, 其中包括10幅2011中国渤海蓬莱19-3油田溢油事故期间的数据。暗目标样本由Zeng[33]等研发的自适应阈值分割算法和软件提供。经人工经验判读, 其中溢油样本564个, 疑似溢油样本884个。
对每个暗目标样本提取68个特征, 其中包括14个几何特征、15个灰度特征、39个纹理特征(包括24个灰度共生矩阵特征和15个灰度梯度共生矩阵特征)。表 1给出68个特征名称、分类和特征计算公式的参考文献[34-39, 43]。
|
|
表 1 特征参数列表 Table 1 Features list |
本研究建立了四个分类器和分类器系统, 分别是决策树(DT)、AdaBoost-决策树(DT-A)、Bagging-决策树(DT-B)和Bagging-AdaBoost-决策树(DT-AB), 并通过实验测试它们的检测率、泛化性能和稳定性能, 以验证DT-A、DT-B分类器系统对于DT单分类器在海面溢油自动识别上的增强效果, 并证明本文提出的DT-AB分类器系统的优良性能和应用前景。
下面, 首先介绍检测率、错检率和识别率的基本概念; 其次通过测试实验确定DT-B和DT-AB分类器系统中分量分类器的个数。最后分别测试DT, DT-A, DT-B和DT-AB的性能并作比较分析。
3.1 检测率、错检率和识别率检测率, 错检率和识别率是模式识别的3个重要指标。识别率是描述整个样本集内所有类别样本正确分类的比值, 检测率是描述特定样本正确分类的比值, 而错检率是描述特定样本被错误分类的比值。在本研究中, 关心的是海面溢油样本的正确识别以及海面疑似溢油的误判, 并不关心海面疑似溢油的正确识别。因此, 高检测率和低错检率是SAR海面溢油自动识别业务化系统所追求的。
检测率、错检率和识别率的计算公式及相关符号说明为下:
| 人工判定类别 | |||
| 溢油(Y=Yy+Yn) | 疑似溢油(N=Ny+Nn) | ||
| 分类器判定类别 | 溢油(y=Yy+Ny) | Yy | Ny |
| 疑似溢油(n=Yn+Nn) | Yn | Nn | |
检测率=Yy/(Yy+Yn);
错检率=Ny/(Yy+Ny);
识别率=(Yy+Nn)/(Yy+Ny+Yn+Nn);
其中, 检测率是分类器正确判别的溢油样本数(Yy)与人工判别的溢油样本数(Y)的比值; 错检率是分类器将人工判别为疑似溢油样本误判为溢油样本数(Ny)与分类器判别的溢油样本数(y)的比值; 识别率是分类器正确判别的样本数(Yy+Nn)与测试样本集总数的比值。
3.2 Bagging分类器系统中分量分类器个数的选择如前所述, 在测试两个Bagging分类器系统(DT-B和DT-AB)的检测率、泛化性能和稳定性能之前, 需要通过测试实验来确定分量分类器的个数。
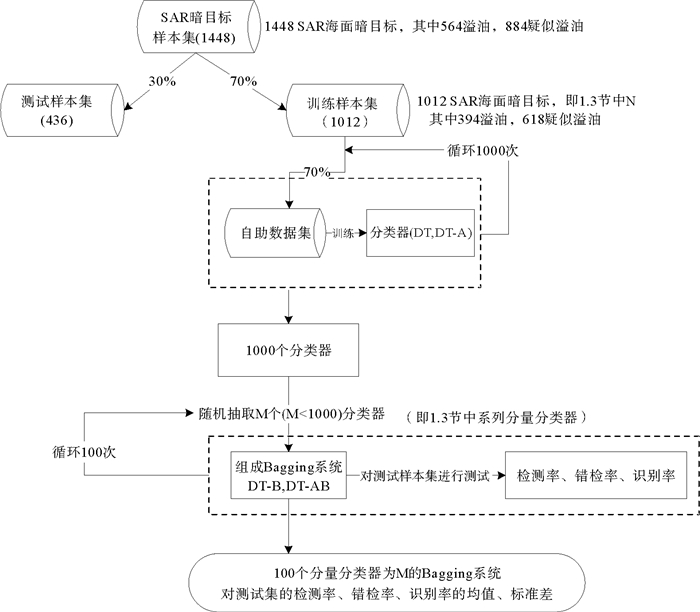
测试实验流程如图 2所示:

|
图 2 Bagging系统中分量分类器个数选择实验流程图 Fig. 2 The flow chart of the experiment that was used to test how many numbers component classifiers should be select |
首先在1 448个SAR海面暗目标样本集中按溢油/疑似溢油样本比例随机抽取70%的样本作为训练样本集, 剩余样本作为测试样本集。然后从训练样本集中按同样比例随机抽取70%的样本作为独立的自助数据集, 并训练出一个决策树(DT)分类器和以决策树为内核的AdaBoost(DT-A)分类器系统。这个过程循环1 000次, 即用1 000个独立的自助数据集分别训练出1 000个DT和DT-AB。
从训练好的1 000个分类器中随机抽取M(M=1~300)个分类器组成Bagging系统, 并对测试样本集进行测试, 得到相应的检测率、错检率、识别率。将这个过程循环100次, 得到100个分量分类器为M的Bagging系统, 同样对测试样本集进行测试, 得到100个相应的检测率, 错检率, 识别率。这100个独立分类器系统相应的检测率、错检率和识别率的均值和标准差即为分量分类器为M的Bagging分类器系统(DT-B、DT-AB)的分类结果。
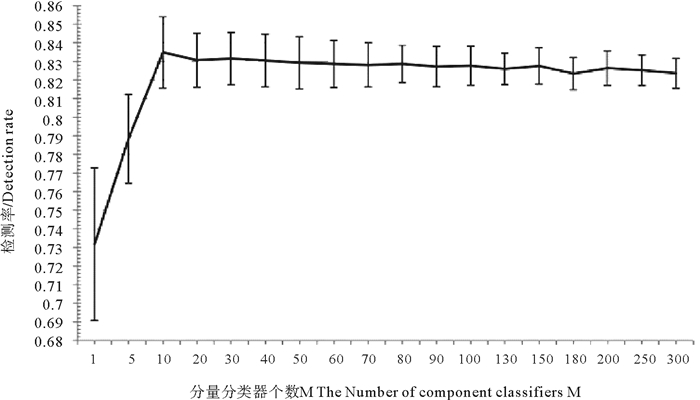
图 3为DT-B在不同个数分量分类器下的检测率及标准差。可以看出, 当分量分类器个数M达到10时, 分类器系统的检测率均值达到最大。随着M的增加, 检测率均值呈降低趋势, 标准差呈变小趋势。当M=130时, 标准差趋于稳定, 因此选择DT-B分类器系统的分量分类器个数M=130。

|
(检测率的标准差表示为竖线线段) (The standard deviations of detection rate are expressed as vertical bar lines) 图 3 DT-B在不同个数分量分类器下的检测率及标准差 Fig. 3 The mean value and standard deviation of DT-B's detection rate with different numbers of component classifiers |
图 4为DT-AB在不同个数分量分类器下的检测率及标准差。可以看出, 当分量分类器个数M到10时, 分类器系统的检测率均值达到最大。随着M的增加, 检测率均值呈降低趋势, 当M=50时, DT-AB检测率均值趋于稳定, 标准差均值仍呈变小趋势。综合考虑分类性能和计算效率两方面, 选择DT-AB分类器系统的分量分类器个数M=150。

|
(检测率的标准差表示为竖线线段) (The standard deviations of detection rate are expressed as vertical bar lines) 图 4 DT-AB在不同个数分量分类器下的检测率及标准差 Fig. 4 The mean value and standard deviation of DT-AB's detection rate with different numbers of component classifiers |
对比图 3和4, 可以看到, DT-AB分类器系统在检测率和标准差两方面均优于DT-B分类器系统。
3.3 泛化性能泛化性能是描述分类器或分类器系统的普适性指标。常用的泛化性能测试方法有交叉验证法和自抽样法。本研究选择自抽样法(Booststrapping)对四种分类器或分类器系统(DT、DT-A、DT-B以及DT-AB)的泛化性能进行测试。自抽样法每次从样本集中抽取一部分样本训练分类器, 而后对剩余样本进行测试。这样做N次, 最后获取检测率、错检率和识别率的均值, 作为泛化性能的衡量标准。
设计的实验流程如图 5所示。

|
图 5 泛化能力测试实验流程图 Fig. 5 The flow chart of the experiment that was used to test generalization performance |
首先从样本集中按溢油/疑似溢油样本比例随机抽取70%的样本作为训练样本集, 剩余30%样本作为测试样本集。用训练样本集训练出DT、DT-A、DT-B、DT-AB四种分类器或分类器系统。然后分别使用四种分类器或分类器系统对相应的测试集进行测试, 得到各自的检测率、错检率、识别率。重复以上步骤100次, 得到四种分类器或分类器系统各100个检测率、错检率、识别率, 其中每次从样本集中随机抽取70%的样本作为训练样本集的过程即为自抽样法(Booststrapping)的概念。各100个检测率、错检率、识别率的均值和标准差即为评价DT、DT-A、DT-B和DT-AB泛化性能的指标。
实验结果如表 2所示。可以看出, DT-A和DT-B的检测率、错检率和识别率均优于DT, 这说明AdaBoost算法(DT-A)与Bagging算法(DT-B)确实提高了决策树单分类器的检测率和泛化性能, DT-A略优于DT-B。尤其, 以DT-A分类器系统为分量分类器的Bagging系统DT-AB的检测率和识别率最高而错检率最低, 说明其泛化性能最佳。
|
|
表 2 泛化能力测试实验结果 Table 2 The test result of generalization performance |
Breiman提出[30], 如果一个分类器因训练集样本的较小改变而导致分类器性能的显著改变, 则这种分类器被认为是“不稳定”(Unstable)的。
Bagging算法对分类器稳定性能的提高需通过实验进行测试。测试过程需满足训练集样本的较小改变这一条件。需要获得一系列由略有差别的训练集训练出的某种分类器或分类器系统, 进而得到它们对相同测试集的检测率、错检率和识别率的均值、标准差。以标准差作为稳定性的评价指标, 标准差越小, 表明稳定性能越好。
设计的实验流程如图 6所示。

|
图 6 稳定性能测试实验流程图 Fig. 6 The flow chart of the experiment that was used to test stability performance |
首先从训练样本集中按溢油/疑似溢油样本比例随机抽取80%的样本组成微调训练集, 并训练出DT、DT-A、DT-B(130个分量分类器)和DT-AB(150个分量分类器)四种分类器或分类器系统。然后分别使用DT、DT-A、DT-B和DT-AB对测试样本集进行测试, 得到各自的检测率、错检率、识别率。重复以上步骤100次, 得到四种分类器各100个检测率、错检率、识别率。最后, 计算各100个检测率、错检率、识别率的均值和标准差, 以标准差作为分类器稳定性能的指标。
实验结果如表 3所示。可以看出, DT-A和DT-B的检测率、错检率和识别率的标准差均低于DT, 这说明Bagging算法和AdaBoost算法不仅提高了决策树单分类器的检测率和泛化性能, 同时提高了稳定性能, DT-B的标准差略低于DT-A的标准差。尤其, DT-AB分类器系统的标准差最小, 说明DT-AB分类器系统不仅泛化性能最佳, 其稳定性能亦最佳。
|
|
表 3 稳定性能测试实验结果 Table 3 The test result of stability performance |
近年一些重大的海上溢油事故引起广泛重视, 从而利用卫星SAR图像自动监测海面溢油成为SAR数据海洋应用的热点之一。
目前应用于SAR海面溢油检测的分类器大多为单分类器, 其检测率往往难以达到要求。本研究引入AdaBoost算法和Bagging算法, 采用决策树(DT)单分类器为其内核, 形成两种分类器系统DT-A和DT-B。进而提出以DT-A为内核的Bagging分类器系统DT-AB。对1 448个Envisat/ASAR(C-Band)海面溢油和疑似溢油样本集进行分类实验。结果表明:(1)AdaBoost算法和Bagging算法可以明显增强单分类器的分类性能、泛化性能和稳定性能。(2)本研究首次提出的DT-AB分类器系统的分类性能、泛化性能和稳定性能优于DT-A和DT-B。因此, DT-AB分类器系统用于卫星SAR海面溢油自动识别业务化应用方面具有前景。
本研究对不同时空覆盖的Envisat/ASAR(C-Band)样本集以及不同卫星不同波段的COSMO-SkyMed SAR(X-Band)样本集进行了同样的实验, 结果与上述一致。
需要说明的是, 上述用于实验的样本集中, 海面溢油样本数与疑似溢油样本数的比例在1:5左右。而实际应用中, 一幅SAR图像中的海面溢油样本数与疑似溢油样本数的比例往往达到1:100甚至更大。这种样本不平衡问题是模式识别中的难点之一。在项目研究方案中采用一个新的自适应阈值分割算法先行解决严重的不平衡问题。
今后, 将针对样本集深入研究海面溢油和疑似溢油的特征参数。
致谢 感谢中海油项目“海上溢油卫星自动识别和预警业务化系统研发”对本研究的资助以及项目课题组师生对本研究的有益讨论和帮助。感谢ESA-MOST Dargon3 ID10580 Project提供Envisat/ASAR卫星图像。
| [1] |
Brekke C, Solberg A H S. Oil spill detection by satellite remote sensing[J]. Remote Sensing of Environment, 2005, 1: 1-13.
(  0) 0) |
| [2] |
Solberg A H S, Solberg R.A large-scale evaluation of features for automatic detection of oil spills in ERS SAR images[C].International Geoscience and Remote Sensing Symposium: IEEE, 1996: 1484-1486.
(  0) 0) |
| [3] |
Konstantinos N, Topouzelis. Oil Spill Detection by SAR Images:Dark Formation Detection, Feature Extraction and Classification Algorithms[J]. Sensors, 2008, 10: 6642-6659.
(  0) 0) |
| [4] |
Solberg A H S, Volden E.Incorporation of Prior Knowledge in Automatic Classification of Oil Spills in ERS SAR Images[C].International Geoscience and Remote Sensing Symposium: IEEE, 1997: 157-159.
(  0) 0) |
| [5] |
Solberg A H S, Storvik G, Solberg R, et al. Automatic detection of oil spills in ERS SAR images[J]. IEEE Transactions on Geoscience and Remote Sensing, 1999, 37(4): 1916-1924. DOI:10.1109/36.774704
(  0) 0) |
| [6] |
Solberg A H S, Dokken S T, Solberg R.Automatic detection of oil spills in Envisat, Radarsat and ERS SAR images[C].International Geoscience and Remote Sensing Symposium: IEEE, 2003.
(  0) 0) |
| [7] |
Solberg A H S, Brekke C, Husøy P. Oil spill detection in Radarsat and Envisat SAR images[J]. IEEE Transactions on Geoscience and Remote Sensing, 2007, 45(3): 746-755. DOI:10.1109/TGRS.2006.887019
(  0) 0) |
| [8] |
Fiscella B, Nirchio F, Pavese P, et al. Oil spill detection using marine SAR images[J]. International Journal of Remote Sensing, 2000, 21(18): 3561-3566. DOI:10.1080/014311600750037589
(  0) 0) |
| [9] |
Nirchio F, Di Tomaso S, Biamino W, et al.Oil spills automatic detection from SAR images[C].Envisat and ERS Symposium: IEEE, 2004.
(  0) 0) |
| [10] |
Nirchio F, Sorgente M, Giancaspro A, et al. Automatic detection of oil spills from SAR images[J]. International Journal of Remote Sensing, 2005, 26(6): 1157-1174. DOI:10.1080/01431160512331326558
(  0) 0) |
| [11] |
Brekke C, Solberg A H S. Classifiers and confidence estimation for oil spill detection in ENVISAT ASAR images[J]. Geoscience and Remote Sensing Letters, 2008, 5: 65-69. DOI:10.1109/LGRS.2007.907174
(  0) 0) |
| [12] |
Aires F, Prigent C, Rossow W B. Neural network uncertainty assessment using Bayesian statistics:A remote sensing application[J]. Neural Computation, 2004, 16(11): 2415-58. DOI:10.1162/0899766041941925
(  0) 0) |
| [13] |
Del Frate F, Petrocchi A, Lichtenegger J, et al. Neural networks for oil spill detection using ERS-SAR data[J]. IEEE Transactions on Geoscience & Remote Sensing, 2000, 38(5): 2282-2287.
(  0) 0) |
| [14] |
Topouzelis K, Karathanassi V, Pavlakis P, et al.Oil Spill Detection Using RBF Neural Networks and SAR Data[C].Journal of Photogrammetry and Remote Sensing Congress: IEEE, 2004.
(  0) 0) |
| [15] |
Topouzelis K, Karathanassi V, Pavlakis P, et al. Detection and discrimination between oil spills and look-alike phenomena through neural networks[J]. Journal of Photogrammetry and Remote Sensing (ISPRS), 2007, 62: 264-270. DOI:10.1016/j.isprsjprs.2007.05.003
(  0) 0) |
| [16] |
Topouzelis K, Stathakis D, Karathanassi V. Investigation of genetic algorithms contribution to feature selection for oil spill detection[J]. International Journal of Remote Sensing, 2009, 30: 611-625. DOI:10.1080/01431160802339456
(  0) 0) |
| [17] |
Singha S, Bellerby T J, Trieschmann O.Detection and classification of oil spill and look-alike spots from SAR imagery using an Artificial Neural Network[C].Geoscience and Remote Sensing Symposium: IEEE, 2012: 5630-5633.
(  0) 0) |
| [18] |
Singha S, Bellerby T J, Trieschmann O. Satellite oil spill detection using artificial neural networks[J]. IEEE Journal of Selected Topics in Applied Earth Observations and Remote Sensing, 2013, 6: 2355-2363. DOI:10.1109/JSTARS.2013.2251864
(  0) 0) |
| [19] |
Keramitsogloua I, Cartalisa C, Chris T Kiranoudisb. Automatic identification of oil spills on satellite images[J]. Environmental Modelling and Software, 2006, 21(5): 640-652. DOI:10.1016/j.envsoft.2004.11.010
(  0) 0) |
| [20] |
Karathanassi V, Topouzelis K, Pavlakis P, et al. An object‐oriented methodology to detect oil spills[J]. International Journal of Remote Sensing, 2006, 27: 5235-5251. DOI:10.1080/01431160600693575
(  0) 0) |
| [21] |
Kubat M, Robert C Holte, Stan Matwin. Machine Learning for the Detection of Oil Spills in Satellite Radar Images[J]. Machine Learning, 1998, 30: 195-215. DOI:10.1023/A:1007452223027
(  0) 0) |
| [22] |
Singha S, Vespe M, Trieschmann O. Automatic Synthetic Aperture Radar based oil spill detection and performance estimation via a semi-automatic operational service benchmark[J]. Marine pollution bulletin, 2013, 73: 199-209. DOI:10.1016/j.marpolbul.2013.05.022
(  0) 0) |
| [23] |
Mera D, Cotos J M, Varela P J, et al. Automatic decision support system based on SAR data for oil spill detection[J]. Computers & Geosciences, 2014, 72: 184-191.
(  0) 0) |
| [24] |
Schapire R E. The Strength of Weak Learnability[J]. Machine Learning, 1990, 5: 197-227.
(  0) 0) |
| [25] |
Freund Y, Schapire R E. A Decision-Theoretic Generalization of On-Line Learning and an Application to Boosting[J]. Journal of Computer & System Sciences, 1997, 55(1): 119-139.
(  0) 0) |
| [26] |
Freund Y. Boosting a weak Learning Algorithm by Majority[J]. Information and Computation, 1995, 121(2): 256-285. DOI:10.1006/inco.1995.1136
(  0) 0) |
| [27] |
Ramalho G L B, Medeiros F N S D. Using Boosting to Improve Oil Spill Detection in SAR Images[J]. Pattern Recognition international Conference, 2006, 2: 1066-1069.
(  0) 0) |
| [28] |
Topouzelis K, Psyllos A. Oil spill feature selection and classification using decision tree forest on SAR image data[J]. ISPRS Journal of Photogrammetry and Remote Sensing, 2012, 68: 135-143. DOI:10.1016/j.isprsjprs.2012.01.005
(  0) 0) |
| [29] |
Breiman L. Bagging predictors[J]. Machine Learning, 1996, 24: 123-140.
(  0) 0) |
| [30] |
RichardO D, PeterE H, DavidG Stock. 模式分类[M]. 北京: 机械工业出版社, 2003. Richard O D, Peter E H, David G Stock. Pattern Classification[M]. Beijing: Machine Press, 2003. (  0) 0) |
| [31] |
刘朋.SAR海面溢油检测与识别方法研究[D].青岛: 中国海洋大学, 2012. Liu P.Research on Ocean Oil Spill Detection and Recognition Using SAR Data[D].Qingdao: Ocean University of China, 2012. (  0) 0) |
| [32] |
Zeng K, Ma Y, Ding X, et al.An adaptive threshod segmentation algorithm to extract dark targets from SAR images[C].Geoscience and Remote Sensing Symposium: IEEE, 2014: 1765-1768.
(  0) 0) |
| [33] |
Hu M K. Visual pattern recognition by moment invariants[J]. Information Theory Ire Transactions on, 1962, 8(2): 179-187. DOI:10.1109/TIT.1962.1057692
(  0) 0) |
| [34] |
Haralick R M, Shanmugam K, Dinstein I. Textural Features for Image Classification[J]. IEEE Transactions on Systems Man & Cybernetics, 1973, 3(6): 610-621.
(  0) 0) |
| [35] |
Clausi D A. An analysis of co-occurrence texture statistics as a function of grey level quantization[J]. Canadian Journal of Remote Sensing Journal Canadien De Télédétection, 2014, 28(1): 45-62.
(  0) 0) |
| [36] |
Broek E L V D, Rikxoort E M V.Parallel-sequential Texture Analysis[C].Proceedings of the Third international conference on Pattern Recognition and Image Analysis: Springer, 2005: 532-541.
(  0) 0) |
| [37] |
Haralick R M. Statistical and structural approaches to texture[J]. Proceedings of the IEEE, 1979, 67: 786-804. DOI:10.1109/PROC.1979.11328
(  0) 0) |
| [38] |
洪继光. 灰度-梯度共生矩阵纹理分析方法[J]. 自动化学报, 1984(01): 22-25. Hong Jiguang. Gray Level-Gradient Cooccurrence Matrix Texture Analysis Method[J]. ACTA Automatica Sinica, 1984(01): 22-25. (  0) 0) |
| [39] |
Schapire R E. The Strength of Weak Learnability[J]. Machine Learning, 1990, 5: 197-227.
(  0) 0) |
| [40] |
Freund Y. Boosting a weak Learning Algorithm by Majority[J]. Information and Computation, 1995, 121(2): 256-285. DOI:10.1006/inco.1995.1136
(  0) 0) |
| [41] |
Freund Y, Schapire R E. A decisiontheoretic generalization of on-fine learning and an application to boosting[J]. Journal of Computer & System Sciences, 1997, 55(1): 119-139.
(  0) 0) |
| [42] |
Ma Y, Zeng K, Zhao C, et al.Feature Selection and Classification of Oil Spills in SAR Image Based on Statistics and Artificial Neural Network[C].International Geoscience and Remote Sensing Symposium: IEEE, 2014.
(  0) 0) |
| [43] |
李毓, 徐成贤. 修剪Bagging集成的方法及其应用[J]. 系统工程理论与实践, 2008(07): 105-110. Li Y, Xu C. A method for pruning Bagging ensembles and its applications[J]. Systems Engineering TheoryPractice, 2008(07): 105-110. DOI:10.3321/j.issn:1000-6788.2008.07.014 (  0) 0) |
| [44] |
Pekalska E, Skurichina M, Duin R P W.Combining Fisher Linear Discriminants for Dissimilarity Representations[C].International Workshop on Multiple Classifier Systems: Springer Verlag, 2000: 117-126.
(  0) 0) |
| [45] |
Furlanello C, Merle S.Boosting of Tree-Based Classifiers for Predictive Risk Modeling in GIS[C].International Workshop on Multiple Classifier Systems: Springer Berlin Heidelberg, 2000: 220-229.
(  0) 0) |
| [46] |
Quinlan J R.Bagging, Boosting and C4.5[C].Thirteenth National Conference on Artificial Intelligence: IEEE, 1996: 725-730.
(  0) 0) |
| [47] |
Latinne P, Debeir O, Decaestecker C.Limiting the Number of Trees in Random Forests[C].International Workshop on Multiple Classifier Systems: Springer Berlin Heidelberg, 2001: 178-187.
(  0) 0) |
| [48] |
Wang G W, Zhang C X, Guo G. Investigating the Effect of Randomly Selected Feature Subsets on Bagging and Boosting[J]. Communications in Statistics Simulation and Computation, 2015, 44(3): 636-646. DOI:10.1080/03610918.2013.788705
(  0) 0) |
| [49] |
Adhvaryu P S, Panchal Mahesh P. A Review on Diverse Ensemble methods for Classification[J]. Journal of Computer Engineering, 2012, 1(4): 27-32.
(  0) 0) |
| [50] |
Ye R, Suganthan P N.Empirical Comparison of Bagging-based Ensemble Classifiers[C].International Conference on: Information Fusion, 2012: 917-924.
(  0) 0) |
| [51] |
Tian J, Li M, Chen F, et al. Coevolutionary learning of neural network ensemble for complex classification tasks[J]. Pattern Recognition, 2012, 45(4): 1373-1385. DOI:10.1016/j.patcog.2011.09.012
(  0) 0) |
| [52] |
蒋芸, 陈娜, 明利特, 等. 基于Bagging的概率神经网络集成分类算法[J]. 计算机科学, 2013, 40(5): 242-246. Jiang Y, Chen N, Ming L, et al. Bagging-based Probabilistic Neural Network Ensemble Classification Algorithm[J]. Computer Science, 2013, 40(5): 242-246. DOI:10.3969/j.issn.1002-137X.2013.05.057 (  0) 0) |
| [53] |
Ramakrishnan S, Mirzaei M, Bekri M. Corporate Default Prediction with AdaBoost and Bagging Classifiers[J]. Journal Teknologi, 2015, 73(2): 45-50.
(  0) 0) |
| [54] |
Ashtawy H M, Mahapatra N R. BgN-Score and BsN-Score:Bagging and boosting based ensemble neural networks scoring functions for accurate binding affinity prediction of protein-ligand complexes[J]. Bmc Bioinformatics, 2015, 16(4): 1471-1483.
(  0) 0) |
| [55] |
Latinne P, Debeir O, Decaestecker C.Different Ways of Weakening Decision Trees and Their Impact on Classification Accuracy of dt Combination[C].International Workshop Multiple Classifier Systems: Springer Berlin Heidelberg, 2000: 200-209.
(  0) 0) |
| [56] |
Skurichina M, Duin R P W. Bagging and the Random Subspace Method for Redundant Feature Spaces[J]. Lecture Notes in Computer Science, 2001, 2096: 1-10. DOI:10.1007/3-540-48219-9
(  0) 0) |
| [57] |
Briem G J, Benediktsson J A, Sveinsson J R.Boosting, Bagging, and Consensus Based Classification of Multisource Remote Sensing Data[C].International Workshop Multiple Classifier Systems: Springer Berlin Heidelberg, 2001: 279-288.
(  0) 0) |
| [58] |
Aydomu H Y, Ekinci A, Erdal H, Erdal H. Optimizing the monthly crude oil price forecasting accuracy via bagging ensemble models[J]. Journal of Economics & International Finance, 2015, 7(5): 127-136.
(  0) 0) |
| [59] |
Aich S, Lee Y C, Lee C W.Probabilistic Contour Mapping Using Oriented Gradient Features and SVM-bagging[C].Frontiers of Computer Vision: IEEE, 2015: 1-5.
(  0) 0) |
| [60] |
Sharkey A J C, Sharkey N E, Gerecke U, et al.The "Test and Select" Approach to Ensemble Combination[C].International Workshop on Multiple Classifier Systems: Springer Berlin Heidelberg, 2000: 30-44.
(  0) 0) |
| [61] |
Dietterich T G.Ensemble Methods in Machine Learning[C].International Workshop on Multiple Classifier Systems: Springer Berlin Heidelberg, 2000: 1-15.
(  0) 0) |
| [62] |
Alkoot F M, Kittler J.Improving Product by Moderating k-NN Classifiers[C].International Workshop on Multiple Classifier Systems: Springer Verlag, 2001: 429-439.
(  0) 0) |
| [63] |
Baszczynski J, Stefanowski J. Neighbourhood sampling in bagging for imbalanced data[J]. Neurocomputing, 2015, 150: 529-542. DOI:10.1016/j.neucom.2014.07.064
(  0) 0) |
| [64] |
Razzaghi T, Xanthopoulos P, Seref O. Constraint relaxation, cost-sensitive learning and bagging for imbalanced classification problems with outliers[J]. Optimization Letters, 2015, 1: 1-14.
(  0) 0) |
| [65] |
Gary Bradski, Adrian Kaebler. Learning OpenCV[M]. Beijing: Tsinghua University Press, 2009.
(  0) 0) |
 2018, Vol. 48


