2. 青岛海洋科技中心 海洋生态与环境科学功能实验室,山东 青岛 266237;
3. 中国海洋大学 海洋化学研究所,山东 青岛 266100
二甲基硫(Dimethylsulfide,DMS)在全球硫循环中起着重要作用。DMS在海水表层含量丰富,可以通过特定的氧化产物进入大气并改变气候和环境,据估算每年约有28.1(17.6~34.4) Tg由DMS转化并进入大气[1],占海洋硫释放量的90%以上[2]。研究表明,DMS通过海-气交换进入大气后会被空气中的羟基(·OH)、硝酸基(·NO3)和氧化碘基(·IO)等活性自由基氧化生成硫酸(H2SO4)和甲磺酸(MSA),促进云凝结核(CCN)生成,继而改变云层的物理特性,提高地球的反照率,对全球气候升温产生负反馈作用[3]。DMS在调节气候方面的作用存在争议,有人认为在受人为活动影响显著的区域,DMS对气候调节的作用被高估[4],但在受人类活动影响较弱的地域,DMS的气候调节作用不可忽视[5]。海洋中的DMS主要由浮游植物产生,90%以上的DMS来自浮游植物产生的二甲基巯基丙酸内盐(Dimethylsulfoniopropionate,DMSP)降解产生,DMSP是参与海洋硫循环的重要物质。DMSP主要由浮游植物、大型海藻、被子植物和珊瑚产生[6]。DMSP对浮游植物至关重要,研究发现,DMSP由浮游植物细胞合成以维持细胞内外渗透压[7-8],另外,DMSP还有防冻剂和抗氧化剂的作用。在一些特定环境中,浮游植物不会将DMSP转化为DMS,而是进行反应生成甲硫醇(MeSH)作为硫源参与植物体内的氨基酸合成[9]。DMS的光化学氧化过程是海洋中DMS重要的去除途径,该过程受多种环境因素影响,主要发生在光谱较全和光辐射强度较高的表层,因此,DMS光化学氧化速率随着水深增加而降低[10]。Hatton等[11]在北海研究发现不同波段下DMS的光化学氧化产物有所差异。Deal等[12]发现DMS的光化学氧化过程具有波长依赖性,不同波段光所具有的光量子产率不同。
南海是西太平洋最大的边缘海,主要位于热带和亚热带,周边有台湾岛、中南半岛、菲律宾群岛、巴拉望岛等。南海北部和西部为边缘海,平均水深小于150 m,南部中央盆地平均水深约为4 000 m[13]。南海通过台湾海峡与东海相连,通过吕宋海峡与太平洋相连,在连接南海和周围海域的所有通道中,海峡口水深大多超过400 m,这种独特的地形使南海具有半封闭性质,这在很大程度上控制了南海区域的海洋动态。南海深度较大,受沿岸上升流、淡水输入、环流以及中尺度涡旋等影响,水温结构复杂[14]。近年来,国内学者对近海生源硫化物的调查大多集中在东海与黄海等陆架海域[15-18],对南海海域有关DMS和DMSP的生物生产及转化、海-气扩散及其影响因素等方面鲜有报道,尤其是在富营养化的沿岸海域和上升流区域[19]。因此本文针对南海海域中生源有机硫的浓度分布与生产转化过程进行深入研究,采集南海海域海水样品,测定了DMS与DMSP的浓度及特定站位的DMS光化学氧化速率,并估算了DMS的海-气通量。研究结果有助于更好地认识我国近海生源硫化物的生物地球循环过程,丰富我国在海洋生源硫循环研究方面的内容。
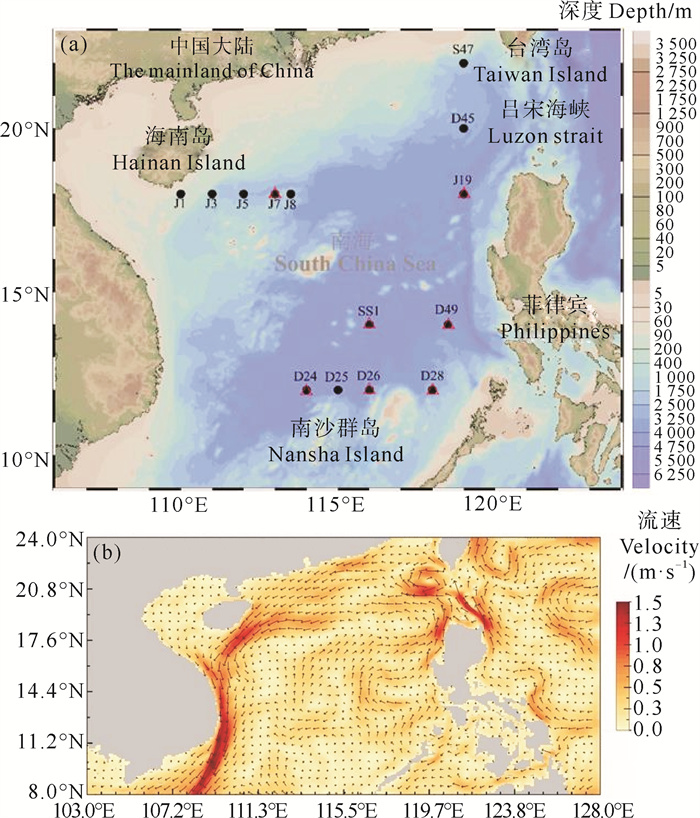
1 材料与方法 1.1 航次简介于2022年11月25日—2023年1月1日搭载“嘉庚号”科考船在南海海域进行调查取样,共包括14个站位和1个断面(见图 1(a))。在所有站位采集表层海水测定DMS和DMSP浓度,研究其水平分布特征。选取J断面(包括J1、J3、J5、J7和J8站位)探究了海南岛陆源输入和浙-闽沿岸流对DMS和DMSP垂直分布的影响,选择7个站位(包括SS1、J7、J19、D24、D26、D28和D49站位)测定了DMS的光化学氧化速率。2022年冬季南海表层环流如图 1(b)所示。平均表层环流数据来自HYCOM.org(HYbrid Coordinate Ocean Model)。
|
( △表示进行DMS光氧化站位。△ represent stations for DMS photochemical oxidation. ) 图 1 2022年冬季南海采样站位图(a)和表层环流图(b) Fig. 1 Locations of sampling stations (a) and surface circulation (b) of the South China Sea in winter, 2022 |
用12 L Niskin采水器采集所有观测站位的海水样品。表层海水样品的采样深度一般在2 m附近。DMS是易挥发痕量气体,采集海水样品时使用与溶解氧相同方法取样[20],用硅胶管从CTD采水器中收集到250 mL棕色玻璃瓶中,在船上实验室现场测定DMS样品。采样瓶和采样管在使用之前均经过10%盐酸酸泡处理。将4 mL海水样品装入5 mL离心管中,加入40 μL 50%的硫酸抑制生物活动,用于测定总DMSP(DMSPt)浓度。对于溶解态DMSP(DMSPd)样品,取4 mL海水样品用内置Whatman GF/F滤膜(0.7 μm,47 mm)的Nalgene过滤器进行重力过滤,舍弃最初几滴滤液,滤液装入5 mL离心管中,加入40 μL 50%的硫酸固定。DMSP样品在4 ℃环境中避光保存,带回实验室后立即测定。
1.3 DMS和DMSP的测定海水中DMS浓度使用冷阱-捕集气相色谱法测定[21]。将5 mL海水样品注入预先酸泡处理的10 mL西林瓶中,并用聚四氟乙烯内衬的铝盖密封。六通阀旋至捕集状态,使用60 mL·min-1的高纯氮气作为载气对样品进行吹扫,载气携带样品经过Nafion干燥管以去除水分,后经六通阀富集在浸泡于液氮中的1/16 Teflon捕集管中。吹扫3 min后,六通阀旋至进样状态,将捕集管放入热水(温度>90 ℃)中解析,解析后的DMS样品由高纯氮气带入配有火焰光度检测器(FPD)的GC-2014气相色谱仪(岛津,日本)测定。DMSP样品使用冷碱处理法[22],DMSPt和DMSPd在强碱条件下会按1∶1转化为DMS,再使用上述DMS的测定方法测定,得到DMSPt和DMSPd浓度。DMSPt减去DMSPd即得到颗粒态DMSP(DMSPp)的浓度。
1.4 叶绿素a(Chl a)、溶解无机碳(DIC)、溶解氧(DO)和营养盐的测定Chl a的测定 现场采集2 L海水,经0.7 μm玻璃纤维滤膜(Whatman GF/F,直径47 mm)过滤,滤膜用10 mL 90%的丙酮在4 ℃、黑暗下萃取24 h;上清液用Trilogy实验室荧光仪(Turner Design,美国)进行测定。该方法最低检出限为0.01 μg·L-1,标准测定采用外标法。
DIC的测定 将海水样品采到250 mL的磨口硬质玻璃瓶采样,溢流,移除1%后加250 μL饱和HgCl2灭活,硅油封口,于室温下避光保存,带回实验室后使用Apollo DIC Analyzer AS-C6L测定。酸化后用N2吹出,用光腔衰荡光谱法测定;标准曲线法定量。
DO的测定 使用溶解气体采样方法,将海水样品置于60 mL的BOD瓶中,加MgCl2和碱性NaI溶液各0.5 mL固定,上下颠倒20次以上,于室温下避光静置,样品恒温到25 ℃后,用分光光度法(466 nm)和光谱仪(SP-722,上海光谱仪器有限公司)测定。
营养盐的测定 取300 mL海水样品经0.7 μm玻璃纤维滤膜(Whatman GF/F,直径47 mm)过滤后,转入60 mL聚四氟乙烯瓶中,放入冰箱冷冻保存。回实验室后,使用营养盐自动分析仪(Seal Analytical Chem. Tray AA3,德国)测定营养盐浓度,NO3--N和SiO3--Si的最低检出限分别为0.06和0.16 μmol·L-1。
Chl a、DIC、DO、营养盐的数据由国家自然科学基金委员会共享航次NORC2022-06(项目批准号:42149906)提供并共享。
1.5 DMS光化学氧化速率的测定现场测定7个站位(包括SS1、J7、J19、D24、D26、D28和D49站位)海水中DMS在不同波段下的光化学氧化速率(kphoto)。将海水样品使用0.22 μm的聚醚砜滤膜在极低压力下(小于0.02 MPa)过滤,以排除海水中原有生物的干扰,且过程轻缓,以避免DMS损失。将过滤后的DMS样品装入石英瓶中并密闭,并分组如下:(1)无滤膜包裹的石英瓶:透过石英瓶的光为全波段光(波长约220~2 500 nm);(2)Mylar-D膜(0.1 mm,龙津膜业科技有限公司)包裹的石英瓶:Mylar-D可过滤UVB波段波长,透过石英瓶的光为可见光(波长约380~880 nm)和UVA波段光(波长约320~400 nm);(3)UF3 Plexiglas膜(0.1 mm,龙津膜业科技有限公司)包裹的石英瓶:UF3 Plexiglas膜可过滤全部UV波段波长,透过石英瓶的光为可见光;(4)铝箔和黑色塑料包裹的石英瓶:石英瓶完全不透光,作为实验的空白组。将各组石英瓶放置在甲板循环海水培养箱以维持恒定温度,分别在0、3和6 h进行取样测定各组DMS浓度。不同波段光DMS的光化学氧化速率为各组DMS浓度变化与时间做线性函数的斜率。
1.6 DMS海-气通量的计算DMS海-气通量采用Nightingale[23]的参数化公式计算:
| $ F=k_{\mathrm{w}}\left(C_{\mathrm{w}}-C_{\mathrm{g}} / \mathrm{H}\right) \text { 。} $ |
式中:F是指DMS的海-气通量(μmol·m-2·d-1);kw为气体转移速率的动力学因子(m·d-1);Cw和Cg分别代表表层海水和大气中的DMS浓度(nmol·L-1);H是亨利定律常数。由于之前的研究已经报道了Cg相对于Cw一般可以忽略不计[24-25],因此公式简化为:
| $ \begin{gathered} F=k_{\mathrm{w}} C_{\mathrm{w}}, \\ k_{\mathrm{w}}=\left(0.22 U^2+0.33 U\right)(\mathrm{Sc} / 660)^{-1 / 2}, \\ \mathrm{Sc}(t)=2\;674.0-147.12 t+3.726 t^2-0.038 t^3。\end{gathered} $ |
式中:U为船载气象仪记录的10 m高度的现场风速(m·s-1);Sc代表DMS的Schmidt系数,由CTD获得的现场表层海水温度(t)计算得到[26]。本文中DMS浓度为现场测定DMS浓度,风速实时数据来自船载气象站数据。
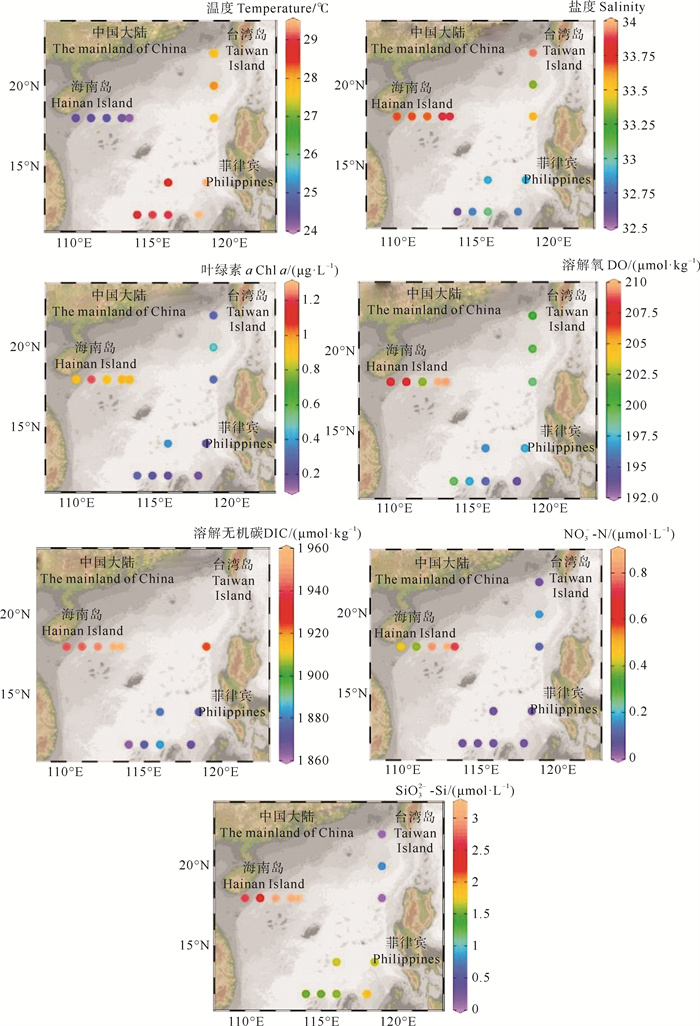
2 结果与讨论 2.1 表层海水环境参数的水平分布冬季南海表层海水温度、盐度、Chl a、溶解氧(DO)、溶解无机碳(DIC)、NO3--N和SiO32--Si的变化范围分别为24.15~29.48 ℃、32.80~33.85、0.177~1.210 μg·L-1、194~210 μmol·kg-1、1 863.1~1 959.7 μmol·kg-1、0.050~0.860 μmol·L-1和0.100~3.158 μmol·L-1,平均值分别为(27.15±2.19) ℃、(33.33±0.46)、(0.537±0.37) μg·L-1、(201±5.43) μmol·kg-1、(1 909.6±38.4) μmol·kg-1、(0.275±0.313) μmol·L-1和(1.780±0.997) μmol·L-1(见图 2)。冬季表层海水温度与Zhai等[27]夏季南海海盆海水表层温度调查结果(30.02 ℃)相比较低,盐度(33.20)水平相近。冬季表层海水温度出现北低南高的分布趋势,最低值出现在海南岛附近海域的J8站位(24.15 ℃),最高值出现在南沙群岛附近海域的D28站位(29.48 ℃)。盐度的分布趋势与温度相反,呈北高南低的趋势。温度和盐度的分布差异是因为南海北部海域受低温、高盐的东海沿岸流和从吕宋海峡而来的高盐黑潮水影响,南海南部海水受温暖、低盐的北赤道流影响显著[14, 28]。本文的Chl a浓度水平显著高于Zhai等[27]夏季的南海海盆海域调查结果(0.077 μg·L-1),这可能是因为本文调查海域包含生产力较高的近海海域,而Zhai等调查海域集中在海盆区域。Chl a的高值区域与盐度相似,在海南岛附近海域出现高值,在菲律宾和南沙群岛附近呈现低值。Chl a浓度在海南岛附近的高值(J断面表层平均值:0.99 μg·L-1)可能是因为海南岛人为活动和生活污染物排放对周边海域环境影响显著,DIC、NO3--N和SiO32--Si的高值(1 959.7、0.86和3.158 μmol·L-1)均出现在海南岛附近海域(J8和J7站位),Chen等[29]发现南海浮游植物繁殖主要受氮限制,陆源输送的营养盐促进了海南岛附近海域浮游植物的生长。南部海域表层海水出现低浓度Chl a可能是因为南部海域水体分层现象显著[27, 30],表层海水中NO3--N和SiO32--Si得不到补充,浮游植物生长受到限制。
|
图 2 南海冬季表层海水温度(℃)、盐度、Chl a(μg·L-1)、DO(μmol·kg-1)、DIC(μmol·kg-1)、NO3--N(μmol·L-1)和SiO32--Si(μmol·L-1)的水平分布 Fig. 2 Horizontal distributions of temperature(℃), salinity, Chl a (μg·L-1), DO (μmol·kg-1), DIC (μmol·kg-1), NO3--N (μmol·L-1), and SiO32--Si (μmol·L-1) in the surface water of the South China Sea in winter |
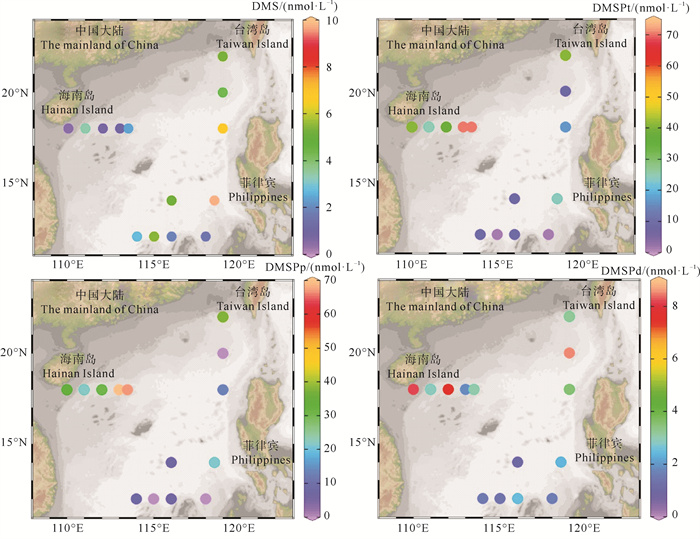
南海表层海水DMS、DMSPd和DMSPp的浓度变化范围分别为0.43~9.69、0.96~8.47和0.04~69.39 nmol·L-1,平均值分别为(3.61±2.65)、(3.47±2.58)和(22.48±23.06) nmol·L-1(见图 3)。DMS浓度水平明显高于夏季中国南海边缘沿海区域(2.12 nmol· L-1)[19]和南海海盆区域(1.76 nmol·L-1)[27](见表 2),这可能是调查期间海水受台风影响,水体垂直混合均匀,造成DMS浓度显著升高。DMS浓度低于中国其他近海(春季黄渤海:5.95 nmol·L-1;夏季东海:5.28 nmol·L-1)[31-32],可能因为南海是寡营养盐海域,较低的营养盐浓度限制了浮游植物生长,不利于DMS的产生。DMS高值区出现在菲律宾附近海域,低值区出现在海南岛和南沙群岛附近海域。DMS的最高值出现在D49站位(9.69 nmol·L-1),可能是该站位低的SiO32--Si浓度水平(1.645 μmol·L-1)和适宜的温度(29.41 ℃)改变了海水浮游植物结构,降低了DMS产率较低的硅藻在南海海水中的比例[33-34]。吕宋海峡峡口附近出现涡旋(见图 1),将高营养盐的黑潮中层水涌升,促进了J19站位浮游植物繁殖(Chl a:0.311 μg·L-1),继而促进该站位DMS的生产释放(DMS:6.74 nmol·L-1)。DMSPp浓度水平(22.48 nmol·L-1)低于Shen等[19]夏季南海边缘沿海区域结果(42.60 nmol·L-1),高于Yang等[21]春季南海海盆区域调查结果(6.06 nmol·L-1),DMSPd的浓度水平与Yang等[21]调查结果相近(3.92 nmol·L-1),高于Zhai等[27]夏季调查结果(0.86 nmol·L-1)。DMSPd和DMSPp水平分布呈相似规律,高值区出现在海南岛附近海域,低值区出现在南沙群岛附近海域。DMSPd和DMSPp在海南岛附近的浓度(J断面平均值:4.65和44.35 nmol·L-1)显著高于南沙群岛附近海域,这可能是浙-闽沿岸流和海南岛人为活动为该海域带来了充足的营养盐[35],促进浮游植物生长,促进二甲基硫化物的释放,因此该区域呈现出较高的DMSPd和DMSPp浓度。表层海水中平均DMSPp浓度(22.48 nmol·L-1)远大于平均DMSPd(3.47 nmol·L-1)浓度,这与Wu等[31]和Xu等[32]的结果一致。海水中大量的DMSP存在于浮游植物细胞内,DMSPd浓度低可能是因为DMSPd通过海洋细菌的脱甲基途径以及浮游植物和细菌释放于海水中的DMSP裂解酶裂解途径被降解[36]。
|
图 3 南海冬季表层海水DMS、DMSPt、DMSPp和DMSPd浓度(nmol·L-1)的水平分布 Fig. 3 Horizontal distributions of DMS, DMSPt, DMSPp and DMSPd (nmol·L-1) in the surface water of the South China Sea in winter |
|
|
表 1 南海冬季表层海水中DMS和DMSP浓度与环境参数的相关性分析 Table 1 Correlation analysis among the DMS and DMSP concentrations and environmental parameters in the South China Sea in winter |
|
|
表 2 南海、东海和黄渤海不同季节海水中DMS和DMSP浓度的比较 Table 2 Comparison of DMS and DMSP concentrations in seawater in different seasons of the South China Sea, the East China Sea, the Yellow Sea and Bohai Sea |
为进一步探究影响DMS、DMSPt、DMSPd和DMSPp的环境因素,用SPSS软件对南海表层海水中的DMS、DMSPd和DMSPp浓度与温度、Chl a、DO、NO3--N、SiO32--Si和DIC进行Spearman相关性分析(见表 1)。分析结果显示,DMS与DMSPp和DMSPd之间的相关性不显著(P>0.05),说明冬季南海海水中二甲基硫化物的浓度是个净结果,由多种因素决定。DMS和Chl a的相关性并不显著(r=-0.511,P=0.062)。目前对DMS与Chl a的关系尚无明确定论,许多海域DMS与Chl a的相关性不显著[16, 21],但也有海域发现了显著相关性[33]。DMS与Chl a的相关性缺乏与冬季南海海水内的浮游植物种类组成有关,不同藻类生产DMS的能力具有种间差异性[6],DMS与海水温度出现显著正相关(r= 0.547,P=0.043),这可能是较高的温度提高了DMSP裂解酶的活性[37],促进了DMS的释放。DMSPt与Chl a呈现显著正相关(r=0.686,P<0.01),进一步说明浮游植物是DMSP的主要生产者。DMSPp与海水盐度(r=0.796,P<0.01)和DO(r=0.845,P<0.01)呈现显著正相关,DMSP是浮游植物细胞内的渗透压调节剂[38]和抗氧化剂[39],海水盐度的升高和溶解氧水平的提高会促进浮游植物产生DMSP。DMSPp与SiO32--Si(r=0.559,P<0.05)、NO3--N(r=0.831,P<0.01)均呈现显著正相关,南海海域营养盐水平较低,营养盐浓度升高会促进浮游植物生长,继而促进了DMSPp的产生。
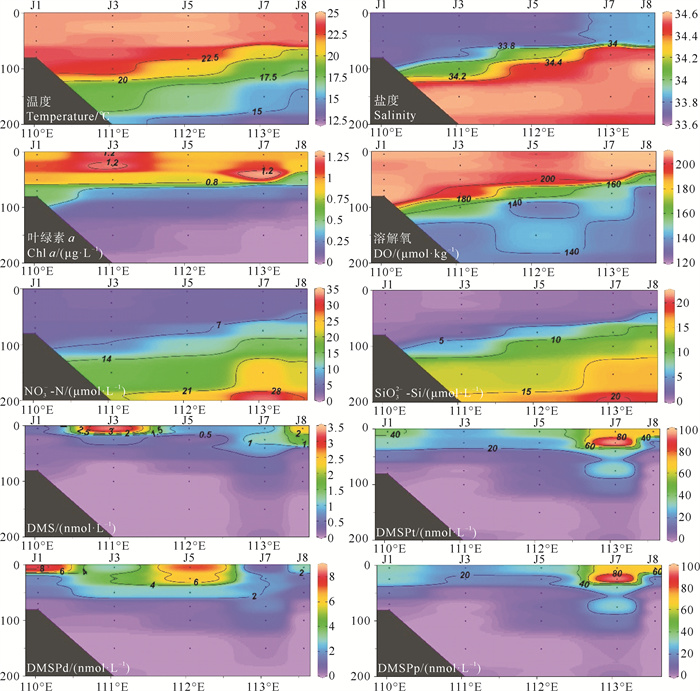
2.2.2 DMS、DMSPd和DMSPp的垂直分布J断面温度、盐度、Chl a和DO在200 m以浅出现了明显的分层现象,在水深50 m附近出现跃层,温度、盐度和DO跃层位置随着与海南岛距离增加而升高(见图 4),这可能是低温、低盐的浙闽沿岸流和温暖、高盐的黑潮相互影响的结果[14]。J断面DMSPp整体上呈现近岸低、远海高的趋势,与Chl a浓度近岸高、远海低的分布趋势不同,这与Shen等[19]的结果相似,DMSPp与其他因素(如光照强度和优势细菌种类)的相互作用可能造成这一结果[40]。
|
图 4 冬季南海J断面中温度(℃)、盐度、Chl a(μg·L-1)、DO(μmol·kg-1)、NO3--N(μmol·L-1)、SiO32--Si(μmol·L-1)、DMS、DMSPt、DMSPd和DMSPp浓度(nmol·L-1)的垂直分布 Fig. 4 Vertical distributions of temperature (℃), salinity, Chl a (μg·L-1), DO (μmol·kg-1), NO3--N (μmol·L-1), SiO32--Si (μmol·L-1), DMS, DMSPt, DMSPd, and DMSPp (nmol·L-1) along the transect J of the South China Sea in winter |
DMS和DMSPt呈现出与Chl a相似的垂直分布规律,高值主要出现在表层和次表层,在100 m以深的DMS、DMSPd和DMSPp浓度均低于检测限。尽管DMS主要是由浮游植物产生,但DMS与Chl a在表层的高值区域并不相似,说明在海南岛周边水域中还有Chl a以外的因素影响DMS的浓度。DMSPd、DMSPp与Chl a在水深25 m附近出现高值,与Zhai等[27]结果(约50 m)相比深度变浅,可能是由于采样季节和站位的不同导致的。细菌可以将大部分DMSPd快速转化为DMS,但在J断面海水中没有观察到高浓度DMS,推测可能是温暖的热带表层水中DMS的消费速率与其生产一样快[41],而J断面较高的平均风速(13.18 m·s-1)和J7站位高光化学氧化速率(17.51 nmol·L-1·d-1)说明J断面DMS具有高效的去除途径,造成了J断面的低浓度DMS。由西向东,DMSPp浓度随距海南岛的距离增加而增加,盐度和NO3--N浓度出现相同的分布趋势,这可能是因为南海高盐和高NO3--N海区中甲藻丰度较高[42],高盐和高的NO3--N浓度海域更适合DMSP的高产物种甲藻的生长繁殖[43]。
2.3 光化学氧化速率变化情况冬季南海kphoto的变化范围为5.06~17.51 nmol· L-1·d-1,平均值为(10.26±3.96) nmol·L-1·d-1 (见表 3),高于Xu等[32]的春季黄渤海调查结果(7.15 nmol·L-1·d-1),可能是因为冬季南海海水的透光性更好。kphoto在J7站位出现高值(17.51 nmol·L-1·d-1),人为活动影响为海南岛周边海域输送了有机质入海,可能导致J7站位光敏剂浓度上升[44],提高了DMS的光化学氧化速率。此外,NO3--N和NO2--N等光敏剂对于紫外光波的吸收效率更高[10],J7站位高的NO3--N水平(0.86 μmol·L-1)可能也是造成DMS光化学氧化速率高的原因。
|
|
表 3 冬季南海海域DMS在全波段、UVA、UVB和可见光波段的光化学氧化速率以及各波段贡献率 Table 3 The average DMS photochemical oxidation rates, and respective percentages under full-spectrum solar radiation, UVB, UVA, and visible light of the South China Sea in winter |
不同波段下DMS光化学氧化速率k可见、kUVA和kUVB的变化范围分别为0.56~2.28、1.11~7.61和2.09~7.62 nmol·L-1·d-1,平均值分别为(1.35± 0.65)、(4.60±2.02)和(4.16±1.99) nmol·L-1·d-1 (见表 3)。平均DMS光化学氧化速率表现为kUVA>kUVB>k可见光,紫外波段的光化学氧化速率结果在大部分站位差别不大,且远大于可见光的光化学氧化速率。紫外光比可见光在水柱中的穿透力更强,可以照射更深。UVA、UVB和可见光对DMS光化学氧化的贡献率的平均值分别为45.5%、41.2%和13.3%。紫外光波段的贡献率远高于可见光,这是因为同水平太阳辐射强度下紫外波段的光更易被光敏剂吸收[12, 32],且紫外波段光辐射强度远高于可见光强度。上述结果表明,DMS光化学氧化主要是由紫外波段光贡献的,这与Xu和Deal等[12, 32]的研究结果一致。
2.4 DMS海-气通量南海海域DMS海-气通量的变化范围为0.77~30.51 μmol·m-2·d-1,平均值为(11.54±9.48) μmol·m-2·d-1(见图 5)。调查期间受台风和寒潮影响,风速处于高水平,平均风速为9.9 m·s-1,但因南海海域DMS浓度水平较低,平均DMS海-气通量与其他中国近海调查结果(夏季东海[16]:9.21 μmol·m-2·d-1;夏季渤海[32]:8.84 μmol·m-2·d-1;春季黄海[45]:8.12 μmol·m-2·d-1)相比并没有显著增加,与Zhai等[27]夏季南海海盆区域(平均值:4.36 μmol·m-2·d-1) 相比显著增加。在海南岛附近海域出现低水平的DMS海-气通量,原因是该海域DMS浓度较低所致,DMS海-气通量的最大值(30.51 μmol·m-2·d-1)出现在S47站位,原因是S47站位出现相对较大的DMS浓度(5.30 nmol·L-1)和风速(13 m·s-1)(见图 4)。J1站位虽然风速最高(16.2 m·s-1),但较低的DMS浓度(0.43 nmol·L-1)导致了该站位的DMS海-气通量较小(2.37 μmol·m-2·d-1),海南岛周边站位具有高的风速水平,但较低的DMS浓度造成海-气通量低于平均值。虽然菲律宾附近的J19站位风速较低(9.0 m·s-1),但该站位高的DMS浓度(6.26 nmol·L-1) 造成了较高的DMS海-气通量(19.46 μmol·m-2·d-1)。因此可见,虽然表层海水中DMS浓度和风速共同控制DMS海-气通量,但南海表层海水DMS浓度是DMS海-气扩散的主要控制因素。全球海洋的年平均DMS排放量变化范围为1.60~3.74 μmol·m-2·d-1,平均值为28.1 Tg·a-1[1],占全球大气生源硫通量的50%[40]。为评价南海海域对全球硫循环的贡献和影响,根据本研究平均海-气通量大体估算了12 °N—18°N和110°E—118°E范围内海区(面积约为1.3×10⁵ km2)的全年DMS释放量,南海的DMS释放量约为1.752 ×10⁻² Tg·a-1,占全球DMS释放量(28.1 Tg·a-1)的0.062%,远高于该海域的面积比(0.036%)。虽南海海域营养物质匮乏,但因南海辽阔的海域温暖的海水和较高的风速,使南海表层海水和大气硫交换活跃。因此,南海在全球硫循环中的作用不可忽视。
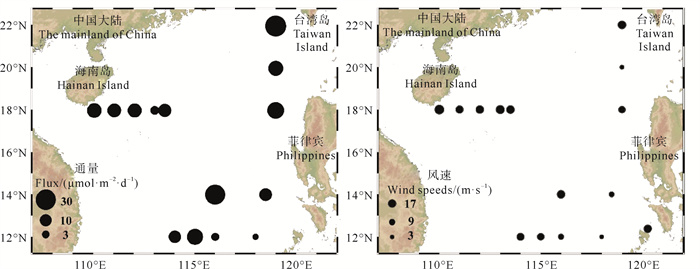
|
图 5 冬季南海DMS海-气通量(μmol·m-2·d-1)和风速(m·s-1)的分布 Fig. 5 Distributions of sea-to-air fluxes of DMS (μmol·m-2·d-1) and wind speeds (m·s-1) in the South China Sea in winter |
通过对2022年冬季南海海水中DMS、DMSP的浓度分布以及DMS的光化学氧化速率进行研究调查,得到如下结论:
(1) 表层海水中3种二甲基硫化物的平均浓度大小排序为DMSPp>DMS>DMSPd。DMS高值出现在菲律宾附近海域,受海水温度、NO3--N浓度和SiO32--Si浓度影响显著。DMSPp与Chl a分布均呈现近岸高、远海低的趋势,DMSPp与Chl a呈显著正相关,说明DMSPp浓度受浮游植物影响显著。DMSPp和DMSPd受环境因子影响显著,两者浓度在南海南北部差异显著。二甲基硫化物表层浓度高,随水深增加而浓度降低,海水分层现象明显,且跃层位置随着与海南岛距离增加而升高。
(2) 冬季南海海水具有较高的DMS光化学氧化速率,不同波段下DMS光化学氧化速率表现为kUVA>kUVB>k可见,紫外光波是进行DMS光化学氧化过程的主要动力。
(3) 冬季南海受台风和寒潮影响,具有较高的风速水平,但DMS海-气通量并没有显著高于其他中国近海海域。DMS海-气通量分布在整体上无明显趋势,南海海域DMS海-气通量主要受表层海水的DMS浓度的控制。用平均DMS海-气通量和南海面积估算得到南海海域DMS释放通量为1.752 × 10⁻² Tg·a-1,占全球DMS释放量(28.1 Tg·a-1)的0.062%,远高于南海的面积比(0.036%),南海是全球硫循环的重要贡献者。
| [1] |
Lana A, Bell T G, Simó R, et al. An updated climatology of surface dimethlysulfide concentrations and emission fluxes in the global ocean[J]. Global Biogeochemical Cycles, 2011, 25(1): 1-16. (  0) 0) |
| [2] |
Simó R. Production of atmospheric sulfur by oceanic plankton: Biogeochemical, ecological and evolutionary links[J]. Trends in Ecology & Evolution, 2001, 16(6): 287-294. (  0) 0) |
| [3] |
Charlson R J, Lovelock J E, Andreae M O, et al. Oceanic phytoplankton, atmospheric sulphur, cloud albedo and climate[J]. Nature, 1987, 326(6114): 655-661. DOI:10.1038/326655a0 (  0) 0) |
| [4] |
Quinn P K, Bates T S. The case against climate regulation via oceanic phytoplankton sulphur emissions[J]. Nature, 2011, 480(7375): 51-56. DOI:10.1038/nature10580 (  0) 0) |
| [5] |
Vallina S M, Simó R, Gassó S, et al. Analysis of a potential "solar radiation dose-dimethylsulfide-cloud condensation nuclei" link from globally mapped seasonal correlations[J]. Global Biogeochemical Cycles, 2007, 21(2): 1-16. (  0) 0) |
| [6] |
Keller M D, Bellows W K, Guillard R R L. Dimethyl sulfide production in marine phytoplankton[M]//Saltzman E S, Cooper W J. Biogenic Sulfur in the Environment. Washington DC: American Chemical Society, 1989: 167-182.
(  0) 0) |
| [7] |
Sunda W, Kieber D J, Kiene R P, et al. An antioxidant function for DMSP and DMS in marine algae[J]. Nature, 2002, 418(6895): 317-320. (  0) 0) |
| [8] |
Stefels J. Physiological aspects of the production and conversion of DMSP in marine algae and higher plants[J]. Journal of Sea Research, 2000, 43(3): 183-197. (  0) 0) |
| [9] |
Varaljay V A, Robidart J, Preston C M, et al. Single-taxon field measurements of bacterial gene regulation controlling DMSP fate[J]. The International Society for Microbial Ecology Journal l, 2015, 9(7): 1677-1686. (  0) 0) |
| [10] |
Toole D A, Kieber D J, Kiene R P, et al. High dimethylsulfide photolysis rates in nitrate-rich Antarctic waters[J]. Geophysical Research Letters, 2004, 31(11): L11307. (  0) 0) |
| [11] |
Hatton A D. Influence of photochemistry on the marine biogeochemical cycle of dimethylsulphide in the northern North Sea[J]. Deep Sea Research Part Ⅱ: Topical Studies in Oceanography, 2002, 49(15): 3039-3052. DOI:10.1016/S0967-0645(02)00070-X (  0) 0) |
| [12] |
Deal C J, Kieber D J, Toole D A, et al. Dimethylsulfide photolysis rates and apparent quantum yields in Bering Sea seawater[J]. Continental Shelf Research, 2005, 25(15): 1825-1835. DOI:10.1016/j.csr.2005.06.006 (  0) 0) |
| [13] |
Chen C T A, Wang S L, Wang B J, et al. Nutrient budgets for the South China Sea basin[J]. Marine Chemistry, 2001, 75(4): 281-300. DOI:10.1016/S0304-4203(01)00041-X (  0) 0) |
| [14] |
Cai Z, Gan J, Liu Z, et al. Progress on the formation dynamics of the layered circulation in the South China Sea[J]. Progress in Oceanography, 2020, 181: 102246. DOI:10.1016/j.pocean.2019.102246 (  0) 0) |
| [15] |
Xu F, Zhang H, Jia T, et al. Effects of phytoplankton on the production and emission of estuarine dimethyl sulfide under different nutrient inputs from Changjiang River[J]. Journal of Geophysical Research: Oceans, 2022, 127(4): 1-15. (  0) 0) |
| [16] |
孙小菡, 张洪海, 于蕾, 等. 夏季东海挥发性硫化物的空间分布与释放通量研究[J]. 环境科学学报, 2021, 41(10): 4256-4267. Sun X H, Zhang H H, Yu L, et al. Spatial distributions and sea-to-air fluxes of volatile sulfur compounds in the East China Sea in summer[J]. Acta Scientiae Circumstantiae, 2021, 41(10): 4256-4267. (  0) 0) |
| [17] |
李聪颖, 高旭旭, 马乾耀, 等. 秋、冬季长江口及邻近海域生源二甲基硫化物的时空分布及其对海水酸化和营养盐添加的响应[J]. 中国海洋大学学报(自然科学版), 2022, 52(12): 62-73. Li C Y, Gao X X, Ma Q Y, et al. Spatiotemporal distribution of biogenic dimethylated sulfur compounds in the Yangtze (Changjiang)River Estuary and its adjacent area during autumnand winter and their response to ocean acidification and nutrient addition[J]. Periodical of Ocean University of China, 2022, 52(12): 62-73. (  0) 0) |
| [18] |
Liu C Y, Han L, Wang L L, et al. Dimethylsulfoniopropionate, dimethylsulfide, and acrylic acid of a typical semi-enclosed bay in the western Yellow Sea: Spatiotemporal variations and influencing factors[J]. Marine Chemistry, 2022, 245: 104159. (  0) 0) |
| [19] |
Shen P P, Tang Y N, Liu H J, et al. Dimethylsulfide and dimethylsulfoniopropionate[J]. Continental Shelf Research, 2016, 117: 118-125. (  0) 0) |
| [20] |
Wolfe G, Kiene R. Radioisotope and chemical inhibitor measurements of dimethyl sulfide consumption rates and kinetics in estuarine waters[J]. Marine Ecology Progress Series, 1993, 99: 261-269. (  0) 0) |
| [21] |
Yang G P, Jing W W, Kang Z Q, et al. Spatial variations of dimethylsulfide and dimethylsulfoniopropionate[J]. Marine Environmental Research, 2008, 65(1): 85-97. (  0) 0) |
| [22] |
Dacey J W H, Blough N V. Hydroxide decomposition of dimethylsulfoniopropionate to form dimethylsulfide[J]. Geophysical Research Letters, 1987, 14(12): 1246-1249. (  0) 0) |
| [23] |
Nightingale P D, Malin G, Law C S, et al. In situ evaluation of air‐sea gas exchange parameterizations using novel conservative and volatile tracers[J]. Global Biogeochemical Cycles, 2000, 14(1): 373-387. (  0) 0) |
| [24] |
Malin G, Turner S M, Liss P S. Sulfur: The plankton/climate connection[J]. Journal of Phycology, 1992, 28(5): 590-597. (  0) 0) |
| [25] |
Lee G, Kahng S H, Oh J R, et al. Biogenic emission of dimethylsulfide from a highly eutrophicated coastal region, Masan Bay, South Korea[J]. Atmospheric Environment, 2004, 38(18): 2927-2937. (  0) 0) |
| [26] |
Saltzman E S, King D B, Holmen K, et al. Experimental determination of the diffusion coefficient of dimethylsulfide in water[J]. Journal of Geophysical Research: Oceans, 1993, 98(C9): 16481-16486. (  0) 0) |
| [27] |
Zhai X, Zhang H H, Yang G P, et al. Distribution and sea-air fluxes of biogenic gases and relationships[J]. Marine Chemistry, 2018, 200: 33-44. (  0) 0) |
| [28] |
Zhu Y, Sun J, Wang Y, et al. Overview of the multi-layer circulation in the South China Sea[J]. Progress in Oceanography, 2019, 175: 171-182. (  0) 0) |
| [29] |
Chen Y, ling L, Chen H Y, Karl D M, et al. Nitrogen modulates phytoplankton growth in spring in the South China Sea[J]. Continental Shelf Research, 2004, 24(4-5): 527-541. (  0) 0) |
| [30] |
车宏, 冉祥滨, 臧家业, 等. 南海南部海域夏季分粒级叶绿素a分布及影响因素[J]. 水生态学杂志, 2012, 33(4): 63-72. Che H, Ran X B, Zang J Y, et al. Distributions of size fractions of chlorophyll a and its controlling factorsin summer in the southern South China Sea[J]. Journal of Hydroecology, 2012, 33(4): 63-72. (  0) 0) |
| [31] |
Wu J W, Xu F, Liu L, et al. Production, distribution and flux of dimethyl sulfide in the East China Sea and its contribution to atmospheric sulfate aerosols[J]. Environmental Chemistry, 2021, 18(6): 202-213. (  0) 0) |
| [32] |
Xu F, Jin N, Ma Z, et al. Distribution, occurrence, and fate of biogenic dimethylated sulfur compounds in the Yellow Sea and Bohai Sea during spring[J]. Journal of Geophysical Research: Oceans, 2019, 124(8): 5787-5800. (  0) 0) |
| [33] |
Zhang S H, Yang G P, Zhang H H, et al. Spatial variation of biogenic sulfur in the south Yellow Sea and the East China Sea during summer and its contribution to atmospheric sulfate aerosol[J]. Science of the Total Environment, 2014, 488-489: 157-167. (  0) 0) |
| [34] |
Vogt M, Liss P. Dimethylsulfide and Climate[M]. Saltzman E S, Quéré C L. Surface Ocean Lower Atmosphere Process. Washington DC: American Geophysical Union Geophysical Monograph Series. 187, 2013: 197-232.
(  0) 0) |
| [35] |
黄亚楠, 陈法锦, 赵辉, 等. 2012年冬季南海西北部营养盐浓度分布及结构特征[J]. 应用海洋学学报, 2015, 34(3): 310-316. Huang Y N, Chen F J, Zhao H, et al. Concentration distribution and structural features of nutrients in the northwest of the South China Sea in winter 2012[J]. Journal of Applied Oceanography, 2015, 34(3): 310-316. (  0) 0) |
| [36] |
Kiene R P, Linn L J. The fate of dissolved dimethylsulfoniopropionate (DMSP) in seawater: Tracer studies using 35S-DMSP[J]. Geochimica et Cosmochimica Acta, 2000, 64(16): 2797-2810. (  0) 0) |
| [37] |
Mohapatra B R, Rellinger A N, Kieber D J, et al. Kinetics of DMSP lyases in whole cell extracts of four phaeocystis species: Response to temperature and DMSP analogs[J]. Journal of Sea Research, 2014, 86: 110-115. (  0) 0) |
| [38] |
Kirst G O. Salinity tolerance of eukaryotic marine algae[J]. Annual Review of Plant Physiology and Plant Molecular Biology, 1990, 41(1): 21-53. (  0) 0) |
| [39] |
Curson A R J, Williams B T, Pinchbeck B J, et al. DSYB catalyses the key step of dimethylsulfoniopropionate biosynthesis in many phytoplankton[J]. Nature Microbiology, 2018, 3(4): 430-439. (  0) 0) |
| [40] |
Yoch Duane C. Dimethylsulfoniopropionate: its sources, role in the marine food web, and biological degradation to dimethylsulfide[J]. Applied and Environmental Microbiology, 2002, 68(12): 5804-5815. (  0) 0) |
| [41] |
Li Q, Legendre L, Jiao N. Phytoplankton responses to nitrogen and iron limitation in the tropical and subtropical Pacific Ocean[J]. Journal of Plankton Research, 2015, 37(2): 306-319. (  0) 0) |
| [42] |
李红飞, 林森杰. 南海浮游植物生态学研究进展[J]. 厦门大学学报(自然科学版), 2019, 58(1): 1-10. Li H F, Lin S J. Research progresses of phytoplankton ecology in the South China Sea[J]. Journal of Xiamen University(Natural Science), 2019, 58(1): 1-10. (  0) 0) |
| [43] |
栾青杉, 孙军, 宋书群, 等. 长江口夏季浮游植物群落与环境因子的典范对应分析[J]. 植物生态学报, 2007, 31(3): 445-450. Luan Q S, Sun J, Song S Q, et al. Canonical correspondence analysis of summer phytoplankton community and its environment in the Yangtze River estuary, China[J]. Chinese Journal of Plant Ecology, 2007, 31(3): 445-450. (  0) 0) |
| [44] |
He Y, Pan Z, Liang X, et al. Distribution characteristics of photoinitiators and their flux estimation from the Pearl River Delta to the coastal waters of the South China Sea[J]. Journal of Environmental Sciences, 2023, 128: 71-80. (  0) 0) |
| [45] |
Li C, Yang G, Wang B, et al. Vernal distribution and turnover of dimethylsulfide (DMS) in the surface water of the Yellow Sea[J]. Journal of Geophysical Research: Oceans, 2016, 121(10): 7495-7516. (  0) 0) |
2. Laboratory for Marine Ecology and Environmental Science, Qingdao Marine Science and Technology Center, Qingdao 266237, China;
3. Institute of Marine Chemistry, Ocean University of China, Qingdao 266100, China
 2025, Vol. 55


