夏季欧亚大陆对流层上层存在着多支遥相关型,如环球遥相关(Circumglobal teleconnection,CGT)[1]、英国-贝加尔湖走廊[2]、英国-鄂霍次克海走廊[3]等,其中又以环球遥相关信号最为显著。环球遥相关位于西风急流所形成的波导内部,具有五波结构,其中心分别位于北大西洋、东欧、里海、贝加尔湖和东亚地区[1]。环球遥相关对欧亚地区的降水和气温等存在显著影响[1, 4-11]。环球遥相关的发现与南亚降水的研究有着密切的联系[5, 12-21],因此前人提出假说认为环球遥相关的维持依赖于CGT环流与南亚季风降水之间的相互作用[1, 22]。
环球遥相关在年代际或者更长的时间尺度上存在着变化。在二十世纪九十年代之后,欧洲、西亚和东北显著增暖[23]以及亚洲内陆高原地区和长江中下游流域降水减弱[24-27]都与对流层上层的环球遥相关波列相关。年代际尺度上环球遥相关具有更大的经向范围,并在1972和1997年发生了显著的位相转变[28],大西洋多年代际振荡(Atlantic multi-decadal oscillation,AMO)[29-34]被认为是可能驱动因素之一。由于环球遥相关与南亚降水之间的紧密联系,有研究认为印度降水第一模态的改变也可能导致环球遥相关在20世纪90年代末期出现显著的年代际变化[35]。
本文从年代际角度分析了青藏高原南侧降水(South Tibetan Plateau precipitation,STP)对环球遥相关的欧亚部分,也即夏季欧亚遥相关(Summer Eurasia teleconnection, SEAT)影响机制,以及AMO可能存在的调控作用。
1 数据与方法 1.1 数据本文使用数据包括:(1)美国国家环境预测中心/国家大气研究中心(National center for environmental prediction/National center for atmospheric research, NCEP/NCAR)日平均和月平均的再分析资料中位势高度场和风分量(u、v)场,空间分辨率为2.5°×2.5°[36];(2)欧洲中期预报中心(European centre for medium-range weather forecasts,ECMWF)第五代全球气候再分析数据集(ERA5)中位势高度场、风分量(u、v)场、海平面气温场和降水场,空间分辨率为0.25°×0.25°[37-39]。
1.2 方法本文结合前人研究[40-41],将20°N—60°N,30°W—150°E这一区域范围内夏季200 hPa经向风异常旋转EOF第一模态作为研究对象,这一模态本质即为环球遥相关的欧亚部分,为了避免歧义我们将其称为夏季欧亚遥相关,并将对应的第一主成分(PC1)定义为夏季欧亚遥相关指数(SEATI)。相比起前人常用的定义[40-41],夏季欧亚遥相关的定义更为直接地反映欧亚夏季主要遥相关特征。由于环球遥相关在7—8月份更明显,因此本文分析均基于7—8月平均的数据[42-43]。此外,大西洋多年代际振荡指数(AMOI)定义为北大西洋洋盆的平均海表面温度异常,指数来源于NCAR(https://climatedataguide.ucar.edu/climate-data/atlantic-multi-decadal-oscillation-amo)。本文主要关注年代际时间尺度,因此对上述几个指数利用11年快速傅里叶变换滤波器得到其年代际变化分量。
本文使用了线性斜压模式(Linear baroclinic model, LBM)[44]进行了数值试验以验证相关的物理机制。该模式为干大气模式,主要用于模拟大气内部的动力过程。LBM模式的水平分辨率为T42,垂直分层为20层。模式中包括了e折时间为6 h的短波水平耗散。
本文还采用回归分析研究夏季欧亚遥相关年代际变化的相关环流和影响因子,并利用TN波作用通量分析其传播过程[45]。
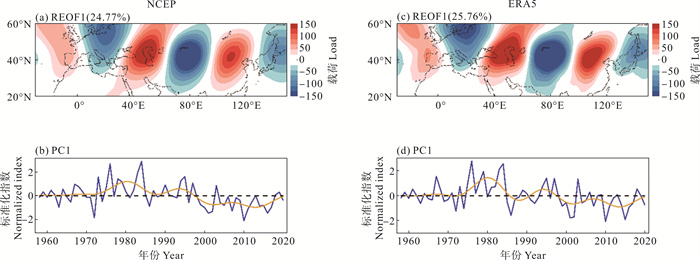
2 夏季欧亚遥相关的年代际变化特征夏季欧亚遥相关主要表现为一支沿着副热带急流自北大西洋上空一直向东传播到东亚的定常波列(见图 1(a)),其方差占比大约在25%左右。在1998年前后夏季欧亚遥相关发生了显著的年代际转折:1998年之前夏季欧亚遥相关主要以正位相为主导,但1998年之后基本都以负位相为主导(见图 1(b))。利用ERA5再分析数据集,对夏季欧亚遥相关年代际变化的真实性进行验证,得到同样的结果(见图 1(c)—1(d))。后文分析结果皆基于ERA5再分析数据集。
|
( (a)和(b)分别为1958—2020年7、8月平均200 hPa上空经向风异常REOF第一模态和对应的PC1时间序列(蓝色实线)。该REOF结果基于NCEP再分析数据集,计算区域为(20°N—60°N, 30°W—150°E)。标题中注明了这一模态的解释方差。黄色实线代表夏季欧亚遥相关指数(SEATI)的年代际分量。该分量是使用11年快速傅里叶变换(FFT)低通滤波器得到的。(c)和(d)与(a)和(b)类似,为基于ERA5数据集的结果。(a) and (b) indicates the first REOF mode and the corresponding PC1 (blue bar) of JA mean V200 anomalies over the region (20°N—60°N, 30°W—150°E) based on NCEP reanalysis dataset for the period 1958—2020. The explain variance is indicated in the title. Besides, the yellow line shows the interdecadal component of SEAT, which is attained by using 11 years Fast Fourier Transform (FFT) low-pass filter. (c) and (d) are similar to (a) and (b), but based on ERA5 dataset. ) 图 1 1958—2020年7、8月平均200 hPa上空经向风异常REOF分析结果图 Fig. 1 REOF analysis of 200 hPa meridional wind anomalies in July and August from 1958 to 2020 |
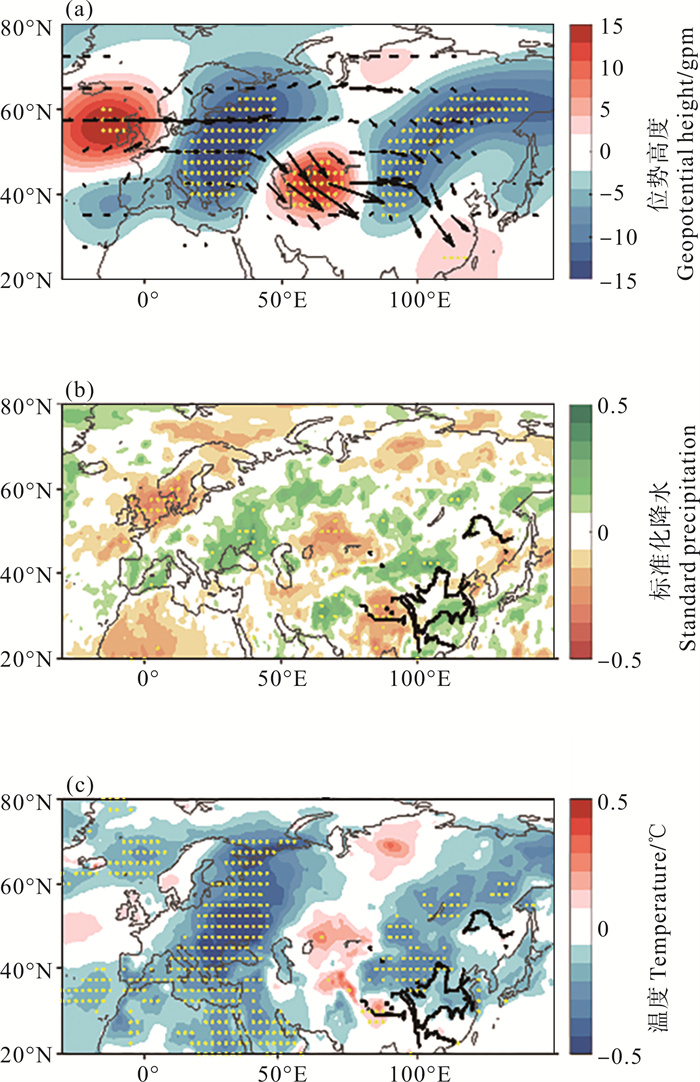
为揭示夏季欧亚遥相关年代际变化对气候和环流的影响,图 2给出了不同时期200 hPa位势高度异常、标准化降水异常和地表气温异常的回归分析结果。结果表明,夏季欧亚遥相关表现为自北大西洋上空沿着副热带急流传播到东亚地区的定常波列,其三个反气旋式异常环流中心分别位于北大西洋、里海和朝鲜半岛地区,两个气旋式异常场环流中心则位于中欧和蒙古地区(见图 2(a))。而当其转变为负位相以后,北大西洋、里海和东亚受到气旋式异常环流控制,而中欧和贝加尔湖地区受到反气旋式异常环流影响。
|
( 图中的黄色点表明该点数值基于双尾学生T检验达到了95%显著性水平。图(b)和(c)中的黑色实线标记了中国区域的主要河流。The yellow dots in above figures indicate 95% confidence level based on two tailed Students' t-test. The black line in (b) and (c) indicate the main rivers in China. ) 图 2 夏季欧亚遥相关指数年代际分量与200 hPa位势高度异常(a)、TN波作用通量(b)、标准化降水异常和地表气温异常(c)回归分析结果图 Fig. 2 Regression of 200 hPa geopotential height anomalies (a), TN wave activity flux (b), standard precipitation anomalies and surface air temperature anomalies (c) onto the interdecadal component of SEATI |
随着夏季欧亚遥相关的年代际位相转折,欧亚大陆的气候也经历着显著的变化。在夏季欧亚遥相关的正位相时期,挪威海、地中海和贝加尔湖地区的地表气温显著偏冷,同时地中海和贝加尔湖地区的降水有所增加,英国和里海地区的降水则有所减少。到了负位相时期,挪威海、地中海和贝加尔湖地区气温显著偏暖,相对应地这几个地区的降水也有所减少。
3 青藏高原南侧降水对夏季欧亚遥相关的影响机制夏季欧亚遥相关呈现出显著的年代际变化特征,并对欧亚大陆的气温和降水产生了显著影响。是什么因素造成了夏季欧亚遥相关出现如此显著的年代际变化?在前人的研究中,环球遥相关的产生和维持被认为依赖于环流与南亚降水之间的相互作用[1],同时,南亚降水主导模态的变化也与环球遥相关的年代际变化相匹配[35]。然而前人的研究当中大多将南亚降水的年代际和年际变化共同考虑,缺少对降水年代际变化的单独讨论。本文重点关注了年代际尺度上亚洲南部降水对夏季欧亚遥相关的影响。
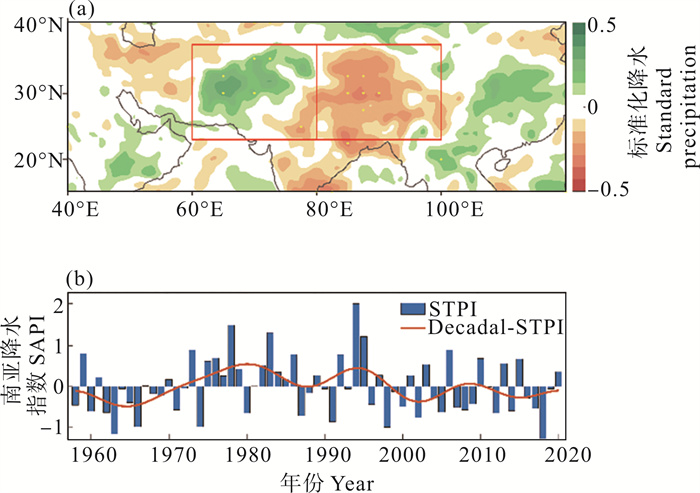
在年代际尺度上,夏季欧亚遥相关与青藏高原地区南侧偶极子型降水异常具有显著相关(见图 3(a)),这与前人重点关注的南亚地区降水落区不太一致。对此,我们认为是由于本文单独考虑了夏季欧亚遥相关的年代际分量与降水之间的关系,因此得到了不同的结论。在年代际尺度上,夏季欧亚遥相关与青藏高原南侧的偶极子型降水关系更为显著。为定量化研究该偶极子型降水模态的时空变化特征,我们定义了青藏高原南侧降水指数(STPI)。具体计算方法为将图 3(a)中左侧红框标准化降水异常的区域平均值减去右侧红框标准化降水异常的区域平均值,以此来反映偶极子型降水模态导致的东西方向降水差异。青藏高原南侧降水的变化同样具有年代际转折特征,在1998年以前青藏高原南侧降水指数偏向正位相,说明此时该地区降水西多东少;而1999年以后青藏高原南侧降水指数偏向负位相,相应地降水异常变为东多西少。在年代际尺度上,青藏高原南侧降水与夏季欧亚遥相关具有高度一致的变化趋势,两个指数的相关系数约为0.73,这说明青藏高原南侧降水的偶极子型模态与夏季欧亚遥相关的产生和维持关系密切。
|
( 图(a)中的黄色点表明该点数值基于双尾学生T检验达到了95%显著性水平,红框表示青藏高原南侧降水指数的计算区域,青藏高原南侧降水指数的年代际分量由11年FFT低通滤波器所得到,灰色虚线表明夏季欧亚遥相关年代际转折的年份。in (a) the yellow dots indicate 95% confidence level based on two tailed Students' t-test; The interdecadal component of STPI is attained by using 11 years fast fourier transform (FFT) low-pass filter; Grey dotted line indicates the timing of SEAT change. ) 图 3 标准化降水异常场与夏季欧亚遥相关指数年代际分量回归结果图(a)与青藏高原南侧降水指数(STPI)及其年代际分量时间序列(b) Fig. 3 Regression of standard precipitation anomalies onto interdecadal SEATI and time series of Tibetan Plateau dipole precipitation index (STPI) and its interdecadal component |
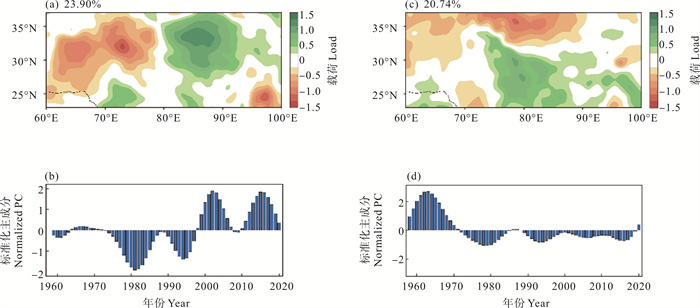
为进一步验证偶极子型降水模态的稳定性,我们又对低通滤波之后的标准化降水异常场进行了旋转EOF分析。分析结果表明,在年代际尺度上,青藏高原南侧降水主要存在两个主导模态:第一模态为东西偶极子型模态,解释方差约为23.9%,与夏季欧亚遥相关回归结果呈现的降水异常模态一致(见图 4(a)),这一模态在1998年前后也表现出显著的年代际位相转折,前期以负位相为主,即降水西多东少,而后期以正位相为主,降水东多西少(见图 4(b));第二模态为南北偶极子型异常模态(见图 4(c)),解释方差为20.74%,该模态在1970年之间以正位相为主导,1970年之后基本呈现负位相(见图 4(d)),东西偶极子型降水异常模态在年代际尺度上主导了青藏高原南侧的降水,这一模态在1998年前后出现了年代际位相转折,与夏季欧亚遥相关的位相转折时间一致,其PC与前文所定义的青藏高原南侧降水指数相关系数超过-0.8,进一步证明在年代际尺度上,青藏高原降水的主导模态独立且相对稳定。
|
( (a)和(b)分别为区域(20°N—40°N, 60°E—100°E)标准化降水异常场REOF第一模态以及相应的主成分。(c)和(d)为第二模态及相应主成分。所用数据在进行REOF分析之前已经过11年快速傅里叶变换低通滤波处理。标题中的百分数表示对应模态的解释方差。(a) and (b) respectively indicate the first REOF mode of standard precipitation anomalies over the region (20°N—40°N, 60°E—100°E) and the corresponding PC1. (c) and (d) are similar as (a) and (b), but for the second REOF mode and the corresponding PC2. The data has been filtered before the REOF analysis by using a 11 years FFT low-pass filter. The contribution variance of each mode has been indicated in the title. ) 图 4 区域标准化降水异常场REOF分析结果 Fig. 4 REOF analysis of region standard precipitation anomalies |
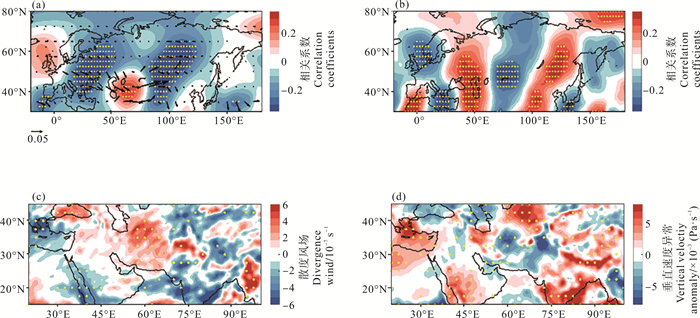
通过以上分析,我们明确了夏季欧亚遥相关的年代际变化与青藏高原降水的偶极子型异常息息相关,接下来将探究青藏高原南侧降水影响夏季欧亚遥相关年代际变化的具体物理机制。对于这一问题,前人研究曾提出了两个机制来加以解释[1, 7],其一是“季风-沙漠”机制[46],即降水产生的潜热异常会激发出Rossby波列并沿着急流向下游传播。需要强调的是,许多研究认为夏季北大西洋涛动是夏季欧亚遥相关的一个重要涡源强迫[47],这里为了更好反映青藏高原南侧降水对夏季欧亚遥相关的作用,我们采用偏相关分析的方法,将夏季北大西洋涛动的影响去除。如图 5所示,与青藏高原南侧降水年代际分量相伴随的200 hPa位势高度异常(见图 5(a))和经向风异常(见图 5(b))都反映出青藏高原南侧降水产生的潜热异常伴随着一支沿着副热带急流自西向东传播的Rossby波列,这与夏季欧亚遥相关的结构高度一致(见图 2(a))。
|
( (a)和(b)的结果去除了夏季北大西洋涛动影响的偏相关系数分布。图中的黄色点表明该点数值基于双尾学生T检验达到了95%显著性水平。The results shown in (a) and (b) are the distribution of partial correlation coefficients after removing the influence of SNAO. The yellow dots in the figures indicate 95% confidence level based on two tailed Students' t-test. ) 图 5 200 hPa位势高度异常场和波作用通量,200 hPa经向风异常场与青藏高原南侧降水指数年代际分量偏相关分析结果图((a), (b))以及200 hPa散度风场和500 hPa垂直速度异常与青藏高原南侧降水指数年代际分量回归结果图((c), (d)) Fig. 5 Partial correlation of 200 hPa geopotential height anomalies and TN wave activity flux (arrow) and 200 hPa meridional wind anomalies onto interdecadal component of STPI ((a), (b)) and regression of 200 hPa divergence wind anomalies and 500 hPa vertical velocity onto interdecadal component of STPI ((c), (d)) |
除了“季风-沙漠”机制以外,另外一个重要的物理过程就是Rossby波源机制, 这一机制与散度风和高空的涡度平流有关[48]。具体来说,青藏高原南侧降水产生的凝结潜热释放加强了其上空的垂直对流运动,并在高空产生辐合辐散。伴随着这种辐合辐散,高空的异常涡度平流可作为Rossby波源,促进波列的产生和维持,从而对夏季欧亚遥相关的年代际变化产生影响。
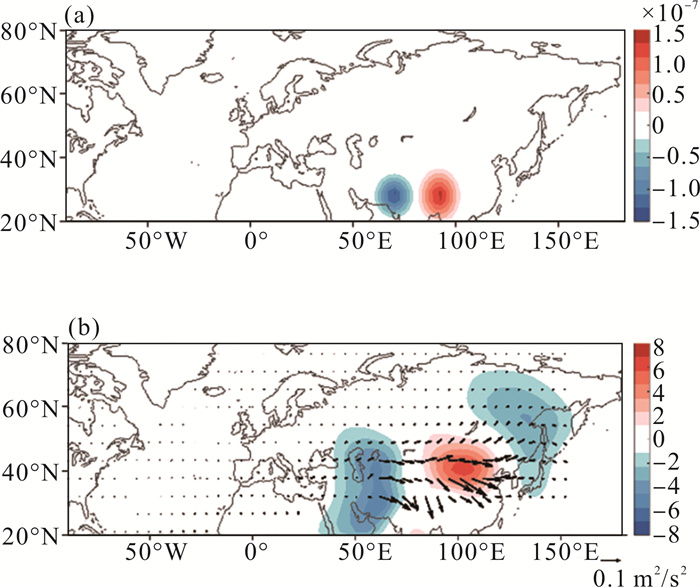
偏相关分析等结果从统计学角度反映出青藏高原南侧降水对夏季欧亚遥相关的年代际变化存在着影响。为了进一步验证这一物理过程,我们采用LBM模式进行了以下的数值试验:在青藏高原及其以西地区加上偶极子型的加热异常作为强迫驱动模式运行并观察大气环流的响应。由于潜热释放一般在大气层中层达到最强,因此此试验中热强迫的强度在σ=0.45的高度上达到最强,垂直廓线为sigma函数曲线。LBM模式试验运行了60 d,取后45 d的平均值作为响应结果。从模式结果可以发现,偶极子型降水产生的潜热释放可以激发出一支波列状的结构并沿着副热带急流向下游传播(见图 6),这印证了前文所述青藏高原南侧降水通过两个机制对夏季欧亚遥相关的产生和维持造成了影响。
|
( (a)和(b)LBM模式中规定的加热异常强迫分布(填色;单位:K·s-1)及相应的200 hPa位势高度异常(填色;单位:gpm)、波作用通量响应(箭头;单位:m2·s-2)。强迫的垂直廓线为sigma函数曲线,在σ=0.45的高度上达到最强。(a) and (b) respectively indicate The horizonal distribution of heating forcing (shading; Unit: K·s-1) prescribed to the LBM and the corresponding 200 hPa geopotential height anomalies (shading; Unit: gpm) and wave activity flux (arrow; Unit: m2·s-2) response. The vertical profile of heating forcing is a sigma function curve and the maximum of the forcing is at σ=0.45. ) 图 6 LBM模式试验结果图 Fig. 6 The result of LBM experiment |
在上一节的分析讨论中,我们对年代际尺度上青藏高原南侧降水影响夏季欧亚遥相关的物理机制进行了简要分析,那么在年代际尺度上青藏高原南侧降水的变化又与什么因素有关?Goswami等[48]在研究中提出AMO可能会通过大气桥作用影响南亚地区的对流层温度,进而影响南亚季风降水。基于这一研究,我们提出以下假设:AMO可能会通过影响青藏高原南侧降水进而调控夏季欧亚遥相关的年代际变化,并对此进行了探究。
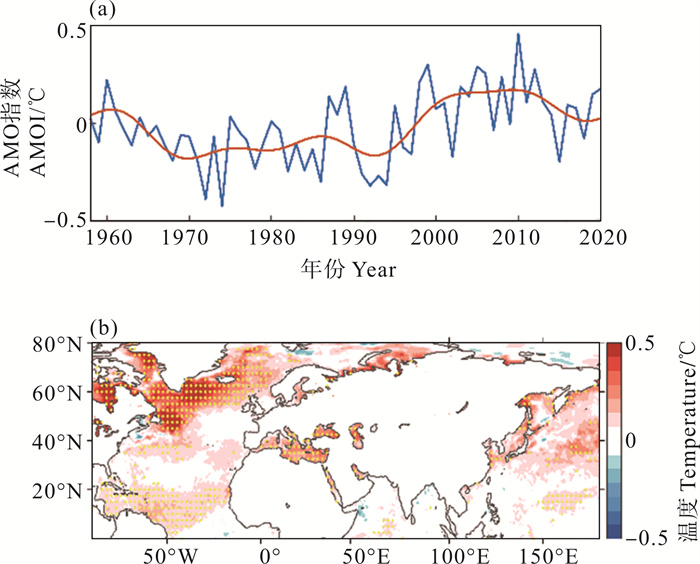
AMO是北大西洋地区重要的自然变率模态,周期大约为60~80 a。AMO的变化与热盐环流的自然变化相关[29-30],并且是北半球气候变率的重要驱动因素之一[31, 33-34]。基于NCAR提供的AMO指数对夏季海平面气温(Sea surface temperature, SST)进行合成分析可以发现,夏季AMO在1998年前后表现出了显著不同。
在1998年以前,AMO以冷位相为主导,格陵兰岛周围以及北大西洋均为冷海温异常,地中海一带海温同样偏冷(见图 7(a));随后,AMO转变为暖位相,伴随着较为显著的暖海温异常,尤其是在格陵兰岛周围以及巴伦支喀拉海一带的海温(见图 7(b))。
|
( 图(a)中蓝色实线和黄色实线分别表示AMO指数及其年代际分量。图中的黄色点表明该点数值基于双尾学生T检验达到了95%显著性水平。The blue and yellow line in (a) respectively indicate the AMOI and its interdecadal component. The yellow dots in above figures indicate 95% confidence level based on two tailed Students' t-test. ) 图 7 AMO指数时间序列及其年代际分量(a)与夏季7、8月海温回归分析(b)结果图 Fig. 7 Time series of AMOI (a) and the regression of SST onto the interdecadal component of AMOI (b) |
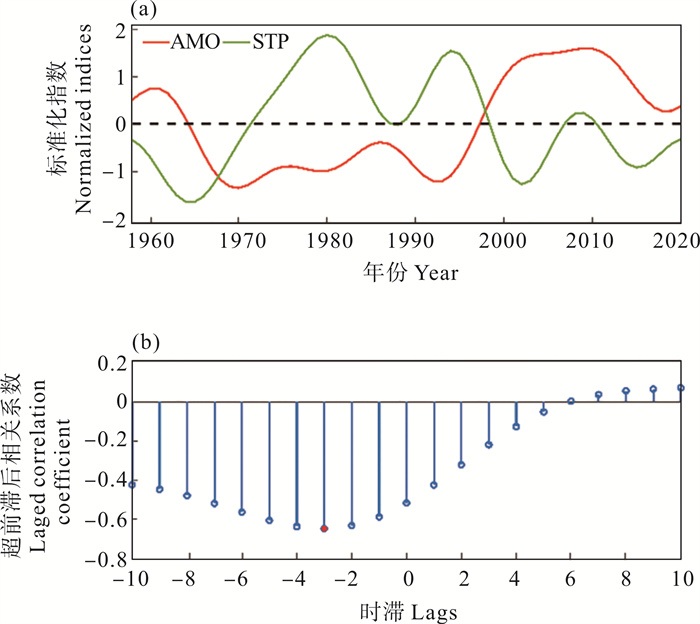
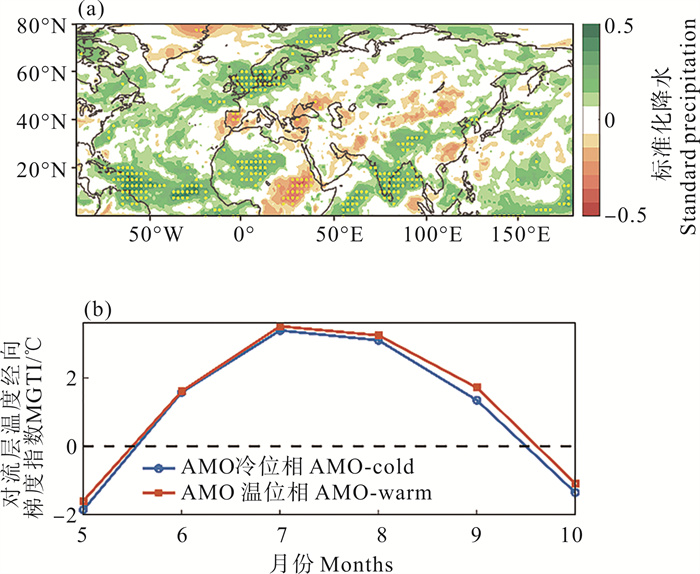
从年代际尺度上看,AMO与青藏高原南侧降水之间存在显著的反位相变化关系(见图 8(a)),当AMO处于冷位相时,青藏高原南侧降水处于正位相;而当AMO转变为暖位相时,相应地青藏高原南侧降水转为负位相。进一步分析发现,AMO的变化对青藏高原南侧降水的影响在滞后3 a时达到最强,此时两者的相关系数约为-0.7(见图 8(b))。AMO与滞后3年标准化降水异常的回归结果也可以对这一结论加以证明:青藏高原地区的降水与AMO之间存在显著正相关,当AMO处于冷位相时,该地区降水偏少,因此这一时期青藏高原南侧的偶极子型降水为正位相;而当AMO转为暖位相时,降水显著增加,相应地青藏高原南侧的偶极子型降水转为负位相(见图 9(a))。
|
( 红点表示两者超前滞后相关系数的最大值。时滞的负值表示AMO超前青藏高原南侧降水,正值表示AMO滞后青藏高原南侧降水。The red point indicates the maximum value of the cross-correlation coefficient. A negative value for lags indicates that AMO is ahead of STP, while a positive value indicates that AMO is behind STP. ) 图 8 大西洋多年代际振荡指数(AMOI)和青藏高原南侧降水指数(STPI)年代际分量的时间序列(a)以及两个指数的超前滞后相关系数(b)结果图 Fig. 8 The time series of the interdecadal component of the AMOI and the STPI (a) and their cross-correlation coefficient (b) |
|
( 图中的黄色点表明该点数值基于双尾学生T检验达到了95%显著性水平。The yellow dots in above figures indicate 90% confidence level based on two tailed Students' t-test. ) 图 9 标准化降水异常与AMO指数年代际分量回归结果图(a)及不同年代际时期南亚地区对流层温度经向梯度指数(MGTI)时间序列(b) Fig. 9 Regression of standard precipitation anomalies onto the interdecadal component of AMOI (a) and time series of the meridional gradient index of tropospheric temperature (MGTI) in different interdecadal periods (b) |
此外,Goswami等[49]指出, AMO是通过影响印度次大陆和印度洋之间对流层温度梯度变化来影响南亚季风降水,并定义了对流层温度经向梯度指数(Meridional gradient of tropospheric temperature index, MGTI)来定量表示这一变化。该指数定义为印度次大陆地区(10°N—35°N, 30°E—100°E)和印度洋(15°S—10°N, 30°E—100°E)地区200~600 hPa垂直平均温度的差,其两个变符号点分别表示南亚季风的爆发和撤退[50]。基于这一定义,本文对AMO冷暖位相时期的MGTI进行了计算,结果表明,AMO暖位相时期南亚地区的对流层温度经向梯度大于冷位相时期,并且MGTI由正转负的时间点也更晚(见图 9(b))。这种变化意味着AMO由冷位相转向暖位相会使得南亚地区的对流层温度梯度增大,并推迟了南亚季风的撤退。伴随着南亚季风撤退的延迟,青藏高原附近的降水有所增加,这改变了青藏高原南侧东西方向上的降水差异。相应地,青藏高原南侧偶极子型降水的位相发生了转变,最终通过上一节中提到的机制调控了夏季欧亚遥相关的年代际变化。
5 结论与讨论夏季欧亚大陆上空的遥相关型主导了欧亚局地的气候特征。本文以夏季欧亚遥相关,也就是环球遥相关的欧亚部分[1]为研究对象,分析了其年代际变化特征以及青藏高原南侧降水如何影响夏季欧亚遥相关的年代际变化,并进一步探究了AMO是否可能通过改变青藏高原南侧降水进而调控夏季欧亚遥相关的变化。
夏季欧亚遥相关主要表现为自北大西洋上空沿着副热带急流传播到东亚地区的定常波列,其三个反气旋式异常环流中心分别位于北大西洋、里海和朝鲜半岛地区,两个气旋式异常环流中心则位于中欧和蒙古地区。在1998年前后,夏季欧亚遥相关发生了显著的年代际位相转折,这对欧亚大陆的气温和降水产生了显著影响。夏季欧亚遥相关的激发和维持主要依赖于青藏高原南侧降水与夏季欧亚遥相关环流的相互作用。在年代际尺度上,青藏高原南侧的偶极子型降水异常主要通过两个机制对夏季欧亚遥相关产生影响:其一是“季风-沙漠”机制[45],即降水产生的潜热会强迫出Rossby波,波能量沿着副热带急流向下游传播,形成与夏季欧亚遥相关基本一致的波列状结构;其二是Rossby波源机制[47],该机制主要与高空辐合辐散以及相伴随的异常涡度平流有关。降水产生的凝结潜热释放会加强青藏高原及其以西地区的对流运动,并在高空产生辐合辐散,伴随着高空辐合辐散的涡度平流可作为Rossby波源,促进夏季欧亚遥相关的产生和维持。
在明确了青藏高原南侧降水对夏季欧亚遥相关的影响机理之后,我们进一步探究了AMO是否可能通过影响青藏高原南侧降水进而调控夏季欧亚遥相关的年代际变化。AMO在20世纪90年代也表现出由冷位相转为暖位相的年代际位相转折特征。在年代际尺度上,AMO与青藏高原南侧降水存在显著的反位相变化关系,并且AMO的变化超前青藏高原南侧降水3 a。当AMO由冷位相转变为暖位相时,印度次大陆和印度洋之间的对流层温度梯度增大,南亚季风撤退时间延迟,这不仅导致了整个南亚地区的降水增多,与之相伴随地,青藏高原附近的降水也显著增加,最终调控了夏季欧亚遥相关的年代际变化。
本文主要明确了夏季7—8月夏季欧亚遥相关的年代际变化特征以及年代际尺度上南亚降水对夏季欧亚遥相关的影响机理,并通过进一步探究表明,AMO可能会通过影响青藏高原南侧降水调控夏季欧亚遥相关的变化。然而,本文主要的关注点在青藏高原南侧降水对夏季欧亚遥相关的影响上,对于中高纬度气候系统,例如北大西洋涛动和北大西洋海温等与夏季欧亚遥相关年代际变化之间的关系还缺乏相应讨论。此外,本文对于物理机制的讨论仍不够全面, 接下来的研究可以利用数值模式等其它方法对青藏高原南侧降水影响夏季欧亚遥相关的物理机制加以验证分析。
| [1] |
Ding Q, Wang B. Circumglobal teleconnection in the Northern Hemisphere Summer[J]. Journal of Climate, 2005, 18: 3483-3505. DOI:10.1175/JCLI3473.1 (  0) 0) |
| [2] |
Xu P, Wang L, Chen W. The British-Baikal Corridor: A teleconnection pattern along the summertime Polar Front Jet over Eurasia[J]. Journal of Climate, 2019, 32: 877-896. DOI:10.1175/JCLI-D-18-0343.1 (  0) 0) |
| [3] |
Xu P, Wang L, Dong Z, et al. The British-Okhotsk Corridor pattern and its linkage to the Silk Road Pattern[J]. Journal of Climate, 2022, 35: 5787-5804. DOI:10.1175/JCLI-D-21-0705.1 (  0) 0) |
| [4] |
Lu R Y, Oh J H, Kim B J. A teleconnection pattern in upper-level meridional wind over the North African and Eurasian continent in summer[J]. Tellus, 2002, 54: 44-55. DOI:10.3402/tellusa.v54i1.12122 (  0) 0) |
| [5] |
Wu R G, Wang B. A contrast of the east Asian summer monsoon-ENSO relationship between 1962—1977 and 1978—1993[J]. Journal of Climate, 2002, 15: 3266-3279. DOI:10.1175/1520-0442(2002)015<3266:ACOTEA>2.0.CO;2 (  0) 0) |
| [6] |
Ding Q, Wang B, Wallace J M, et al. Tropical-extratropical teleconnections in Boreal Summer: Observed interannual variability[J]. Journal of Climate, 2011, 24: 1878-1896. DOI:10.1175/2011JCLI3621.1 (  0) 0) |
| [7] |
Chen G, Huang R. Excitation mechanisms of the teleconnection patterns affecting the July precipitation in Northwest China[J]. Journal of Climate, 2012, 25: 7834-7851. DOI:10.1175/JCLI-D-11-00684.1 (  0) 0) |
| [8] |
Wang L, Xu P, Chen W, et al. Interdecadal variations of the Silk Road pattern[J]. Journal of Climate, 2017, 30: 9915-9932. DOI:10.1175/JCLI-D-17-0340.1 (  0) 0) |
| [9] |
Li X, Lu R. Extratropical factors affecting the variability in summer precipitation over the Yangtze River Basin, China[J]. Journal of Climate, 2017, 30: 8357-8374. DOI:10.1175/JCLI-D-16-0282.1 (  0) 0) |
| [10] |
Li X, Lu R. Subseasonal change in the seesaw pattern of precipitation between the Yangtze River basin and the tropical western North Pacific during summer[J]. Advance in Atmospheric Sciences, 2018, 35: 1231-1242. DOI:10.1007/s00376-018-7304-6 (  0) 0) |
| [11] |
Li X, Lu R, Ahn J. Combined effects of the British-Baikal Corridor pattern and the Silk Road pattern on Eurasian surface air temperatures in summer[J]. Journal of Climate, 2021, 34: 3707-3720. DOI:10.1175/JCLI-D-20-0325.1 (  0) 0) |
| [12] |
Liang P D. Indian summer monsoon and rainfall in North China in summer[J]. Acta Meteorologica Sinica, 1988, 46: 75-81. (  0) 0) |
| [13] |
Guo Q Y, Wang J Q. A comparative study on summer monsoon in China and India[J]. Journal of Tropical Meteorology, 1988, 4: 53-60. (  0) 0) |
| [14] |
Kripalani R H, Singh S V. Large-scale aspects of India-China summer monsoon rainfall[J]. Advance in Atmospheric Sciences, 1993, 10: 72-84. (  0) 0) |
| [15] |
Kripalani R H, Kulkarni A. Rainfall variability over southeast Asia—Connections with Indian monsoon and ENSO extremes: New perspective[J]. International Journal of Climatology, 1997, 17: 1155-1168. DOI:10.1002/(SICI)1097-0088(199709)17:11<1155::AID-JOC188>3.0.CO;2-B (  0) 0) |
| [16] |
Kripalani R H, Kulkarni A. Monsoon rainfall variations and teleconnections over south and east Asia[J]. International Journal of Climatology, 2001, 17: 1155-1168. (  0) 0) |
| [17] |
Zhang R H. The role of Indian summer monsoon water vapor transportation on the summer rainfall anomalies in the northern part of China during the El Niño mature phase[J]. Plateau Meteorology, 1999, 18: 567-574. (  0) 0) |
| [18] |
Wang B, Wu R G, Lau K M. Interannual variability of the Asian summer monsoon: Contrasts between the Indian and the western North Pacific-east Asian monsoons[J]. Journal of Climate, 2001, 14: 4073-4090. DOI:10.1175/1520-0442(2001)014<4073:IVOTAS>2.0.CO;2 (  0) 0) |
| [19] |
Krishnan R, Sugi M. Baiu rainfall variability and associated monsoon teleconnection[J]. Journal of the Meteorological Society of Japan, 2001, 79: 851-860. (  0) 0) |
| [20] |
Lau K M, Weng H Y. Recurrent teleconnection patterns linking summertime precipitation variability over east Asia and North America[J]. Journal of the Meteorological Society of Japan, 2002, 80: 1309-1324. (  0) 0) |
| [21] |
Lau K M, Kim K M, Lee J Y. Interannual Variability, Global Teleconnection and Potential Predictability Associated with the Asian Summer Monsoon: East Asian Monsoon[M]. [s. l. ]: World Scientific, 2004: 564.
(  0) 0) |
| [22] |
Chen G, Huang R, Zhou L. Baroclinic instability of the Silk Road pattern induced by thermal damping[J]. Journal of Atmospheric Science, 2013, 70: 2875-2893. DOI:10.1175/JAS-D-12-0326.1 (  0) 0) |
| [23] |
Hong X, Lu R, Li S. Amplified summer warming in Europe-West Asia and Northeast Asia after the mid-1990s[J]. Environmental Research Letters, 2017, 12: 094007. DOI:10.1088/1748-9326/aa7909 (  0) 0) |
| [24] |
Piao J, Chen W, Wei K, et al. An abrupt rainfall decrease over the Asian inland plateau region around 1999 and the possible underlying mechanism[J]. Advance in Atmospheric Sciences, 2017, 34: 456-468. DOI:10.1007/s00376-016-6136-5 (  0) 0) |
| [25] |
Zhu Y, Wang H, Zhou W, et al. Recent changes in the summer precipitation pattern in east China and the background circulation[J]. Climate Dynamic, 2011, 36: 1463-1473. DOI:10.1007/s00382-010-0852-9 (  0) 0) |
| [26] |
Zhu Y, Wang T, Wang H. Relative contribution of the anthropogenic forcing and natural variability to the interdecadal shift of climate during the late 1970s and 1990s[J]. Science Bulletin, 2016, 61: 416-424. DOI:10.1007/s11434-016-1012-3 (  0) 0) |
| [27] |
Si D, Ding Y. Oceanicforcings of the interdecadal variability in East Asian summer rainfall[J]. Journal of Climate, 2016, 29: 7633-7649. DOI:10.1175/JCLI-D-15-0792.1 (  0) 0) |
| [28] |
Wang L, Xu P, Chen W, et al. Interdecadal variations of the Silk Road pattern[J]. Journal of Climate, 2017, 30: 9915-9932. DOI:10.1175/JCLI-D-17-0340.1 (  0) 0) |
| [29] |
Knight J R, Allan R J, Folland C K, et al. A signature of persistent natural thermohaline circulation cycles in observed climate[J]. Geophysical Research Letters, 2005, 32: L20708. (  0) 0) |
| [30] |
Knight J R, Folland C K, Scaife A A. Climatic impacts of the Atlantic multidecadal oscillation[J]. Geophysical Research Letters, 2006, 33: L17706. (  0) 0) |
| [31] |
Zhang R, Delworth T L, Held I M. Can the Atlantic Ocean drive the observed multidecadal variability in Northern Hemisphere mean temperature[J]. Geophysical Research Letters, 2007, 34: L02709. (  0) 0) |
| [32] |
Folland C K, Knight J, Linderholm H W, et al. The summer North Atlantic oscillation: Past, present, and future[J]. Journal of Climate, 2009, 22: 1082-1103. DOI:10.1175/2008JCLI2459.1 (  0) 0) |
| [33] |
Sun X, Li S, Hong X, et al. Simulated influence of the Atlantic multidecadal oscillation on summer Eurasian nonuniform warming since the mid-1990s[J]. Advance in Atmospheric Sciences, 2019, 36: 811-822. DOI:10.1007/s00376-019-8169-z (  0) 0) |
| [34] |
Sun Y B, Clemens S C, Morrill C, et al. Influence of Atlantic meridional overturning circulation on the East Asian winter monsoon[J]. Nature Geoscience, 2012, 5: 46-49. DOI:10.1038/ngeo1326 (  0) 0) |
| [35] |
Liu Y, Zhou W, Qu X, et al. An interdecadal change of the Boreal Summer Silk Road pattern around the late 1990s[J]. Journal of Climate, 2020, 33: 7083-7100. DOI:10.1175/JCLI-D-19-0795.1 (  0) 0) |
| [36] |
Kalnay E, Kanamitsu M, Kistker R, et al. The NCEP/NCAR 40-Year reanalysis project[J]. Bulletin of the American Meteorological Society, 1996, 77(3): 437-472. DOI:10.1175/1520-0477(1996)077<0437:TNYRP>2.0.CO;2 (  0) 0) |
| [37] |
Hersbach H, Bell B, Berrisford P, et al. ERA5 monthly averaged data on pressure levels from 1940 to present. Copernicus[J]. Climate Change Service (C3S) Climate Data Store (CDS), 2023a. (  0) 0) |
| [38] |
Hersbach H, Bell B, Berrisford P, et al. ERA5 monthly averaged data on single levels from 1940 to present[J]. Copernicus Climate Change Service (C3S) Climate Data Store (CDS), 2023b. (  0) 0) |
| [39] |
Hersbach H, Bell B, Berrisford P, et al. ERA5 hourly averaged data on pressure levels from 1940 to present[J]. Copernicus Climate Change Service (C3S) Climate Data Store (CDS), 2023c. (  0) 0) |
| [40] |
Kosaka Y, Nakamura H, Watanabe M, et al. Analysis on the dynamics of a wave-like teleconnection pattern along the summertime Asian jet based on a reanalysis dataset and climate model simulations[J]. Journal of the Meteorological Society of Japan, 2009, 87: 561-580. (  0) 0) |
| [41] |
Yasui S, Watanabe M. Forcing processes of the summertime circumglobal teleconnection pattern in a dry AGCM[J]. Journal of Climate, 2010, 23: 2093-2114. DOI:10.1175/2009JCLI3323.1 (  0) 0) |
| [42] |
Hong X, Lu R, Li S. Differences in the Silk Road pattern and its relationship to the North Atlantic Oscillation between early and late summers[J]. Journal of Climate, 2018, 31: 9283-9292. DOI:10.1175/JCLI-D-18-0283.1 (  0) 0) |
| [43] |
Teng H, Leung R, Branstator G, et al. Warming pattern over the Northern Hemisphere midlatitudes in Boreal summer 1979—2020[J]. Journal of Climate, 2022, 35: 3479-3494. DOI:10.1175/JCLI-D-21-0437.1 (  0) 0) |
| [44] |
Takaya K, Nakamura H. A formulation of a phase-independent wave-activity flux for stationary and migratoryquasigeostrophic eddies on a zonally varying basic flow[J]. Journal of the Atmospheric Sciences, 2001, 58: 608-627. DOI:10.1175/1520-0469(2001)058<0608:AFOAPI>2.0.CO;2 (  0) 0) |
| [45] |
Watanabe M, Kimoto M. Atmosphere-ocean thermal coupling in the North Atlantic: A positive feedback[J]. Quarterly Journal of Royal Meteorological Society, 2000, 126: 3343-3369. (  0) 0) |
| [46] |
Rodwell M J, Hoskins B J. Monsoons and the dynamics of deserts[J]. Quarterly Journal of Royal Meteorological Society, 1996, 122: 1385-1404. DOI:10.1002/qj.49712253408 (  0) 0) |
| [47] |
Hong X, Lu R, Chen S, et al. The relationship between the North Atlantic Oscillation and the Silk Road pattern in summer[J]. Journal of Climate, 2022, 45: 6691-6702. (  0) 0) |
| [48] |
Sardeshmukh P D, Hoskins B J. The generation of global rotational flow by steady idealized tropical divergence[J]. Journal of Atmospheric Science, 1988, 45: 1228-1251. DOI:10.1175/1520-0469(1988)045<1228:TGOGRF>2.0.CO;2 (  0) 0) |
| [49] |
Goswami B N, Madhusoodanan M S, Neema C P, et al. A physical mechanism for North Atlantic SST influence on the Indian summer monsoon[J]. Geophysical Research Letters, 2006, 33: L02706. (  0) 0) |
| [50] |
Goswami B N, Xavier P K. ENSO control on the south Asian monsoon through the length of the rainy season[J]. Geophysical Research Letters, 2005, 32: L18717. (  0) 0) |
 2025, Vol. 55


