2. 中山大学海洋科学学院,广东 珠海 528478;
3. 中国海洋大学海洋环境与生态教育部重点实验室,山东 青岛 266100;
4. 青岛市气象局,山东 青岛 266003;
5. 中国海洋大学信息科学与工程学部,山东 青岛 266100
海洋锋是性质明显不同的两种或几种水体之间的狭窄过渡带[1],在锋面处通常伴随着温度、盐度、密度、叶绿素或者悬浮物浓度(Suspended sediment concentration,SSC)等要素水平梯度的强烈变化[2-4]。在河口处,低盐高浊度的河水与高盐低浊度的海水相遇,会形成强烈的河口锋面。锋面的存在限制了其两侧水体的混合和交换,因此河口锋面是河流携带的陆源物质(如营养盐、污染物、泥沙等)向外海扩散的“屏障”,厘清河口锋面的时空变化特征对研究陆源物质向海洋的输运有重要意义。
传统的锋面观测手段是通过调查水体温度、盐度和密度的水平梯度分布特征确定锋面位置[5]。现场观测费时耗力,而且难以对锋面形态进行大范围同步观测。近年来,水色遥感卫星由于可以提供高时空分辨率的海洋表层SSC反演数据,被广泛用于河口和近岸海域的锋面研究[6-8]。学者一般使用水色卫星数据反演SSC,通过计算SSC的梯度值来识别锋面(Suspended sediment fronts,SSF)。SSF通常形成于河口、海岸和浅水架等沉积物来源充足且动态环境变化剧烈的海域,锋面两侧的水体具有显著的浊度差异。SSF的时空变化受多种因素的调制,例如,在南美洲的拉普拉塔河口系统中,SSF的季节和年际变化主要是由径流、风场的变化以及与厄尔尼诺-南方涛动(El Niño-southern oscillation,ENSO)相关的年际变化引起的[9]。在长江口、苏北浅滩、珠江口和韩国西南部海域,当水深足够浅或海水浊度足够低时,海底沉积物可在潮汐、风驱动的垂直混合和上升流等综合作用下产生SSF[6, 10-13]。此外,在英国的康维河口和印度的曼多维河口处水体的环流和分层对SSF的分布有显著影响[14-15]。
黄河是中国第二长河,历史上年均入海径流量为4.9×10¹⁰ m3,输沙量为1.08×10⁹ t,其输沙量居世界第二位[16]。巨量的水沙入海不仅影响黄河河口的水文、地形地貌和生态环境,对中国渤海和黄海的生物地球化学过程也有显著影响[17-18]。黄河口锋面作为河口海区核心的动力过程之一,在黄河入海物质输运和生态环境效应研究方面有重要价值。
早在上世纪80年代,中国学者就开展了黄河口锋面的观测研究,发现黄河口锋面有多层结构,其位置受径流、风和潮流的影响会发生变化[19]。李广雪等[20]在上世纪90年代提出在黄河口羽流区潮流跟河口射流共同作用会形成黄河口潮流切变锋。其后,学者围绕黄河口潮流切变锋的分布特征和调控机制开展了一系列研究[21-25]。2002年中国开始开展黄河调水调沙工程,在几天时间内将大量黄河淡水和泥沙排入渤海,显著扩展了黄河口锋面的范围[26]。学者也围绕黄河调水调沙过程对黄河口锋面的影响开展了大量研究[26-30]。
上述研究主要围绕黄河口羽流区由潮流切变作用产生的锋面开展。除了潮流切变机制,河口及邻近海域的锋面生成机制还有混合机制、辐聚机制和上升流机制。受河口地形、径流、潮流、风浪、浮力效应和地转科氏力的影响[31],河口及邻近海域的锋面位置和强度也会发生变化[32]。因此,除了河口羽流区的潮流切变锋面,在河口及邻近海域还存在其他动力过程导致的多层锋面,其空间尺度从几十米到几十公里不等[6, 33]。最新的渤海SSF研究表明,黄河口及邻近海域存在多层次、多尺度的SSF结构[34]。黄河口高浓度泥沙也不局限于潮流切变锋范围内,卫星观测到的黄河口最大浑浊带面积可达6 360 km2[32]。但是受观测条件的限制,河口切变锋外围的锋面特征鲜有研究。
本文将基于Landsat卫星研究黄河口及邻近海域的SSF分布特征及长期变化。跟以往的研究相比,本文研究的SSF特指河口和近岸海区高浊度水体和外海清澈水体的分界线,研究该锋面的分布特征和变化规律有助于认识黄河口及邻近海域的悬浮物输运过程。另外,前人研究SSF使用的卫星通常为2002年发射的MODIS卫星,或者2010年发射的GOCI卫星[6, 35],观测时间多限于本世纪之后,对1996年改道前锋面的变化了解甚少。本研究通过使用发射时间更早的Landsat卫星数据,观测1984年至今的SSF变化。
1 研究区域、数据与方法 1.1 研究区域黄河是世界上输沙量第二大河,也是含沙量最大的河流,平均每年(1950—2020年)向渤海输运超过8亿t泥沙(数据来源:中国河流泥沙公报,http://www.mwr.gov.cn/)。黄河排放泥沙入海后,70%~90%的泥沙沉积在河口附近[38-39],其余细颗粒泥沙继续输运到渤海和其它海区[17-18]。近年来,由于黄河径流量减少, 大量水库的修建和水土保持工作的开展,黄河的年均输沙量从1956—1968年的12.22亿t锐减到2000—2009年的1.36亿t[40]。巨量泥沙在河口的堆积作用以及人为改道工作的开展使黄河入海口的位置不断变化,1976年黄河口位置由渤海湾迁移到莱州湾清水沟[41-43],1996年黄河口再向北改道至清8汊(见图 1(b))。

|
((a)蓝色三角为水文站,红色方块为气象站; (b) 1为清水沟入海口,2为清8汊入海口。Blue triangle and red squares show the locations of hydrological and meteorological stations, respectively in (a) Number 1 and 2 show the locations of Qingshui Ditch and Qing-8 Branch in (b).) 图 1 (a) 黄河口地形图及(b)黄河口底质分布图[36-37] Fig. 1 (a) Topography of the Yellow River estuary and (b) seabed sediment type in the Yellow River Estuary[36-37] |
黄河口及邻近海域水体悬浮物的沉积和输运显著受到波浪和潮流等动力过程的影响。在东亚季风控制下,渤海冬季盛行北风和西北风,风速4~8 m/s;夏季盛行东南风,风速4~5 m/s[44-45]。黄河口海域的海浪多是局地风生浪,季节差异明显,冬季的海浪大,波高约1~2 m,夏季的海浪小,波高约0.5~1 m[46]。黄河口海域的潮流为往复流,潮区以不规则半日潮为主,平均潮差为0.6~0.8 m,最大潮流速度为0.5~1.0 m/s[47]。
1.2 研究数据用于反演黄河口及邻近海域水体SSC的Landsat遥感数据来源于美国地质调查局官网(https://earthexplorer.usgs.gov/)。Landsat卫星计划是世界上运行时间最长的地球观测计划,于1972年发射第一颗卫星Landsat 1,至今共成功发射8颗卫星(Landsat 6发射失败)。由于Landsat 1、2、3(1972—1983年)卫星图片质量较差,本文选用了Landsat 4、5、7、8(1984—2021年)的Level-1级遥感数据进行分析。Landsat卫星的过境频率为1次/16 d,空间分辨率为30 m。同时,用来校验Landsat反演SSC准确性的遥感数据源自Zhao等[37]基于MODIS卫星反演的2003—2016年SSC数据。与Landsat卫星相比,2002年发射的MODIS卫星具有更高的时间分辨率(1 d),反演的SSC趋势变化拥有很高的准确性。
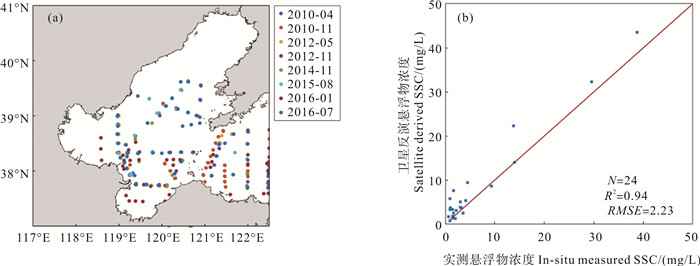
为检验Landsat遥感反射率(Remote sensing reflectance,Rrs)反演SSC的准确性,本文搜集了2010—2016年8个渤海航次超过100个站位(见图 2(a))的SSC现场观测数据。SSC的测量结果通过水样抽滤法获得,共获取了渤海不同季节687个海表的SSC实测值。
|
( 圆点颜色代表不同的航次。Colors represent different cruises. ) 图 2 (a) 渤海现场观测站位分布及(b)卫星反演悬浮物浓度和实测悬浮物浓度对比 Fig. 2 (a) Field observation stations in the Bohai Sea and (b) comparison of satellite derived SSC and measured SSC |
在研究黄河口SSF调控机制时,本研究使用了莱州湾风速、黄河径流量和输沙量的观测数据。其中,风速数据使用了黄河口邻近海域5个气象站(见图 1(a))1984—2021年日均的风速观测数据,包括垦利站、东营站、潍坊站、龙口站和长岛站。1984—2021年逐月的黄河径流和输沙量数据来自利津水文站(见图 1(a))。
1.3 方法 1.3.1 卫星数据处理与验证利用Landsat的Level-1级遥感数据反演SSC之前需要使用遥感图像处理软件SeaDAS(SeaWiFS Data Analysis System,version 8.1.0)进行几何校正、辐射定标和大气校正等预处理工作,得到标准化的遥感反射率。本文使用的大气校正算法为NIR-SWIR,该算法结合了处理浑浊水体的SWIR(Shortwave infrared)方法和标准的NIR(Near-infrared)方法[48],已广泛应用于全球海洋的水色遥感数据处理中,处理近岸浑浊水体时也有较好的效果[49-50]。此外,在冬季莱州湾和渤海湾近岸经常出现海冰[41],海冰的存在会影响SSC反演,需要进行剔除。前人研究表明,陆地、海水和海冰在绿色波段(561 nm)与红色波段(655 nm)之间的光谱差异非常明显[51-52]。对本文所用遥感数据进行统计得出海冰、海水和陆地的绿色和红色波段平均反射率的比值分别为3.79、1.81和0.35。选择黄河口海域所有含海冰的图像,将双波段比值介于1.2~2.8之间的数据作为海冰数据剔除。
基于Landsat数据得到的遥感反射率可以通过Shen等[53-54]提出的半经验半分析(Semi-empirical radiative transfer,SERT)模型转换为SSC(见公式(1)和表 1)。
| $ S S C=\frac{2 \times \alpha \times R_{\mathrm{rs}}}{\beta \times\left(\alpha-R_{\mathrm{rs}}\right)^2} $ | (1) |
|
|
表 1 Landsat卫星不同传感器的波段数据及对应的α、β系数 Table 1 Band of different sensors of Landsat and corresponding α、β coefficient |
式中:α代表遥感反射率的饱和水平;β代表遥感反射率的最大敏感性。
为检验SERT模型在渤海的适用性,本研究将遥感反演的SSC结果与渤海现场观测的SSC进行对比验证。在建立现场观测数据与卫星数据的匹配时,鉴于渤海在时空尺度上高度变化的特点,本研究采用较为严格的匹配方法,具体规则如下:航次数据时间窗口(卫星过境时间与现场测量时间间隔)限定在±3 h内,空间窗口为现场测量位置周围的5×5像素空间内(空间内像素为有效率需在60%以上),像素空间的中心值是最接近测量站点位置的像元点的值。最后,取上述时间和空间条件下的所有有效像元均值作为卫星观测值,最终得到24对匹配点(N=24)。将反演结果和实测结果进行对比检验(见图 2(b)),二者的相关系数R2达到0.94,均方根误差(Root mean squared error,RMSE)为2.23 mg/L。该结果表明SERT模型适用于渤海区域的SSC反演。
本研究将超过300 mg/L的SSC数据进行了剔除,SSC的空间分辨率为30 m×30 m,存在大量椒盐噪声,需要进行二维卷积运算去除噪声(见公式(2))。
| $ f_{\mathrm{s}}(x, y)=\boldsymbol{F}_{\mathrm{s}}(x, y) \otimes\left[\begin{array}{lll} 1 & 1 & 1 \\ 1 & 1 & 1 \\ 1 & 1 & 1 \end{array}\right] 。$ | (2) |
式中:Fs是SSC的矩阵;x和y分别是经向和纬向的SSC;⊗是卷积符号,卷积核为3×3;fs是对Fs进行了平滑处理后的结果。
1.3.2 锋面的提取为提取黄河口及其邻近海域的SSF,本文基于Landsat卫星反演的SSC计算了SSC的水平梯度(见公式(3)),
| $ \boldsymbol{\nabla} f_{\mathrm{s}}=\frac{\partial f_{\mathrm{s}}}{\partial x} i+\frac{\partial f_{\mathrm{s}}}{\partial y} j_。$ | (3) |
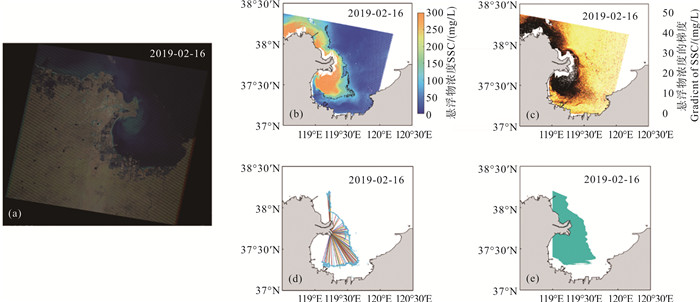
由于黄河口附近海域的SSC在水平方向变化剧烈(见图 3(b)),在高浊度海区内SSC的水平梯度都很高,清澈水体的SSC水平梯度显著低于浑浊水体(见图 3(c))。将所有的真彩色图与SSC的梯度进行对比,发现高浊度水体与清澈水体分界线的浓度梯度介于20~25 (mg/L)/km。因此,本文以22 (mg/L)/km为标准识别黄河口SSF(见图 3(b))。同时将识别的SSF叠加至真彩色图像的对应位置进行比对,将部分存在偏差的锋面进行手动校准。
|
((b)中黑线代表悬浮物锋面;(d)中蓝色曲线为锋线,直线为锋面到河口的距离。The black line represents SSF in (b); The blue curve is the SSF and straight lines are the distance from the SSF to the Yellow River Estuary in (d).) 图 3 (a) Landsat卫星2019年2月16日拍摄的真彩色图、(b)基于Landsat反演的悬浮物浓度、(c)悬浮物浓度梯度的分布(mg/L/km)、(d)锋面到黄河口的距离及(e)锋面包围面积(青色区域) Fig. 3 (a) True color image of Landsat on February 16, 2019, (b) SSC (mg/L) based on Landsat, (c) distribution of SSC's gradient (mg/L/km), (d) distance from the SSF to the Yellow River estuary and (e) area surrounded by the SSF (cyan area) |
本研究通过计算锋面距黄河口的平均距离(平均距离法)和锋面包围高SSC水体面积(包围面积法)两种方法来量化SSF的空间变化情况。平均距离法是计算基于卫星遥感识别的锋面距黄河口的距离。具体计算方法是将识别的锋面等距分为100段,计算100段锋面距离河口的位置,然后求出平均距离(见图 3(d))。其中,锋面识别范围为119°E—120°E,37°N—38.2°N,超出范围的锋面不进行距离计算。包围面积法是在锋面识别范围内计算锋面包围的高SSC水体面积(见图 3(e))。计算每幅图像中锋面包围的像素点的个数,然后经过地理经纬度转换成面积,从而得到锋面包围区域的面积。
由于黄河口的位置在不断变化,本研究在1985—2021年间每隔五年对黄河口岸线进行地理位置统计,将1985、1990、1995、2000、2005、2010、2015和2020年8个年份的岸线经纬度进行平均,得到黄河口经纬度平均值为119.28°N,37.72°E。选择不同锋面计算了距离上述8个时期河口的平均距离,结果表明,因河口位置变化造成的最大误差约为3.5%,在可接受的范围内。因此,本研究的黄河口位置都基于黄河口经纬度平均值进行计算。
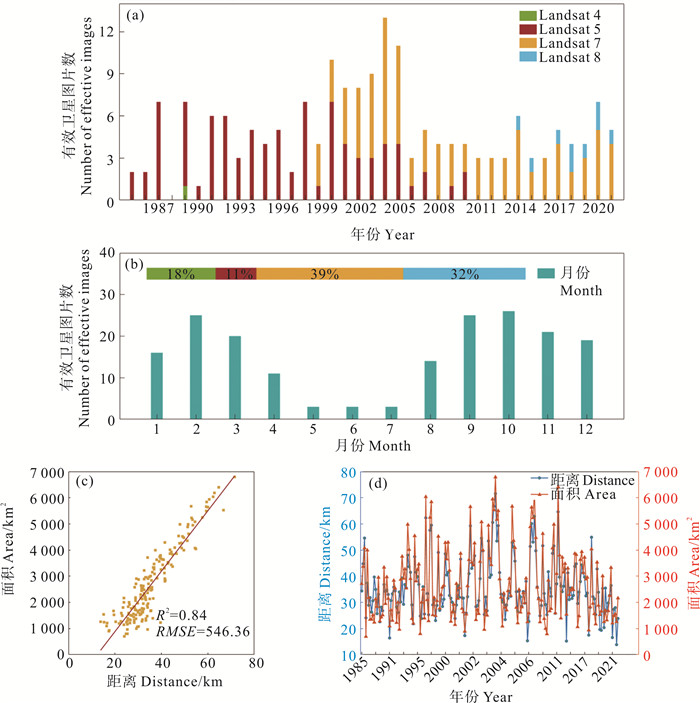
1.3.3 锋面的统计受云遮盖、海雾、霾等因素影响,85%的Landsat遥感图片无法获取完整的黄河口SSF。基于1984—2021年Landsat数据,本文共筛选出186张完整的黄河口SSF进行研究,其中Landsat 4(TM传感器)1幅、Landsat 5(TM传感器)88幅、Landsat 7(ETM+传感器)88幅和Landsat 8(OLI传感器)9幅。有效锋面的年均分布数量为5.02幅,其中2000—2005年的有效数据量较高,2004年有效数据量达到13幅(见图 4(a))。本文统计了有效锋面数在不同月份与季节的分布(见图 4(b)),春季为每年3—5月,夏季为6—8月,秋季为9—11月,冬季为12—2月。结果表明,Landsat观测到的有效数据在秋季最多(72幅),冬季次之(60幅),春季数量较少(34幅),夏季最少(20幅)。将1.3.2节提出的平均距离法和包围面积法应用到1984—2021年Landsat提取的SSF中,得到了SSF距黄河口的距离和SSF所包围面积的长期变化对比(见图 4(d))。平均距离法和包围面积法反映的SSF分布结果一致,相关系数R2达到0.84(见图 4(c)),表明两种方法均可以用来研究黄河口SSF的变化情况。
|
( (b) 中绿、红、橙、蓝四种颜色分别对应春、夏、秋、冬四个季节的有效数据百分比(%)。In (b) the colors of green, red, orange and blue correspond to the percentage of effective data for the seasons of spring, summer, autumn and winter, respectively. ) 图 4 (a) Landsat卫星1984—2021年的有效锋面数量、(b)有效锋面数量在不同月份的分布、(c)“平均距离法”和“包围面积法”计算的锋面特征相关性分析及(d)“平均距离法”和“包围面积法”计算的锋面特征对比 Fig. 4 (a) Numbers of effective SSF from 1984 to 2021, (b) distribution of effective SSF numbers in different months, (c) correlation analysis of SSF features calculated by the "Average distance method" and "Enclosed area method" and (d) comparison of SSF features calculated by the "average distance method" and "enclosed area method" |
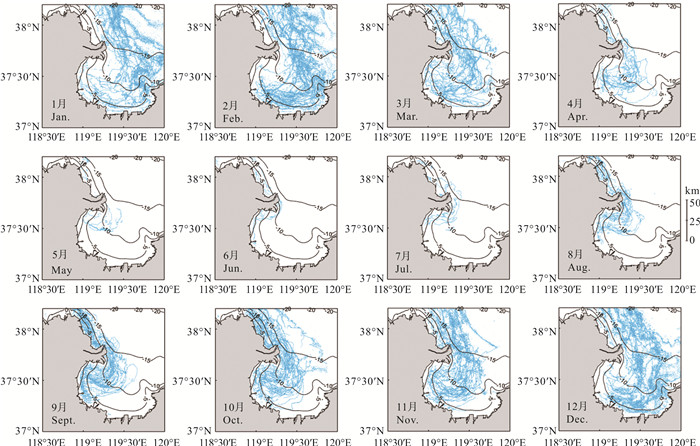
将Landsat卫星获取的1984—2021年SSF进行了逐月统计(见图 5)。结果表明,1—2月的锋面主要分布在距离黄河口35~60 km的海区,锋面的密集分布区域主要分布于莱州湾的南部和中部。3月份锋面开始向黄河口方向收缩,莱州湾中部和南部的SSF密集区向河口回退了约10 km,黄河口北部锋面向黄河口方向收缩了约5 km。4月份锋面进一步向河口靠拢,较3月份回缩了10~15 km,黄河口北面的锋面退缩到15 m等深线以内。由于Landsat从5月开始获得的有效数据大大减少(见图 4(b)),反演的5—7月的有效锋面数量较冬季也大大减少,5—7月锋面基本分布在距离河口5~20 km以内的范围。8—9月份的锋面开始向外扩展,向黄河口南部和东南方向扩展了10~15 km,北部锋面扩展到15 m等深线。10—11月锋面继续向外海扩展,锋面向北扩展超过5 km,向东、向南扩展10 km。12月锋面继续向外海大幅扩展,分布形态与1—2月相似,锋面的密集分布区移动到距离河口40 km以外的莱州湾南部和中部海域。黄河口锋面的包围面积也体现了相同的变化规律,其中1月份的包围面积最大(4 258 km2),6月份的包围面积最小(1 018 km2)。
|
(黑线为等深线。右侧线段为比例尺,单位:km。Black lines represent isobaths.The line segment on the right is the scale bar, Unit: km.) 图 5 1984—2021年悬浮物锋面在1—12月的分布 Fig. 5 Monthly distribution of SSF from 1984 to 2021 |
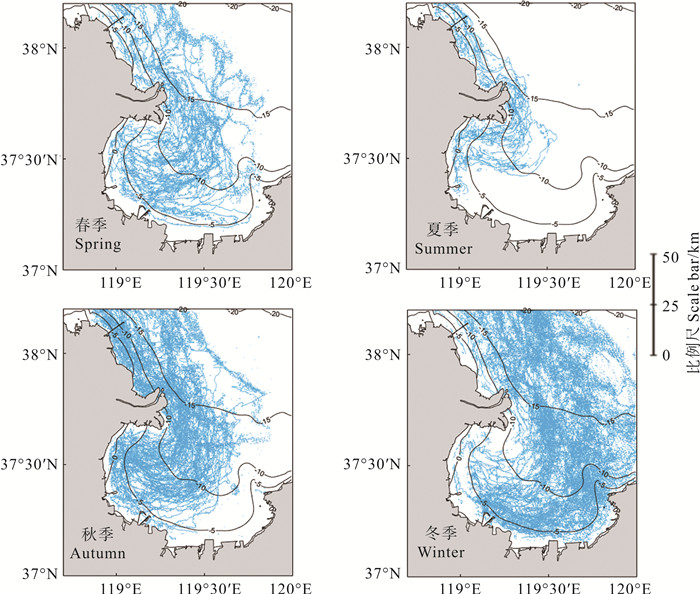
将Landsat卫星反演的1984—2021年黄河口SSF按季节进行分类,得到其季节分布特征(见图 6)。SSF分布表现出显著的季节性差异。春季SSF密集区主要分布在河口外30~40 km,平均距离为31.4 km,平均包围面积为1 981 km2。夏季黄河口海域锋面距河口最近,其平均距离为24.2 km,包围面积为1 240 km2。秋季的锋面分布形态与春季非常相似。冬季黄河口海域锋面距离河口最远,相较于秋季有了明显的扩张,锋面主要分布在莱州湾的中部和南部,距离河口平均距离为45.6 km,包围面积达到了4 060 km2。
|
(黑线为等深线。Black lines represent isobaths.) 图 6 1984—2021年悬浮物锋面的季节分布 Fig. 6 Seasonal distribution of SSF from 1984 to 2021 |
基于实时的卫星遥感数据得到的锋面分布较为散乱(见图 6)。为了更加直观地表现黄河口锋面的季节变化,将1984—2021年Landsat反演的SSC分季节进行平均,得到了黄河口邻近海区多年平均的季节SSC分布(见图 7),按照地理范围计算了黄河口海域(见图 7(a)—(d)中的彩色区域)空间平均的SSC。该区域多年平均的海表SSC在冬季最高,为81.8 mg/L,春秋季次之,分别为41.4和40.9 mg/L,夏季最小,为18.8 mg/L。在春季,黄河口SSC的高值区(>80 mg/L)大多分布在黄河口南部,基于SSC梯度提取的SSF主要分布在距离黄河口30~40 km范围内,锋面两侧SSC从90 mg/L迅速下降到60 mg/L。夏季,研究区域平均SSC迅速降低,SSC高值区收缩到河口附近,在距离黄河口10~15 km范围内,锋面两侧SSC从80 mg/L迅速下降到50 mg/L。秋季SSC高值区和锋面范围与春季相似。冬季SSC为全年最高,锋面的分布范围最大,在距离黄河口40~45 km的范围内,锋面两侧SSC从100 mg/L下降到约70 mg/L。基于多年平均的各季节SSC水平梯度提取的锋面分布特征(见图 7(e))和基于Landsat实时卫星遥感数据提取的锋面分布特征(见图 6)具有较高的一致性。
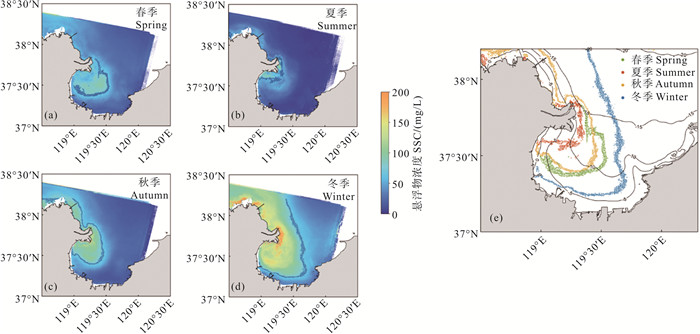
|
( (a)—(d)分别代表春、夏、秋、冬四个季节平均悬浮物浓度的分布,黑线代表基于季节平均的悬浮物浓度梯度识别的悬浮物锋面。(e)季节平均的悬浮物锋面,黑线表示等深线。(a)—(d) Seasonal SSC distributions in spring, summer, autumn and winter, respectively, and the black lines represent the SSFs identified based on the seasonally averaged SSC gradients. (e) Seasonal SSF distribution, black lines represent isobaths and the color lines represent SSF in different seasons. ) 图 7 基于Landsat反演的1984—2021年季节平均悬浮物浓度 Fig. 7 Seasonal SSC based on the Landsat data from 1984 to 2021 |
图 8展示了1984—2021年月均、年均的黄河口SSF平均距离及包围面积时间序列,二者表现出强烈的年际变化。例如,1998—1999、2007—2009、2016—2017年SSF距离河口平均距离及包围面积年降幅超过25%,而1997—1998、2006—2007、2017—2018年SSF距离河口平均距离及包围面积年增幅超过20%(见图 8(a)—(b))。由于平均每年可以获取的锋面有效数仅为5.02幅,而且有效锋面在秋冬季的数据远多于春夏季(见图 4(a)—(b)),所以计算的年均锋面结果存在较大不确定性,无法用于锋面的年际和年代际变化研究。然而,在2.1节中发现黄河口的锋面与SSC在季节尺度上有显著的一致性,本研究进一步分析了Landsat获取的186个黄河口锋面与对应的研究区域平均海表SSC的相关性(见图 8(c))。结果表明黄河口附近海域海表SSC和锋面特征显著相关,R2为0.89。在1984—2021年间,仅有186幅符合锋面研究的Landsat卫星图片,而符合SSC研究的卫星图片有效数据量远高于用于锋面研究的卫星图片(876幅)。由于SSC变化与SSF变化有显著相关性,因此SSC的年际和年代际变化可以代表锋面在相应时间尺度的变化,本研究计算了图 7(a)—(d)中彩色区域的平均SSC。MODIS卫星由于具有更高的时间分辨率(重访周期为1~2 d),因此被广泛用于SSC年际和年代际变化研究[55-57]。经统计,Landsat和MODIS数据反演的2003—2016年月均SSC拥有较高的相关性,R2为0.79。2003—2016年Landsat反演的SSC年际和年代际变化也与MODIS反演的结果一致(见图 9)。因此Landsat卫星具备反演SSC年际和年代际变化的能力(见图 9)。

|
图 8 1984—2021年悬浮物锋面(a)距河口的平均距离、(b)包围面积(km2)的月均(蓝柱)、年均(绿线)时间序列、(c)包围面积和对应的悬浮物浓度平均值相关性分析及(d)黄河口悬浮物浓度(黄线)、锋面距离(红线)和包围面积(绿线)年均时间序列 Fig. 8 Monthy averaged (blue bars) and annual averaged (green line) time series from 1984 to 2021 of (a) distance from the estuary, (b) enclosed area of SSF, (c) correlation analyses between the enclosed area and the SSC and (d) time series of annual averaged SSC (yellow line), average distance (red line) and enclosed area (green line) in the Yellow River Estuary |
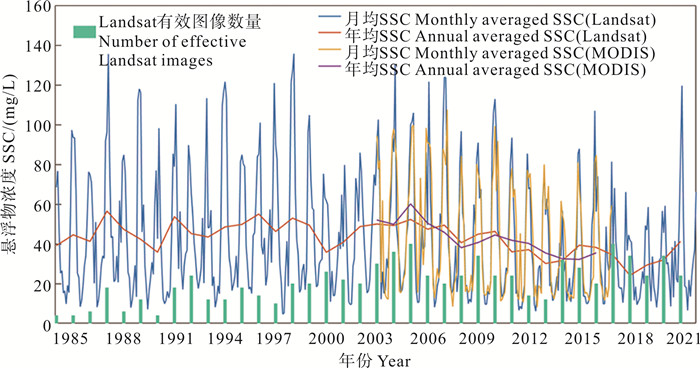
|
(蓝线、红线分别代表基于Landsat反演的悬浮物浓度月均和年均时间序列,黄线、紫线分别代表基于MODIS反演的悬浮物浓度月均和年均时间序列,绿柱代表Landsat有效图像数量。The blue and red lines represent time series of monthly and annual averaged SSC derived from the Landsat, respectively; The yellow and purple lines represent time series of monthly and annual averaged SSC derived from the MODIS, respectively; The green bars represent the effective numbers of the Landsat images.) 图 9 1984—2021年黄河口悬浮物浓度的长期变化 Fig. 9 SSC variations in the Yellow River Estuary from 1984 to 2021 |
本研究采用Mann-Kendall(M-K)趋势检验法分析了黄河口海域1984—2021年月均SSC时间序列,统计值Z为-2.89,表明黄河口附近海域的SSC有显著的年代际下降趋势,通过了99%的置信度检验。线性回归结果表明,黄河口SSC在38 a期间下降了25.6%。SSC在1984—2021年各个季节的下降幅度存在差异,春、夏、秋、冬四个季节分别下降了13.4 mg/L(30.4%)、2.9 mg/L(15.9%)、10.9 mg/L(23.6%)和24.2 mg/L(25.2%)。本研究也发现在2000—2004年和2019—2021年SSC分别有年均5.7%和19.4%的升幅,在1998—1999年和2016—2018年SSC分别有年均10.7%和17.0%的降幅。
由于黄河口SSF跟SSC有显著相关性,因此可以推断SSF也存在显著的年际和年代际变化,在1984—2021年SSF存在显著的向河口方向收缩的趋势,大约收缩了25.6%,SSF在冬季收缩幅度更大。在2005—2014年SSC存在显著下降的趋势,年均降幅为1.76 mg/L(4.1%),总降幅达36.3%。从Landsat识别的黄河口SSF分布也可以看出在10年间SSF显著向河口方向收缩,距离河口的平均距离减小了约33%(见图 10)。
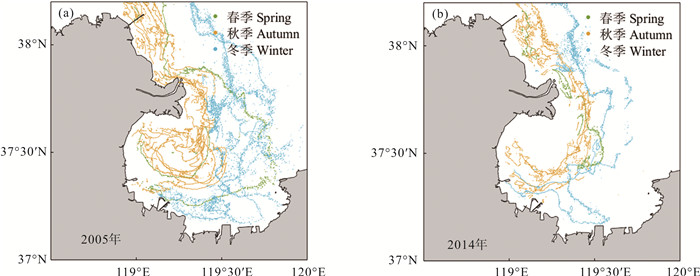
|
图 10 黄河口悬浮物锋面的分布 Fig. 10 Distribution of SSF in the Yellow River Estuary |
SSC的梯度变化导致了SSF的变化。本研究对比了黄河口及邻近海域SSF及SSC在不同季节的空间分布特征,发现两者存在高度的一致性。因此可以推断,引起研究海区SSC季节变化的动力过程会进一步影响SSF的变化。
大量的现场观测、卫星遥感和数值模型研究结果表明,引起该海域SSC季节变化的主导因素是季风[50, 55]。受东亚季风的控制,冬季的高风速增强了水体混合,底剪切应力随之增大,海底的泥沙大量侵蚀并向上输运到水体表层,导致近岸表底层都具有较高的SSC。在水深较深的外海,由于风浪的搅拌作用无法达到海底,底层的沉积物无法输运到海表,水体中的SSC较低,因此,近岸高SSC海区和外海低SSC海区之间形成了锋面。由于冬季高SSC水体范围最大,SSF向外海扩展的距离最远。在夏季,由于风速减弱,水体混合强度减弱,风浪导致的底剪切应力也减小,海底泥沙没有足够的动力输运到表层, 而且夏季存在较强的温跃层,也阻碍了底层泥沙向表层的输运,因此夏季研究区域表层的高SSC只存在于环河口海区,锋面范围最小。春、秋季是冬、夏季之间的转换季节,风和层结对SSF的调制作用也介于冬夏季之间。
影响黄河口及邻近海域SSF空间分布和季节变化的因素较为复杂。需要注意的是,SSF往往不是沿着等深线分布的,仅有少部分锋面在莱州湾南部近岸海域沿着5~10 m等深线分布(见图 6和图 10)。风速、风向的季节性变化和夏季的海水层结均会影响SSF的分布。此外,研究区域海床覆盖的泥沙类型不同(见图 1(b)),如果海床上覆盖的是粗颗粒泥沙,即使风浪搅拌作用可以到达海底,也无法将泥沙侵蚀并悬浮在水体中。虽然黄河入海携带了大量高SSC水体入海,但是这些高SSC水体主要集中在河口附近(见图 7(b)),对整个研究区域的SSF分布影响不大。
3.2 悬浮物锋面年际和年代际变化调控机制分析由于Landsat无法获取足够的有效数据用于分析黄河口及邻近海域的SSF年际和年代际变化趋势,因此还未见有关于SSF年代际变化调控机制的研究。不过目前已经有大量工作研究了黄河口海域SSC的年际和年代际变化的调控机制[32, 55, 58],这些研究结果可以为SSF的年代际变化调控机制提供参考。
最新的研究结果表明,风是导致渤海莱州湾SSC年代际(2003—2016年)变化的主导因素[55]。图 11(a)展示了黄河口附近5个气象站的长期风速时间序列。M-K趋势分析结果显示,黄河口附近的风速在1984—2021年存在显著的下降趋势,降幅在19.3%~40.2%之间,Z值为-2.05,通过了95%的置信度检验。将5个气象站的长期风速平均,发现风速在春冬季较大,在夏秋季较小(见图 12),在春、夏、秋、冬四个季节风速分别下降了2.19 m/s(25.5%)、1.90 m/s(26.6%)、2.09 m/s(28.8%)和1.96 m/s(26.0%)。在本文2.2节中SSC年代际变化结果显示黄河口SSC在四个季节同样存在长期下降的趋势。可以推断黄河口风速的减小导致黄河口SSC降低,进而导致SSF向河口处收缩。

|
图 11 1984—2021年黄河口悬浮物浓度与(a)黄河口邻近气象站年均风速及(b)黄河年径流量和输沙量时间序列 Fig. 11 Time series of annual averaged SSC in the Yellow River estuary versus (a) annual averaged wind speed at meteorological stations and (b) annual runoff and sediment discharge of the Yellow River Estuary from 1984 to 2021 |
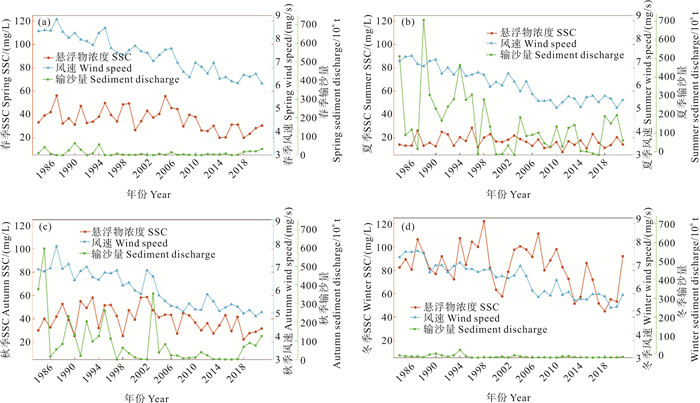
|
( (a)—(d)为春、夏、秋、冬季均悬浮物浓度与气象站季均风速、黄河季均输沙量的时间序列。(a)—(d) represent the time series of spring, summer, autumn and winter averaged SSC versus seasonal averaged wind speed at meteorological stations and seasonal sediment discharge from the Yellow River. ) 图 12 1984—2021年黄河口海域季均悬浮物浓度与季均风速、黄河季节输沙量对比 Fig. 12 Seasonal averaged SSC versus seasonal averaged wind speed and seasonal sediment discharge of the Yellow River in the Yellow River Estuary from 1984 to 2021 |
受人类活动和气候变化的影响,黄河径流量和输沙量也发生了剧烈的变化。1984—2002年,黄河的径流量和输沙量均呈下降趋势,年均降幅分别为5.0%和4.4%(见图 11(b))。2002年起,中国黄河委员会开始进行调水调沙工程,黄河入海径流量和输沙量都有大幅提高。黄河径流和泥沙主要在夏秋季入海,冬春季入海量极少(见图 12)。黄河入海水沙量在1984—2021年春、夏、秋、冬四个季节分别下降了7.83×10⁶ t(46.7%)、178.30×10⁶ t(58.7%)、126.84×10⁶ t(65.5%)和7.92×10⁶ t(62.3%)。黄河入海水沙的变化主要发生在夏秋季,而黄河口SSC的变化主要发生在冬春季,将黄河入海水沙量的年代际变化与黄河口SSC年代际变化对比可以发现两者相差很大,基本不存在相关关系(R2 < 0.05)。因此黄河入海水沙量的减少与黄河口SSC的变化没有直接联系。前人开展了大量关于黄河入海水沙量对黄河口及邻近海域SSC影响的研究,结果也都表明, 黄河入海水沙量变化仅影响入海口附近的SSC,对整个莱州湾范围的SSC长期变化影响较小[32, 55]。
4 结论本文基于1984—2021年Landsat陆地卫星反演的SSC结果研究了黄河口SSF的季节、年际和年代际变化特征,并分析了影响SSF的动力机制。研究发现:
(1) 黄河口及邻近海域的SSF存在显著的变化。季节尺度上,冬季SSF到黄河口的平均距离达到了45.6 km,锋面包围的面积也达到了最大(4 060 km2)。夏季海表SSC急剧下降,黄河口SSF收缩到距河口24.2 km以内,锋面包围面积也缩小到1 240 km2。年际尺度上,SSF存在显著的年际变化,SSF在变化强烈的年份升降幅度可以达到近20%。在年代际尺度上,SSF在1984—2021年存在向河口显著收缩的趋势,大约收缩了25.6%。
(2) 季风是导致SSF季节差异的主要原因。冬季强风使得黄河口及邻近海域沉积物大量再悬浮,导致SSF范围很大,夏季由于风速减弱和水体层结增强,使得SSF范围较小。SSC与黄河口附近气象站、黄河径流输沙的相关性分析表明,风速的年代际下降是导致SSF的年代际收缩的主要原因,黄河水沙量的变化与SSF的变化没有直接相关性。
由于Landsat获取的完整锋面较少,本研究主要是通过统计1984—2021年黄河口SSC变化,定性地推断了SSF的长期变化。未来可以通过提升遥感反演SSC技术,同时结合更先进的锋面提取方法,充分利用现有Landsat卫星图像,从而增加有效SSF的数量,更精确地量化SSF的变化特征。在影响机制方面,本研究将黄河口的SSC与风、黄河水沙数据进行了相关性分析,给出了初步的结论。但是每种因素对SSF的具体作用机制还没有定量研究,需要结合现场观测数据或者数值模型对SSF的影响机制开展更全面的研究。本研究采用的基于SSC梯度的锋面检测法可以识别出高浊度河口和海洋的SSF时空演化特征,同时利用Landsat卫星图像可以进行年代际SSC和SSF变化研究, 对世界其他河口或海域的相关研究有参考意义。
| [1] |
Belkin I M, Cornillon P C, Sherman K. Fronts in large marine ecosystems[J]. Progress in Oceanography, 2009, 81(1-4): 223-236. DOI:10.1016/j.pocean.2009.04.015 (  0) 0) |
| [2] |
He S, Huang D, Zeng D. Double SST fronts observed from MODIS data in the East China Sea off the Zhejiang-Fujian Coast, China[J]. Journal of Marine Systems, 2016, 154: 93-102. DOI:10.1016/j.jmarsys.2015.02.009 (  0) 0) |
| [3] |
Li C, Hu J, Jan S, et al. Winter-spring fronts in Taiwan Strait[J]. Journal of Geophysical Research: Oceans, 2006, 111: C11S13. DOI:10.1029/2005JC003203 (  0) 0) |
| [4] |
Rivas A L, Pisoni J P. Identification, characteristics and seasonal evolution of surface thermal fronts in the Argentinean Continental Shelf[J]. Journal of Marine Systems, 2010, 79(1-2): 134-143. DOI:10.1016/j.jmarsys.2009.07.008 (  0) 0) |
| [5] |
Rascle N, Chapron B, Molemaker J, et al. Monitoring intense oceanic fronts using sea surface roughness: Satellite, airplane and in situ comparison[J]. Journal of Geophysical Research: Oceans, 2020, 125: e2019JC015704. DOI:10.1029/2019JC015704 (  0) 0) |
| [6] |
Du Y, Zhang J, Wei Z, et al. Spatio-temporal variability of suspended sediment fronts (SSFs) on the inner shelf of the East China Sea: The contribution of multiple factors[J]. Journal of Geophysical Research: Oceans, 2022, 127: e2021JC018392. DOI:10.1029/2021JC018392 (  0) 0) |
| [7] |
Ge J, Torres R, Chen C, et al. Influence of suspended sediment front on nutrients and phytoplankton dynamics off the Changjiang Estuary: A FVCOM-ERSEM coupled model experiment[J]. Journal of Marine Systems, 2020, 204: 103292. DOI:10.1016/j.jmarsys.2019.103292 (  0) 0) |
| [8] |
毛政, 王楠, 宋德海, 等. 基于GOCI和FVCOM的黄河口切变锋特征与泥沙输运研究[J]. 中国海洋大学学报(自然科学版), 2022, 52(6): 13-26. Mao Z, Wang N, Song D H, et al. Study on the characteristics of shear front and current transport of sediment in the Yellow River Estuary based on GOCI and FVCOM[J]. Periodical of Ocean University of China, 2022, 52(6): 13-26. DOI:10.16441/j.cnki.hdxb.20210093 (  0) 0) |
| [9] |
Frami & #241;an M B, Brown O B. Study of the R & #237;o de la Plata turbidity front, Part 1: Spatial and temporal distribution[J]. Continental Shelf Research, 1996, 16(10): 1267-1269. (  0) 0) |
| [10] |
Yang H, Oh E, Choi J, et al. Application of geostationary ocean color imager data to the extraction of ocean fronts[J]. Remote Sensing letters, 2016, 7(5): 456-465. DOI:10.1080/2150704X.2016.1149249 (  0) 0) |
| [11] |
Hu Z, Pan D, He X, et al. Diurnal variability of turbidity fronts observed by geostationary satellite ocean color remote sensing[J]. Remote Sensing, 2016, 8(2): 147-161. DOI:10.3390/rs8020147 (  0) 0) |
| [12] |
Zhi H, Wu H, Wu J, et al. River plume rooted on the sea-floor: Seasonal and spring-neap variability of the Pearl River plume front[J]. Frontiers in Marine Science, 2022, 9: 791948. DOI:10.3389/fmars.2022.791948 (  0) 0) |
| [13] |
Zhou Y, Xuan J, Huang D. Tidal variation of total suspended solids over the Yangtze Bank based on the geostationary ocean color imager[J]. Science China Earth Sciences, 2020, 63(9): 1381-1389. DOI:10.1007/s11430-019-9618-7 (  0) 0) |
| [14] |
Vijith V, Shetye S R, Baetens K, et al. Residual estuarine circulation in the Mandovi, a monsoonal estuary: A three-dimensional model study[J]. Estuarine, Coastal and Shelf Science, 2016(173): 79-92. (  0) 0) |
| [15] |
Howlett E R, Bowers D G, Malarkey J, et al. Stratification in the presence of an axial convergent front: Causes and implications[J]. Estuarine, Coastal and Shelf Science, 2015(161): 1-10. (  0) 0) |
| [16] |
Milliman J D, Meade R H. World-wide delivery of river sediment to the Oceans[J]. The Journal of Geology, 1983, 91(1): 1-21. DOI:10.1086/628741 (  0) 0) |
| [17] |
Bian C, Jiang W, Greatbatch R J. An exploratory model study of sediment transport sources and deposits in the Bohai Sea, Yellow Sea, and East China Sea[J]. Journal of Geophysical Research: Oceans, 2013, 118(11): 5908-5923. DOI:10.1002/2013JC009116 (  0) 0) |
| [18] |
Yang Z S, Liu J P. A unique Yellow River-derived distal subaqueous delta in the Yellow Sea[J]. Marine Geology, 2007, 240(1): 169-176. (  0) 0) |
| [19] |
刘风岳. 黄河冲淡水及其混合锋面的观测研究[J]. 海洋科学, 1989(5): 33-36. Liu F Y. Observation of Yellow River plume and its frontal zone[J]. Marine Science, 1989(5): 33-36. (  0) 0) |
| [20] |
李广雪. 现代黄河口区流场切变带[J]. 科学通报, 1994, 39(10): 928-932. Li G X. The shear zone of the flow field in the modern Yellow River mouth region[J]. Chinese Science Bulletin, 1994, 39(10): 928-932. (  0) 0) |
| [21] |
Li G, Tang Z, Yue S, et al. Sedimentation in the shear front off the Yellow River Mouth[J]. Continental Shelf Research, 2001, 21(6): 607-625. (  0) 0) |
| [22] |
Qiao L L, Bao X W, Wu D X, et al. Numerical study of generation of the tidal shear front off the Yellow River Mouth[J]. Continental Shelf Research, 2008, 28(14): 1782-1790. DOI:10.1016/j.csr.2008.04.007 (  0) 0) |
| [23] |
Wang H, Yang Z, Li Y, et al. Dispersal pattern of suspended sediment in the shear frontal zone off the Huanghe (Yellow River) Mouth[J]. Continental Shelf Research, 2007, 27(6): 854-871. DOI:10.1016/j.csr.2006.12.002 (  0) 0) |
| [24] |
Wang N, Qiao L, Li G, et al. Numerical study on seasonal transportation of the suspended sediments in the Modern Yellow River Mouth effected by the artificial water and sediment regulation[J]. Journal of Ocean University of China, 2019, 18(1): 20-30. DOI:10.1007/s11802-019-3646-7 (  0) 0) |
| [25] |
王厚杰, 杨作升, 毕乃双. 黄河口泥沙输运三维数值模拟Ⅰ——黄河口切变锋[J]. 泥沙研究, 2006(2): 1-9. Wang H J, Yang Z S, Bi N S. 3-D simulation of the suspended sediment transport in the Yellow River mouth Ⅰ: Shear front off the Yellow River mouth[J]. Journal of Sediment Research, 2006(2): 1-9. DOI:10.3321/j.issn:0468-155X.2006.02.001 (  0) 0) |
| [26] |
毕乃双, 杨作升, 王厚杰, 等. 黄河调水调沙期间黄河入海水沙的扩散与通量[J]. 海洋地质与第四纪地质, 2010, 30(2): 27-34. Bi N S, Yang Z S, Wang H J, et al. Characteristics of dispersal of the Yellow River water and sediment to the sea during water-sediment regulation period of the Yellow River and its dynamic mechanisms[J]. Marine Geology & Quaternary Geology, 2010, 30(2): 27-34. (  0) 0) |
| [27] |
胡小雷, 陈沈良, 刘小喜, 等. 2012年调水调沙期间黄河口水沙扩散途径及范围[J]. 泥沙研究, 2014(3): 49-56. Hu X L, Chen S L, Liu X X, et al. Diffusion path and range of water flow and sediment in Yellow River Estuary during water-sediment regulation in 2012[J]. Journal of Sediment Research, 2014(3): 49-56. (  0) 0) |
| [28] |
王柯萌, 孙永福, 宋玉鹏, 等. 调水调沙对黄河三角洲切变锋及冲淡水扩散的影响[J]. 海洋科学进展, 2019, 37(4): 551-564. Wang K M, Sun Y F, Song Y P, et al. Characteristics of shear fronts and dispersal of diluted water during the water-sediment regulation scheme in Yellow River Delta[J]. Advances in Marine Science, 2019, 37(4): 551-564. (  0) 0) |
| [29] |
王玉成. 黄河调水影响下河口区盐度分布的观测与模拟研究[D]. 青岛: 中国海洋大学海洋环境学院, 2010. Wang Y C. Study on Response of Salinity Distribution Around the Yellow River Mouth to Abrupt Change in River Discharge with In-Situ Observation and Numerical Simulation[D]. Qingdao: College of Marine Environment, Ocean University of China, 2010. (  0) 0) |
| [30] |
徐丛亮, 李金萍, 谷硕, 等. 黄河调水调沙入海切变锋分析[J]. 人民黄河, 2014(1): 18-21. Xu C L, Li J P, Gu S, et al. Preliminarystudy on shear front off the Yellow River Mouth during the water and sediment regulation[J]. Yellow River, 2014(1): 18-21. (  0) 0) |
| [31] |
Horner-Devine A R, Hetland R D, Mac Donald D G. Mixing and transport in coastal river plumes[J]. Annual Review of Fluid Mechanics, 2015, 47(1): 569-594. DOI:10.1146/annurev-fluid-010313-141408 (  0) 0) |
| [32] |
Chang M, Li P, Sun Y, et al. Mapping dynamic turbidity maximum zone of the Yellow River Estuary from 38 Years of landsat imagery[J]. Remote Sensing, 2022, 14(15): 3782-3801. DOI:10.3390/rs14153782 (  0) 0) |
| [33] |
O'Donnell J, Ackleson S G, Levine E R. On the spatial scales of a river plume[J]. Journal of Geophysical Research: Oceans, 2008, 113: C04017. DOI:10.1029/2007JC004440 (  0) 0) |
| [34] |
Du Y, Zhang J, Bian C, et al. Multiscale spatio-temporal variations of suspended sediment fronts in the semi-enclosed Bohai Sea, China[J]. Journal of Geophysical Research: Oceans, 2023, 128: e2023JC019773. DOI:10.1029/2023JC019773 (  0) 0) |
| [35] |
Cheng Z, Wang X, Paull D, et al. Application of the geostationary ocean color imager to mapping the diurnal and seasonal variability of surface suspended matter in a macro-tidal estuary[J]. Remote Sensing, 2016, 8(3): 244-264. DOI:10.3390/rs8030244 (  0) 0) |
| [36] |
李广雪, 薛春汀. 黄河水下三角洲沉积厚度、沉积速率及砂体形态[J]. 海洋地质与第四纪地质, 1993, 13(4): 35-44. Li G X, Xue C T. Sediment thickness, sedimentation rate and silt body shape of the Yellow River subaqueous delta lobe[J]. Marine Geology & Quaternary Geology, 1993, 13(4): 35-44. (  0) 0) |
| [37] |
黄学勇, 张戈, 高茂生, 等. 渤海莱州湾西南部沉积区划分与分区粒度特征[J]. 第四纪研究, 2019, 39(6): 1414-1427. Huang X Y, Zhang G, Gao M S, et al. Sedimentary area division and regional granularity characteristics in south-western Laizhou Bay, Bohai Sea[J]. Quaternary Sciences, 2019, 39(6): 1414-1427. (  0) 0) |
| [38] |
Bornhold B D, Yang Z, Keller G H, et al. Sedimentary framework of the modern Huanghe (Yellow River) Delta[J]. Geo-Marine Letters, 1986, 6(2): 77-83. DOI:10.1007/BF02281643 (  0) 0) |
| [39] |
Martin J M, Zhang J, Shi M C, et al. Actual flux of the Huanghe (Yellow River) sediment to the Western Pacific Ocean[J]. Netherlands Journal of Sea Research, 1993, 31(3): 243-254. DOI:10.1016/0077-7579(93)90025-N (  0) 0) |
| [40] |
张佳, 王厚杰, 张勇, 等. 黄河中游主要支流输沙量变化对黄河入海泥沙通量的影响[J]. 海洋地质与第四纪地质, 2012, 32(3): 21-30. Zhang J, Wang H J, Zhang Y, et al. Variation of sediment load at the major tributaries in the middle reaches of Yellow River and its impacts on the sediment flux to the sea[J]. Marine Geology & Quaternary Geology, 2012, 32(3): 21-30. (  0) 0) |
| [41] |
Bian C, Jiang W, Pohlmann T, et al. Hydrography-physical description of the Bohai Sea[J]. Journal of Coastal Research, 2016, 74(74): 1-12. (  0) 0) |
| [42] |
Chu Z X, Sun X G, Zhai S K, et al. Changing pattern of accretion/erosion of the modern Yellow River (Huanghe) subaerial delta, China: Based on remote sensing images[J]. Marine Geology, 2006, 227(1-2): 13-30. DOI:10.1016/j.margeo.2005.11.013 (  0) 0) |
| [43] |
Kong D, Miao C, Borthwick A G L, et al. Evolution of the Yellow River Delta and its relationship with runoff and sediment load from 1983 to 2011[J]. Journal of Hydrology, 2015, 520: 157-167. DOI:10.1016/j.jhydrol.2014.09.038 (  0) 0) |
| [44] |
任惠茹, 李国胜, 郭腾蛟, 等. 1950—2011年渤海地区海表风场的季节特征与多尺度变化分析[J]. 地理科学, 2017, 37(9): 1430-1438. Ren H R, Li G S, Guo T J, et al. Multi-scale variability of surface wind direction and speed on the Bohai Sea in 1950—2011[J]. Scientia Geographica Sinica, 2017, 37(9): 1430-1438. (  0) 0) |
| [45] |
徐经纬, 张秀芝, 罗勇, 等. QuikSCAT卫星遥感风场可靠性分析及其揭示的中国近海风速分布[J]. 海洋学报, 2013, 35(5): 76-86. Xu J W, Zhang X Z, Luo Y, et al. The validation analysis of QuikSCAT wind speed and the wind distribution in China's offshore areas[J]. Acta Oceanologica Sinic, 2013, 35(5): 76-86. (  0) 0) |
| [46] |
Bi N, Yang Z, Wang H, et al. Sediment dispersion pattern off the present Huanghe (Yellow River) Subdelta and its dynamic mechanism during normal river discharge period[J]. Estuarine, Coastal and Shelf Science, 2010, 86(3): 352-362. DOI:10.1016/j.ecss.2009.06.005 (  0) 0) |
| [47] |
程义吉, 程建刚. 黄河口新口门海域流场分析[J]. 海岸工程, 2000, 19(4): 5-11. Cheng Y J, Cheng J G. Analysis of the current field in the new Yellow River Entrance sea area[J]. Coastal Engineering, 2000, 19(4): 5-11. (  0) 0) |
| [48] |
Wang M, Shi W. The NIR-SWIR combined atmospheric correction approach for MODIS ocean color data processing[J]. Optics Express, 2007, 15(24): 22-33. (  0) 0) |
| [49] |
Tan X, Sun B, Wang G, et al. Consecutive retrieval of aerosol optical depth and total suspended solid concentration in turbid coastal water of Eastern China[J]. Journal of Quantitative Spectroscopy and Radiative Transfer, 2022, 287: 108231. (  0) 0) |
| [50] |
Wang S, Ming S, Ma Y, et al. Application of remote sensing to identify and monitor seasonal and interannual changes of water turbidity in Yellow River Estuary, China[J]. Journal of Geophysical Research: Oceans, 2019, 124(7): 4904-4917. (  0) 0) |
| [51] |
Huang J, Guo L, Jiang T, et al. Three decades of sea-ice variability in Jiaozhou Bay revealed by landsat observations[J]. Journal of Ocean University of China, 2019, 18(2): 349-357. (  0) 0) |
| [52] |
Shi W, Wang M. Sea ice optical properties in the Bohai Sea measured by MODIS-Aqua[J]. Remote Sensing of the Coastal Ocean, Land, and Atmosphere Environment, 2010, 78580L: 1-8. (  0) 0) |
| [53] |
Shen F, Verhoef W, Zhou Y, et al. Satellite estimates of wide-range suspended sediment concentrations in Changjiang (Yangtze) Estuary using MERIS data[J]. Estuaries and Coasts, 2010, 33(6): 1420-1429. (  0) 0) |
| [54] |
Shen F, Zhou Y, Li J, et al. Remotely sensed variability of the suspended sediment concentration and its response to decreased river discharge in the Yangtze Estuary and adjacent coast[J]. Continental Shelf Research, 2013, 69: 52-61. (  0) 0) |
| [55] |
Zhao G, Jiang W, Wang T, et al. Decadal variation and regulation mechanisms of the suspended sediment concentration in the Bohai Sea, China[J]. Journal of Geophysical Research: Oceans, 2022, 127: e2021JC017699. DOI:10.1029/2021JC017699 (  0) 0) |
| [56] |
Zhou Z, Bian C, Chen S, et al. Sediment concentration variations in the East China Seas over multiple timescales indicated by satellite observations[J]. Journal of Marine Systems, 2020, 212: 103430. (  0) 0) |
| [57] |
Zhou Z, Bian C, Wang C, et al. Quantitative assessment on multiple timescale features and dynamics of sea surface suspended sediment concentration using remote sensing data[J]. Journal of Geophysical Research: Oceans, 2017, 122(11): 8739-8752. (  0) 0) |
| [58] |
Zhang M, Dong Q, Cui T, et al. Suspended sediment monitoring and assessment for Yellow River Estuary from Landsat TM and ETM+ imagery[J]. Remote Sensing of Environment, 2014, 146: 136-147. (  0) 0) |
2. School of Marine Sciences, Sun Yat-Sen University, Zhuhai 528478, China;
3. Key Laboratory of Marine Environment and Ecology, Ministry of Education, Ocean University of China, Qingdao 266100, China;
4. Qingdao Meteorological Bureau, Qingdao 266003, China;
5. Faculty of Information Science and Engineering, Ocean University of China, Qingdao 266100, China
 2025, Vol. 55


