2) School of Resources and Materials, Northeastern University at Qinhuangdao, Qinhuangdao 066004, China;
3) PLA Information Engineering University, Zhengzhou 450001, China;
4) School of Marine Science, Sun Yat-Sen University, Zhuhai 519082, China
Wave breaking is important for air-sea interaction processes, which can be expressed as whitecap coverage (W) for easier observation and better description. The parameterizations of W are of great interest and traditionally fitted to 10-m wind speed over sea surface (U10) (Monahan, 1971; Hanson and Phillips, 1999; Stramska and Petelski, 2003). As certain differences exist amongU10, only W parameterizations are used in various studies. A considerable effort has been exerted to find other parameters, such as field statistics and meteorological factors, for new W parameterizations. Till now, the overall parameters used for estimating W can be divided into two kinds: one is the U10-related parameters, such as friction velocity (u*) and wind sea Reynolds number (RH) (Wu, 1979; Guan et al., 2007; Yuan et al., 2009), the other is named secondary factors or U10 absence parameters, including current velocity (Ucurrent), thermal stability of the lower atmosphere, seawater temperature, and fetch (Wu, 1988; Xu et al., 2000; Callaghan et al., 2008; Salisbury et al., 2013).
Anguelova and Webster (2006), Ren et al. (2016), and Brumer et al. (2017) provided a chronological listing of whitecap fraction datasets during the period of 1971–2004, 1963–2013, and 2007–2016, respectively. The U10-related W power law functions can be influenced by currents due to wave current interaction (Khojasteh et al., 2018). When the along-wind current velocity is large enough, Haus (2007) found that the relative winds shifted by the currents, thereby affecting wave growth rates.Pearman et al. (2014) showed that the effect of the current field on the swell is negligible. Nevertheless, for the wind wave high-frequency tail of wave spectral, steepening on the opposing current may contribute to thewave breaking dissipation or observed decay. Novel airborne observationsaccomplished by Romero et al. (2017)over areas withstrong wavecurrent interactionsshowedmaximum vertical vorticity with a largeW because of strengthened wave breaking.
Currents indeed have an influence on W, which may change the 'effective-U10' for wave growth. For example, although theU10 is in the range of 7–8ms-1, Kraan et al. (1996) found no visual whitecaps and suggested that the absence of whitecaps was caused by strong tidal currents of up to 1 ms-1. Callaghan et al. (2008) believed that a directionalalignment of wind and currentaccompanied by an increase inUcurrent produceda marked increase in W. Meanwhile, the measurements of W in the presence of the recorded magnitude and direction ofcurrents are scarce. Therefore, the manner in which currents work is unclear.
Apart from currents, swells are also under our consideration if they have the same effect as the currents on W(Zheng et al., 2019a, 2019b, 2020). Woolf (2005) proposed the importance of swells for W. Sugihara et al. (2007) and Callaghan et al. (2008) indicated that whitecaps tend to be suppressed by the presence of swells, especially under the condition of opposing swells. Hwang et al. (2013) believed that swells could promote whitecaps.
On the basis of the data measured by ship, we attempt to further explore how currents and swells affect W and determine if they influence W in the same way. The following are the remaining parts of the paper. Section 2 introduces the data used in this study. Section 3 discusses how the magnitudes and directions of currents and swells influence W and proposes the improved power fits of W to U10-related parameters on the basis of the current calibrated-U10. Section 4 describes some important conclusions.
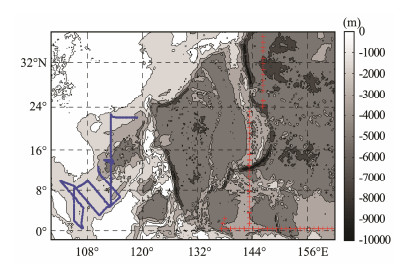
2 Whitecap ObservationMeteorological and oceanographic data were collected from two cruises by Dongfanghong2 from Ocean University of China: the South China Sea cruise from December 5, 2013 to January 4, 2014 and the Western Pacific Ocean cruise from November 7, 2015 to January 7, 2016. The two projects focused on the study areas around 102˚–115˚E, 1˚S–21˚N and 135˚–161˚E, 1˚S–36˚N (Fig. 1).
|
Fig. 1 A map showing the geography of the zone and trajectory of the scientific cruises. The blue stars and red pluses represent the South China Sea cruise and the Western Pacific Ocean cruise, respectively. |
The field statistics of waves and currents were continually recorded by the X-band Radar of WaMoSII and measured by the Waverider and Conductance Temperature Depth at some fixed stations. Meteorological parameters were obtained by the automatic weather station, 16m in height above the sea surface. The observed wind speed values were corrected to U10 on the basis of the logarithmic wind profile formula. The measurements of W were manually taken by a camera on the top of the vessel, and then Wwas extracted from photographs using the automated whitecap extraction (AWE) method proposed by Callaghan and White (2009) and the improved AWE algorithm proposed by Jia and Zhao (2019).
Here is a brief description of the improved AWE algorithm, that is, how the photos of the sea surface are converted to values of W. For traditional AWE, each photo is first converted into a grayscale image with pixels ranging from 0 to 1, and the percentage increase in pixels is used to obtain potential thresholds for separating whitecaps with background water. To reduce the influence of strong sunlight, the light distribution and brightness contrast of the measured photo are adjusted by Jia and Zhao (2019) to obtain a precise intensity threshold. A W value is then acquired after computing the ratio of white pixels to black pixels on the basis of the intensity threshold. Data are divided into two subsets: the deflection angle between the propagating directions of wind and current smaller (greater) than 90˚ is denoted as |Dwind-Dcurrent| < 90˚ (> 90˚), indicating the alignment (encounter) of wind and current. Considering the effect of currents onW, U10 is calibrated on the basis of the above deflection angles. Using the least square method, U10 and current calibrated-U10 dependent parameterizations are individually fitted to each dataset and combined. Two fit statistics of correlation coefficients (R2) and root mean square error (RMSE) are introduced to evaluate the parameterizations. Parameterization equations with higher R2 and lower RMSE provide better results.
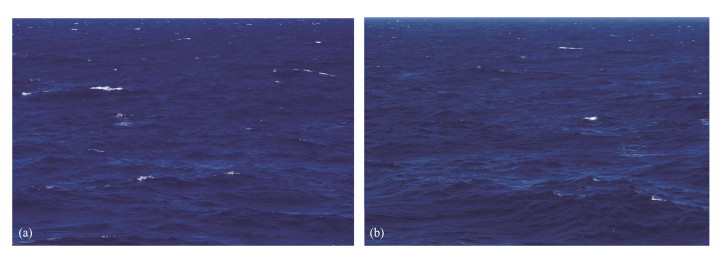
3 Results and Discussion 3.1 Influence of Currents on WU10 is the most traditional and effective way of estimating W. To discover the effect of currents on W, Fig. 2 shows two original whitecap images taken during the Western Pacific Ocean cruise under the same U10 condition. Other meteorological information, wave parameters, and Wlisted in Table 1 are different for images (a) and (b). Although U10 is identical, the wave heights of mixed wave, swell, and wind wave for image (a) are much higher than those for image (b), which may be due to the effect of currents(Haus, 2007). Moreover, additional whitecaps can be seen from image (a), and a highW (0.3486 in %) is obtained after averaging several hundreds of whitecap images taken at the same station asimage (a). However, averaged W is only equal to 0.1474 forimage (b).
|
Fig. 2 Two original whitecap images taken during the western Pacific Ocean cruise under the same wind speed condition. Meteorological information, wave parameters, and the whitecap ratio W (%) for (a) and (b) are listed in Table 1. |
|
|
Table 1 Summary of the meteorological and oceanographic conditions |
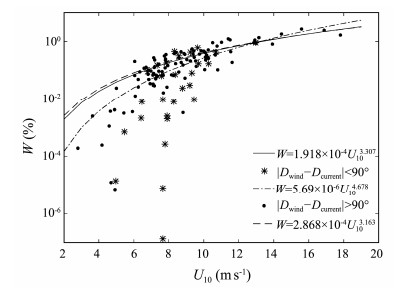
The datasets analyzed here display nosignificant Ucurrent dependence (not shown), reminding us to find a new way to study the influence of currents on W. The datasets are divided into two subsets to refit the W(U10) power laws: winds with following currents and winds with opposing currents. The parameterizations of Ware displayed in Table 2 and Fig. 3 where winds with followingcurrents labeled by a dot-dashed line obtain a smallW, whereas winds with opposing currents obtain a great W. The direction difference between winds and currents(represented by |Dwind-Dcurrent| where Dwind and Dcurrent are directions of wind and current, respectively) can impact the W powerlaws, and the opposing (following) currentsare suggested to increase(decrease)W. |Dwind-Dcurrent| should be considered for the continued improvement of whitecap parameterizations.Intrigued by these findings, we introduce Ucurrent into whitecap parameterizations when considering the direction deviation of currents with winds.
|
|
Table 2 Parameterizations of W (%) as a function of U10 and Ucurrent calibrated-U10 (marked by ΔU) |
|
Fig. 3 Dependence of W (%) on U10. The curves symbolize the best fit to the different datasets of Numbers 1–3 in Table 2: solid line, dot-dashed line, and dashed line are fitted by all winds, winds with following currents, and winds with opposing currents, respectively. Stars and dots represent averaged W (%) when the winds and currents have a consistent and opposite direction, respectively. |
U10 only W parameterization, the most traditional and effective way of estimating W, is improved by including wave field related parameters in this study. Considering the effect of currents on wave breaking, adjusting the parameters to include the Ucurrent in theU10 based W parameterization is performed in this section according to the value of |Dwind-Dcurrent|. That is, U10 is calibrated with different methods separately for winds with following or opposing currents. When the value of |Dwind-Dcurrent| is smaller than 90˚, U10 is calibrated by subtracting the Ucurrent from U10 because the directional alignment of winds and currents accompanied by small wave steepness can weaken the wave breaking. On the contrary, when |Dwind-Dcurrent| is greater than 90˚, ΔUequals U10 is calibrated by adding the parallel velocity component of opposing currents. The calibrated-U10 marked by ΔU are as follows:
| $ \Delta U=U_{10}-U_{\text {current }} \text {, when }\left|D_{\text {wind }}-D_{\text {curent }}\right| <90^{\circ} , $ | (1) |
| $ \begin{array}{r} \Delta U=U_{10}+U_{\text {current }} \cos \left(180-\mid D_{\text {wind }}-D_{\text {current }}\right) \\ \text { when } \mid D_{\text {wind }}-D_{\text {current }}>90^{\circ}. \end{array} $ | (2) |
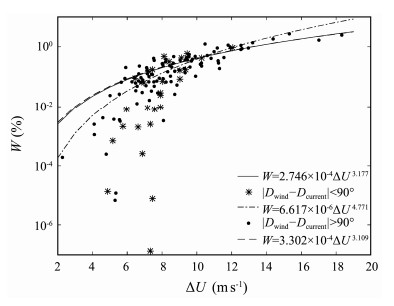
ΔU based W parameterizationsare refitted and displayed in Fig. 4, which shows the same conclusions as those in Fig. 3. For the directional alignment of wind and current situations, R2 increases from 0.5995 to 0.7107 and RMSE decreases from 0.1461 to 0.1242 when comparing the results in Rows 2 and 5 of Table 2. For the opposing current situation in Rows 3 and 6 of Table 2, we obtain the consistent conclusion that R2 increases up to 0.8048 accompanied by a decreasing RMSE. For the fit with the combined dataset, ΔU based W parameterization provides a better fit than that fitted to U10. Moreover, thelast column in Table 2 presents that the improvement of goodness of fit for the following current situation is the most significant; the increase rate ofR2 is up to 18.55%, and the decrease rate of RMSE is down to -15.00%. In summary, ΔU based parameterizations show tighter correlations and better interdataset agreement than U10only parameterizations for the methods of calibrating U10 in Eqs. (1) and (2).
|
Fig. 4 Dependence of W (%) on ΔU. ΔU (as in Eq. (1)) represents the difference between U10 and the velocity of following currents for star data and dot-dashed line. ΔU (as in Eq. (2)) represents the sum of U10 and the parallel velocity component of opposing currents for dot data and dashed line. ΔU for solid line is a combination of the two ΔU above. |
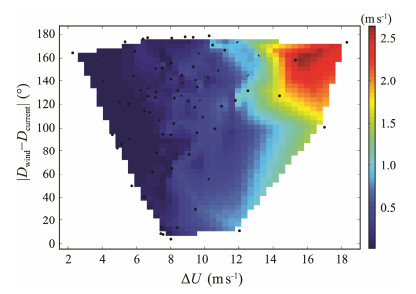
Inspired by the occurrences above, the contour map, which includes the combined effect of the difference in the magnitudes and directions of winds and currents, is displayed in Fig. 5. Specifically, the contour suggests the effect of the magnitude and direction of currents on W. We already fit the W to U10–Ucurrent regardless of |Dwind-Dcurrent| (not shown). It shows that the greaterU10–Ucurrent makes, the higher W, as expected, which can also be inferred from Fig. 5. Certainly, the improved parameterizations of W, as a function of U10–Ucurrent, are still worse than those of W fitted to ΔU in Fig. 4. Therefore, we confirm again that the currents significantly influence W and must be considered to calibrate-U10 before fitting W to U10-related parameters.
|
Fig. 5 W (%) as a function of ΔU and |Dwind−Dcurrent|. Black dots represent the original observations. |
Many parameterizations of W, as a function of u*, have been used in previous studies (Lafon et al., 2007; Sugihara et al., 2007; Schwendeman and Thomson, 2015; Brumer et al., 2017). u* can be obtained through Eq. (3):
| $\tau = {\rho _a}u_*^2 = {\rho _a}{C_{D10}}U_{10}^2,$ | (3) |
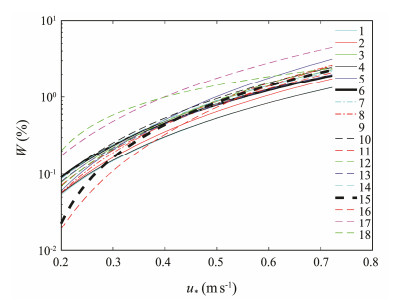
where τ is the wind stress, and ρa is the air density. CD10 represents a 10m drag coefficient over sea surface. The CD10used for calculating u* from previous studies here is displayed in Fig. 6 and summarized in Table 3.Compared with the fit statistics of formula from 1 to 14, CD10 from Sheppard et al. (1972) should be the best choice, and this u* can be applied for further analysis hereafter (Row 6 in Table 3). The fit to the calculated u* most closely follows that proposed by Schwendeman and Thomson (2015), as shown in Fig. 6.
|
Fig. 6 W (%), as a function of u* calculated using a different CD10 formula concluded in Table 3, corresponds to lines 1–14. Lines 15, 16, 17, and 18 represent W (u*) power law fit summarized in Schwendeman and Thomson (2015), Sugihara et al. (2007), Lafon et al. (2007), and Brumer et al. (2017), respectively. |
|
|
Table 3 Parameterizations of W (%) as a function of u* and RH |
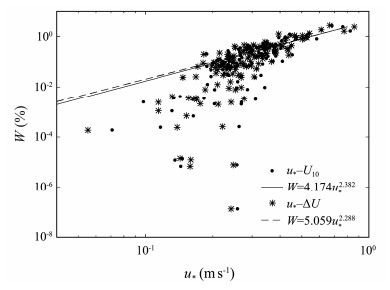
The calculated u* based on the CD10 from Sheppard et al. (1972) is applied to obtain W (u*) parameterization. Following the same approach discussed in Section 3.1, the parameterizations ofW, as a function of u*, are determined by fitting the two subsets of data as defined, and the results are illustrated in Fig. 7. Plots of the u*, as a function of ΔU, are shown here to illustrate the important influence of currents on W. For example, R2 increasing from 0.7668 to 0.7958 and RMSE decreasing from 0.2157 to 0.2018 confirm the effect of currents on u* based parameterizations. Overall, better fits are found when u* is expressed as a function of ΔU instead of U10, as in the case of U10 only parameterizations in Table 2.
|
Fig. 7 Dependence of W (%) on u*. u* – U10 (dots) and u* – ΔU (stars) refer to the parameters of u* calculated using U10 and ΔU in Table 2, respectively. The corresponding best fit to u* is shown by the solid line and dashed line. |
The calculated u* based on the CD10 from Sheppard et al. (1972) is applied to obtain W (u*) parameterization. Following the same approach discussed in Section 3.1, the parameterizations ofW, as a function of u*, are determined by fitting the two subsets of data as defined, and the results are illustrated in Fig. 7. Plots of the u*, as a function of ΔU, are shown here to illustrate the important influence of currents on W. For example, R2 increasing from 0.7668 to 0.7958 and RMSE decreasing from 0.2157 to 0.2018 confirm the effect of currents on u* based parameterizations. Overall, better fits are found when u* is expressed as a function of ΔU instead of U10, as in the case of U10 only parameterizations in Table 2.
Zhao and Toba (2001) first put forward a kind of dimensionless parameter defined as RH and suggested that RH ismore related withW than withU10 alone. However, significant wave heights are usually selected to compute RH, even though it was originally applied exclusively for windsea circumstances (Goddijn-Murphy et al., 2011). In this study, we use Eq. (4) to calculate RH:
| $ R_{\mathrm{H}}=\frac{u_{*} H_{\mathrm{sw}}}{v_{\mathrm{w}}} , $ | (4) |
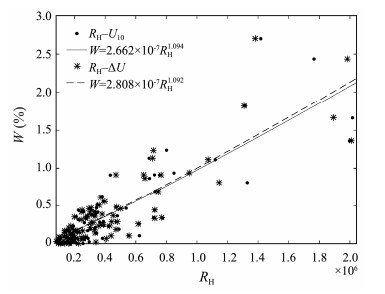
where Hswis the wave height of the windsea, and νwis the viscosity of seawater. Most air temperatures covered therange of 22℃–30℃ during the two cruises. Thus, in Eq. (4), νwis fixed at the value of 1.0098×10⁻⁶ m-2 s when the temperature of seawater is 22℃. As νw is dependent ontemperature and the salinity of seawater (Monahan and Zietlow, 1969; Monahan and O'Muircheartaigh, 1986; Sharqawy et al., 2010), RH based parameterizations can have a good fit if the νw is variable. Fig. 8 shows the W plotted against the RH in terms of U10 and ΔU, and the fit statistics of R2 and RMSE are listed in Table 4. The power law fit of W, in terms of ΔU, obtains a greater R2 of 0.7499 and a smaller RMSE of 0.2483 than the W in terms of U10. Only 17 out of 128 data points have a current velocity of more than 1.00m·s-1, which may lead to a relatively low increase or decrease rate forR2 and RMSE by fitting ΔU in Tables 2 and 4, respectively. The currents do have an effect on W. If many measurements are obtained from a cruise passing strong current areas, then the conclusions can be further confirmed.
|
Fig. 8 Dependence of W (%) on RH. RH – U10 (dots) and RH –ΔU (stars) mean the parameters of RH calculated using U10 and ΔU, respectively. The corresponding best fit to RH is represented by the solid line and dashed line. |
|
|
Table 4 Parameterizations of W (%) as a function of u* and RH. |
To sum up, the parameterizations ofW, as a function of U10, u*, and RH, are all in better agreement with observations when fitted to ΔU than those directly fitted to U10. We suggest that currents are important for the parameterizations of W, as a function of U10-related parameters, because currents can change the 'effective wind speed' for wave growth.
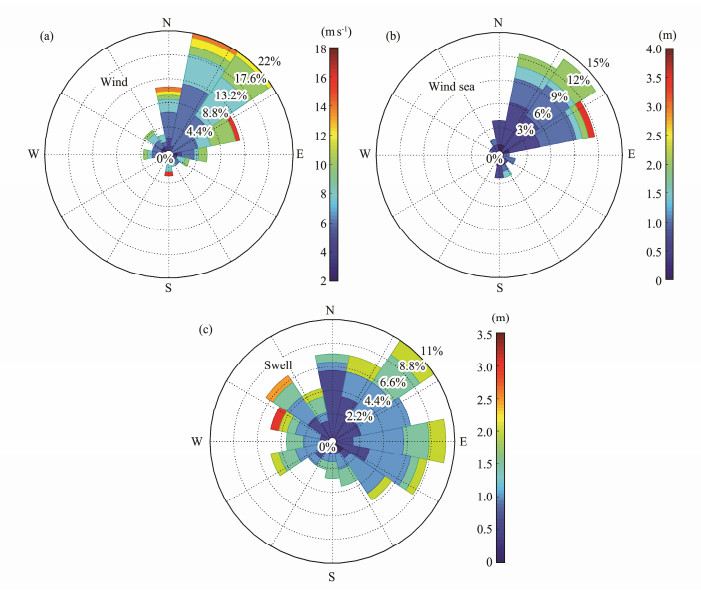
3.3 Influence of Swell onWWe consider wave current interaction and thus investigate the statistical distributions of wave height, wave direction for wind, wind sea, and swell, as illustrated in Fig. 9. The distributions of wind and wind sea are consistent with each other, whereas the direction of swell is scattered. The directional overlap between wind and wind sea suggests that enhanced wave breaking or increased W with opposing winds and currents is likely a result of opposing wind waves and currents and the wave current interaction between them. Wave breaking may be strengthened when laminar flow changes into turbulent associated with horizontal shear instability. For horizontally sheared currents, MacIver et al.(2006) provided evidence that opposing(following) waves bend toward the currentnormal(parallel) andincrease (decrease) in height based on laboratory experiments. Similarly, for uniform currents, wave heights increase(decrease), and wave wavelength isshortened (lengthened), leading to large (small) wave steepness when waves move against an opposing(following) current (Haus, 2007). The scattered swells in Fig. 9 urge us to reconsider if swells are insignificant for W, especially in swell-dominant waters when W is parameterized using RH or if swells influence W the same way as currents.
|
Fig. 9 Measurements of probability distributions by the X-band radar of WaMoS II: wind, wind sea, and swell. |
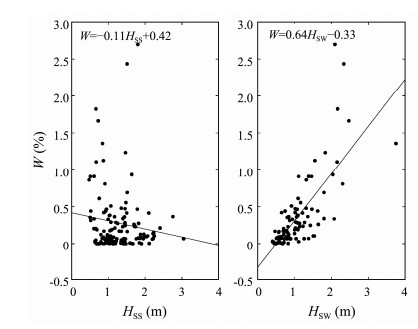
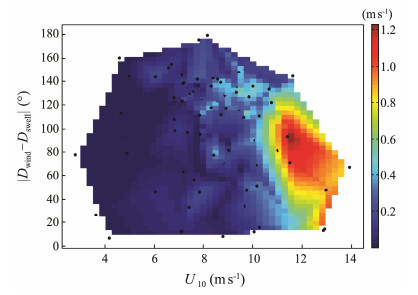
To implore the reason why W is suppressed by swells shown in Fig. 10, W, as a function of U10, and the deflection angle between wind and swell (|Dwind-Dswell|) are displayed in Fig. 11. The most striking feature of Fig. 11 is the conspicuously high values of U10 and |Dwind–Dswell| that are approximately 11 ms-1 and 90˚, respectively. Lowvalues of W are found where the propagating directions of winds and swells are parallel. Sugihara et al. (2007) found no certain relationship between W and the deflection angle between the propagating directions of wind waves and swells. Fig. 11 summarizes that the perpendicular (parallel) winds to the propagating direction of swells can increase (decrease)W. An explanation for a great W when the deflection angle is approximately 90˚ may rest on that wave breaking occurs easily on the wave crest through disturbance when the wind blows along the crest line of swells.
|
Fig. 10 Parameterizations of W (%) as a function of the wave height of swell (Hss) and wind sea (Hsw). |
|
Fig. 11 W (%) as a function of U10 and |Dwind–Dswell|. The black dots represent the original observations. |
Kraan et al. (1996) found no visual whitecaps at U10 of 7–8 ms-1 and suggested that it is caused by strong tidal currents. Given the absence of direction information, we guess that such tidal currents and their observed Dwind are in the same direction, which contributes to this extremely small W according to the theory we proposed above. Callaghan et al. (2008) observed a sharp increase in W when U10 decreases steadily. When Ucurrent increases rapidly, Dwind remains the same, but Dcurrent changes abruptly. We disagree with Callaghan et al. (2008), who believed that the directional alignment of winds and currents and increase in Ucurrent co-produce an increase in W. Here, we propose that the enlarged difference in magnitude and direction between winds and currents increases W.
Moreover, we consider that the effect of |Dwind–Ucurrent| on W is caused by wave current interaction because of the basically consistent directions of winds and wind seas. In areas with strong currents, such as the western boundary current, the calibration of U10 is necessary. Swells indeed affect W but in a different way compared with currents. We suppose that the propagating direction of swells perpendicular to winds contributes to a great W. We cannot avoid scarce observations, including current information in previous studies. The theory here can be a good explanation for the phenomenon in Kraan et al. (1996) and Callaghan et al. (2008) and should be verified with additional data in further studies.
4 ConclusionsUsing the ship-based observations from two cruises in the South China Sea and Western Pacific, we present an analysis of the influence of currents and swells on whitecap fraction.
First, according to the deflection angle between the propagating directions of winds and currents smaller or greater than 90˚, data are divided into two subsets. U10-dependent parameterizations are fitted using the two subsets individually and combined to find that the following (opposing) currents can decrease (increase) W. On the basis of the result, U10 is calibrated by subtracting Ucurrent from U10 in the condition of following currents, whereas the opposite situation U10 is calibrated by adding the parallel velocity component of opposing currents to U10. The power law fits in terms of ΔU and provides an increasing R2 and decreasing RMSE, illustrating better estimates of W than those directly fitting to U10. Second, ΔU is introduced to u* and RH, leading to an improvement on the W parameterizations.
Overall, swells can cause a negative impact onW. Nevertheless, wave breaking is enhanced when the winds blow along the crest line of swells. Considering that we lack information about wave velocity, swells with W parameterizations are yet to be studied and may be discussed in the future.
AcknowledgementsThis work was financially supported by the Hebei Agricultural University Research Project for Talented Scholars (No. YJ201835), the National Natural Science Foundation of China (No. 41806028), the China Postdoctoral Science Foundation (No. 2019M65206), and the Fundamental Research Funds for the Central Universities (No. N182303031). The efforts of the researchers who obtained and published the data adopted in this study are much appreciated. We thank the crew, scientists, and students in Dongfanghong 2 for the help in the process of collecting observation data.
Anguelova, M. D. and Webster, F., 2006. Whitecap coverage from satellite measurements: A first step toward modeling the variability of oceanic whitecaps. Journal of Geophysical Research, 111(C3): C03017. DOI:10.1029/2005JC003158 (  0) 0) |
Brocks, K., and Krugermeyer, L., 1970. The hydrodynamic roughness of the sea surface. In: Berichte des Instituts für Radiometereologie und Maritime Metereologie. No. 14, University of Hamburg, 55pp.
(  0) 0) |
Brumer, S. E., Zappa, C. J., Brooks, I. M., Tamura, H., Brown, S. M., Blomquist, B. W., Fairall, C. W. and Cifuentes, -Lorenzen A., 2017. Whitecap coverage dependence on wind and wave statistics as observed during SO GasEx and HiWinGS. Journal of Physical Oceanography, 47(9): 2211-2235. DOI:10.1175/JPO-D-17-0005.1 (  0) 0) |
Callaghan, A. H. and White, M., 2009. Automated processing of sea surface images for the determination of whitecap coverage. Journal of Atmospheric and Oceanic Technology, 26(2): 383-394. DOI:10.1175/2008JTECHO634.1 (  0) 0) |
Callaghan, A. H., Deane, G. B. and Stokes, M. D., 2008. Observed physical and environmental causes of scatter in whitecap coverage values in a fetch-limited coastal zone. Journal of Geophysical Research, 113(C5): C05022. DOI:10.1029/2007JC004453 (  0) 0) |
Deacon, E. L., and Webb, E. K., 1962. Interchange of properties between sea and air, Chapter 3, small-scale interactions. In: The Sea. Hill, M. N., ed., Interscience, New York, 43-87.
(  0) 0) |
Donelan, M. A., 1982. The dependence of the aerodynamic drag coefficient on wave parameters. In: First International Conference on Meteorology and Air-Sea Interaction of the Coastal Zone. The Hague, Netherlands, American Meteorological Society, 381-387.
(  0) 0) |
Geernaert, G. L., 1987. On the importance of the drag coefficient in air-sea interactions. Dynamics of Atmospheres and Oceans, 11(1): 19-38. DOI:10.1016/0377-0265(87)90012-1 (  0) 0) |
Goddijn-Murphy, L., Woolf, D. K. and Callaghan, A. H., 2011. Parameterizations and algorithms for oceanic whitecap coverage. Journal of Physical Oceanography, 41(4): 742-756. DOI:10.1175/2010JPO4533.1 (  0) 0) |
Guan, C. L., Hu, W. and Sun, J., 2007. The whitecap coverage model from breaking dissipation parameterizations of wind waves. Journal of Geophysical Research, 112(C5): C05031. DOI:10.1029/2006JC003714 (  0) 0) |
Hanson, J. L. and Phillips, O. M., 1999. Wind sea growth and dissipation in the open ocean. Journal of Physical Oceanography, 29(3): 1633-1648. DOI:10.1175/1520-0485(1999)029<1633:wsgadi>2.0.co;2 (  0) 0) |
Haus, B. K., 2007. Surface current effects on the fetch-limited growth of wave energy. Journal of Geophysical Research, 112: C03003. DOI:10.1029/2006JC003924 (  0) 0) |
Hwang, P. A., Toporkov, J. V., Sletten, M. A. and Menk, S. P., 2013. Mapping surface currents and waves with interferometric synthetic aperture radar in coastal waters: Observations of wave breaking in swell-dominant conditions. Journal of Physical Oceanography, 43(3): 563-582. DOI:10.1175/JPOD-12-0128.1 (  0) 0) |
Jia, N. and Zhao, D. L., 2019. The influence of wind speed and sea states on whitecap coverage. Journal of Ocean University of China, 18(2): 282-292. DOI:10.1007/s11802-019-3808-7 (  0) 0) |
Khojasteh, D., Mousavi, S. M., Glamore, W. and Iglesias, G., 2018. Wave energy status in Asia. Ocean Engineering, 169: 344-358. DOI:10.1016/j.oceaneng.2018.09.034 (  0) 0) |
Kondo, J., 1975. Air-sea bulk transfer coefficients in diabatic conditions. Boundary-Layer Meteorology, 9(1): 91-112. DOI:10.1007/bf00232256 (  0) 0) |
Kraan, G., Oost, W. A. and Janssen, P. A. E. M., 1996. Wave energy dissipation by whitecaps. Journal of Atmospheric and Oceanic Technology, 13(1): 262-267. DOI:10.1175/1520-0426(1996)0132.0.CO;2 (  0) 0) |
Lafon, C., Piazzola, J., Forget, P. and Despiau, S., 2007. Whitecap coverage in coastal environment for steady and unsteady wave field conditions. Journal of Marine Systems, 66: 38-46. DOI:10.1016/j.jmarsys.2006.02.013 (  0) 0) |
MacIver, R. D., Simons, R. R. and Thomas, G. P., 2006. Gravity waves interacting with a narrow jet-like current. Journal of Geophysical Research, 111: C03009. DOI:10.1029/2005JC003030 (  0) 0) |
Miller, B. I., 1964. A study of filling of hurricane Donna (1960) over land. Monthly Weather Review, 92: 389-406. DOI:10.1175/1520-0493(1964)0922.3.CO;2 (  0) 0) |
Monahan, E. C., 1971. Oceanic whitecaps. Journal of Physical Oceanography, 1(2): 139-144. DOI:10.1175/1520-0485(1971)001<0139:OW>2.0.CO;2 (  0) 0) |
Monahan, E. C. and O'Muircheartaigh, I. G., 1986. Whitecaps and the passive remote sensing of the ocean surface. International Journal of Remote Sensing, 7(5): 627-642. DOI:10.1080/01431168608954716 (  0) 0) |
Monahan, E. C. and Zietlow, C. R., 1969. Laboratory comparisons of fresh-water and salt-water whitecaps. Journal of Geophysical Research, 74(28): 6961-6966. DOI:10.1029/JC074i028p06961 (  0) 0) |
Pearman, D. W., Herbers, T. H. C., Janssen, T. T., van Ettinger, H. D., McIntyre, S. A. and Jessen, P. F., 2014. Drifter observations of the effects of shoals and tidal-currents on wave evolution in San Francisco Bight. Continental Shelf Research, 91: 109-119. DOI:10.1016/j.csr.2014.08.011 (  0) 0) |
Ren, D. Q., Hua, F., Yang, Y. Z. and Sun, B. N., 2016. The improved model of estimating global whitecap coverage based on satellite data. Acta Oceanologica Sinica, 35(5): 66-72. DOI:10.1007/s13131-016-0848-3 (  0) 0) |
Romero, L., Lenain, L. and Melville, W. K., 2017. Observations of surface wave-current interaction. Journal of Physical Oceanography, 47(3): 615-632. DOI:10.1175/jpo-d-16-0108.1 (  0) 0) |
Salisbury, D. J., Anguelova, M. D. and Brooks, I. M., 2013. On the variability of whitecap fraction using satellite-based observations. Journal of Geophysical Research: Oceans, 118(11): 6201-6222. DOI:10.1002/2013JC008797 (  0) 0) |
Schwendeman, M. and Thomson, J., 2015. Observations of whitecap coverage and the relation to wind stress, wave slope, and turbulent dissipation. Journal of Geophysical Research: Oceans, 120: 8346-8363. DOI:10.1002/2015jc011196 (  0) 0) |
Sharqawy, M. H., Lienhard, J. H. and Zubair, S. M., 2010. Thermophysical properties of seawater: A review of existing correlations and data. Desalination and Water Treatment, 16: 354-380. DOI:10.5004/dwt.2010.1079 (  0) 0) |
Sheppard, P. A., 1958. Transfer across the earth's surface and through the air above. Quarterly Journal of the Royal Meteorological Society, 84(361): 205-224. DOI:10.1002/qj.49708436102 (  0) 0) |
Sheppard, P. A., Tribble, D. T. and Garratt, J. R., 1972. Studies of turbulence in the surface layer over water (Lough Neagh). Part Ⅰ. Instrumentation, programme, profiles. Quarterly Journal of the Royal Meteorological Society, 98(417): 627-641. DOI:10.1002/qj.49709841711 (  0) 0) |
Smith, S. D., 1980. Wind stress and heat flux over the ocean in gale force winds. Journal of Physical Oceanography, 10(5): 709-726. DOI:10.1175/1520-0485(1980)010<0709:wsahfo>2.0.co;2 (  0) 0) |
Smith, S. D. and Banke, E. G., 1975. Variation of the sea surface drag coefficient with wind speed. Quarterly Journal of the Royal Meteorological Society, 101(429): 665-673. DOI:10.1002/qj.49710142920 (  0) 0) |
Stramska, M. and Petelski, T., 2003. Observations of oceanic whitecaps in the north polar waters of the Atlantic. Journal of Geophysical Research, 108(C3): 3086. DOI:10.1029/2002JC001321 (  0) 0) |
Sugihara, Y., Tsumori, H., Ohga, T., Yoshioka, H. and Serizawa, S., 2007. Variation of whitecap coverage with wave-field conditions. Journal of Marine Systems, 66: 47-60. DOI:10.1016/j.jmarsys.2006.01.014 (  0) 0) |
Wieringa, J., 1974. Comparison of three methods for determining strong wind stress over Lake Flevo. Boundary-Layer Meteorology, 7(1): 3-19. DOI:10.1007/bf00224969 (  0) 0) |
Woolf, D. K., 2005. Parameterization of gas transfer velocities and sea-state-dependent wave breaking. Tellus, 57(2): 87-94. DOI:10.3402/tellusb.v57i2.16783 (  0) 0) |
Wu, J., 1979. Oceanic whitecaps and sea state. Journal of Physical Oceanography, 9(3): 531-554. DOI:10.1175/1520-0485(1979)0092.0.CO;2 (  0) 0) |
Wu, J., 1980. Wind-stress coefficients over sea surface near neutral conditions – A revisit. Journal of Physical Oceanography, 10(5): 727-740. DOI:10.1175/1520-0485(1980)010<0727:wscoss>2.0.co;2 (  0) 0) |
Wu, J., 1988. Variations of whitecap coverage with wind stress and water temperature. Journal of Physical Oceanography, 18(10): 1448-1453. DOI:10.1175/1520-0485(1988)018<1448:VOWCWW>2.0.CO;2 (  0) 0) |
Xu, D., Liu, X. and Yu, D., 2000. Probability of wave breaking and whitecap coverage in a fetch-limited sea. Journal of Geophysical Research, 105(C6): 14253-14259. DOI:10.1029/2000jc900040 (  0) 0) |
Yelland, M. and Taylor, P. K., 1996. Wind stress measurements from the open ocean. Journal of Physical Oceanography, 26(4): 541-558. DOI:10.1175/1520-0485(1996)026<0541:wsmfto>2.0.co;2 (  0) 0) |
Yuan, Y. L., Han, L., Hua, F., Zhang, S. W., Qiao, F. L., Yang, Y. Z. and Xia, C. S., 2009. The statistical theory of breaking entrainment depth and surface whitecap coverage of real sea waves. Journal of Physical Oceanography, 39(1): 143-161. DOI:10.1175/2008JPO3944.1 (  0) 0) |
Zhao, D. L. and Toba, Y., 2001. Dependence of whitecap coverage on wind and wind-wave properties. Journal of Oceanography, 57: 603-616. DOI:10.1023/a:1021215904955 (  0) 0) |
Zheng, C. W., Chen, Y. G., Zhan, C. and Wang, Q., 2019a. Source tracing of the swell energy: A case study of the Pacific Ccean. IEEE Access, 99: 1-1. DOI:10.1109/ACCESS.2019.2943903 (  0) 0) |
Zheng, C. W., Liang, B. C., Chen, X., Wu, G. X., Sun, X. F. and Yao, J. L., 2020. Diffusion characteristics of swells in the North Indian Ocean. Journal of Ocean University of China, 19(3): 479-488. DOI:10.1007/s11802-020-4282-y (  0) 0) |
Zheng, C. W., Wu, G. X., Chen, X., Wang, Q., Gao, Z. S., Chen, Y. G. and Luo, X., 2019b. CMIP5-based wave energy projection: Case studies of the South China Sea and the East China Sea. IEEE Access, 7: 82753-82763. DOI:10.1109/ACCESS.2019.2924197 (  0) 0) |
Zubkovskii, S. L. and Kravchenko, T. K., 1967. Direct measurements of some characteristics of atmosphere turbulence in the near water layer. Izvestiya Atmospheric and Oceanic Physics, 3: 73-77. (  0) 0) |
 2021, Vol. 20


