2) Key Laboratory of Physical Oceanography, Ocean University of China, Qingdao 266100, China;
3) Ningbo Collaborative Innovation Center of Nonlinear Harzard System of Ocean and Atmosphere, Ningbo University, Ningbo 315211, China
In the Earth's climate system, Arctic sea ice (ASI) is a major factor that has been extensively studied using observation and climate models (Deser et al., 2000; Alexander et al., 2004; Magnusdottir et al., 2004). The loss of sea ice changes the radiation balance in the Arctic area (Schweiger et al., 2008). Further studies (Overland et al., 2008; Overland and Wang, 2010) have shown that sea ice changes have altered winds from a mostly zonal pattern to a meridional pattern in the last decade. This phenomenon allows additional heat to transfer poleward, resulting in both Arctic warming and mid-latitude cooling.
Precious work has focused on the regional effects of sea ice loss over China (Niu et al., 2003). Abnormal sea ice along the North Pacific has obvious effects on both summer rainfall and temperature in China. In the years with large sea ice areas, rainfall increased over areas north of the Yangtze River and decreased in southern China. By contrast, in the years with low sea ice, less rain fell in northern China and more in southern China. This study was concerned with relationships between the mon- thly–seasonal mean precipitation and ASI. The anomalies of ASI can also cause severe weather in China, such as disastrous freezing rain and heavy snow in central and southern China in January 2008 (Chen et al., 2013). Strong water-vapor transported from the Bay of Bengal and from the Pacific Ocean related to ASI anomalies in the fall of 2007 was considered one of the main causes of the snowstorm in 2008. Since 2008, several other severe weather events occurred in China, including the cold temperature anomalies in winter and spring from 2009 to 2010 and freezing rain over southern China from 2010 to 2011. Both of these events happened in winter and spring, right after the obvious anomalies of ASI in summer and fall.
Statistical results (Wang and Zhou, 2005; Zhai et al., 2005; Liu et al., 2015) showed that the annual extreme precipitation events increase in east and northwest China and occur mainly in summer. Most of these studies attributed the causes of this trend to the associated large-scale circulation over the Eurasian continent and the western Pacific and did not examine carefully its relationship with ASI. Therefore, this study focuses on the summer extreme rainfall and the effect of ASI on its changes.
Extreme rainfall events have severe effects on society (Zhou et al., 2013; Lesk et al., 2016), and an accurate fore- cast of extreme rainfall over China will be helpful to prevent and manage disasters. Although the trend of extreme rainfall has been studied, its prediction is relatively unexplored. Thus, another objective of this study is to identify the leading mode of summer extreme rainfall in China and determine the skills necessary for predicting it.
In many former studies about the statistical forecast of summer rainfall over China (Xing et al., 2014; Yim et al., 2016; Li and Wang, 2017; Xing and Wang, 2017), subtro- pical sea surface temperature (SST) is used as the only pre- dictor from the sea. Zhao et al. (2004), Fang and Zeng (2008), and Guo et al. (2014) suggested that sea ice is closely connected with the summer monsoon rainfall in East Asia. These studies enlighten us to extract additional precursory signals for summer extreme rainfall in China from the sea. For this purpose, we build three statistical forecast models with ASIC and SST in selected regions and compare their forecast skill.
2 Data and Method 2.1 DataSeveral datasets are used in this study, including 1) daily precipitation records of 483 stations over China from the National Meteorological Information Center of China Meteorological Administration; 2) monthly mean circulation data from National Centers for Environmental Prediction–Department of Energy (NCEP–DOE) Reanalysis products; 3) monthly mean SST data from the European Center for Medium-Range Weather Forecasts Interim Reanalysis (ERA-Interim); and 4) Arctic sea ice concentration (ASIC) data from National Snow and Ice Data Center (NSIDC). The period from 1979 to 2015 is chosen in this study.
2.2 MethodFollowing Bell et al. (2004) and Liu et al. (2015), we define extreme rainfall events as those that exceed a 95% threshold percentile (top 5%) of daily precipitation (the amount of precipitation, unit: mm).
Empirical orthogonal function (EOF) analysis is used in this study to reveal the leading modes of Chinese summer extreme rainfall. We focus on the seasonal means averaged for three summer (June–August, JJA) months.
After EOF analysis, the North test (North et al., 1982) is conducted to examine whether the modes are independent of each other. The error range of eigenvalue λ is
Another purpose of this paper is to examine whether ASIC can be used as a predictor of summer extreme rainfall in China, and a large-scale signal is studied. Predictors such as ASIC and SST used in this paper are defined in a large area, and the lead-lag correlation is considered (Lee et al., 2013). Thus, predictors are defined as follows:
| $Pred(t) = \left\lfloor {\left| {COR(lon, lat)} \right| \cdot TF(lon, lat, t)} \right\rfloor $ |
| ${\rm{if }}\left| {COR(lon, lat)} \right| \geqslant 0.33(95\% {\kern 1pt} {\kern 1pt} {\kern 1pt} {\rm{confidence}}{\kern 1pt} {\kern 1pt} {\kern 1pt} {\rm{level}}), $ |
where TF denotes the value of a predictor (ASIC, SST, and so on) at each grid at lead time t. COR is the correlation coefficient between a predictor and PC1 as a function of longitude and latitude, and square brackets indicate the areal mean over the selected regions. For ASIC, Pred(t) is averaged over Arctic (180°W–180°E, 55°N–80°N), and it is also called ASICI (Arctic Sea ice concentration index) in this paper. Similarly, Pred(t) of SST is called SST index (SSTI).
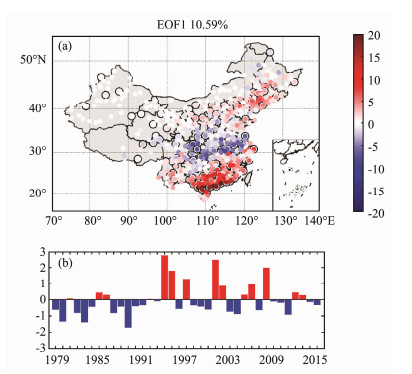
3 Statistic Linkage Between ASI and Chinese Summer Extreme RainfallEOF analysis of Chinese summer extreme rainfall is performed to extract the leading modes. The four leading EOF modes account for 10.6%, 7.6%, 6.7%, and 6.3% of the total rainfall variance. The north test shows that the first mode is independent, and the other three modes are not independent. This result reflects the complexity of extreme precipitation over China. Therefore, EOF1 of Chinese summer extreme rainfall and its linkage with ASI and SST are studied in this paper (Fig. 1).
|
Fig. 1 (a) Spatial distribution of the leading EOF mode of Chinese summer extreme rainfall and (b) normalized principal components (PCs) of the leading mode. Stations with a solid circle in (a) indicate those with statistically significance at the 95% confidence level by EOF model check. |
The spatial distribution of EOF1 is characterized by a sharp contrast among South China, the Yangtze River basin, and North China. More extreme rainfall appears in South and North China, whereas less is reported in the Yangtze River basin. For PC1, negative phases were frequent during 1979–1993 and 2009–2015, and positive phases were frequent during 1994–2008.
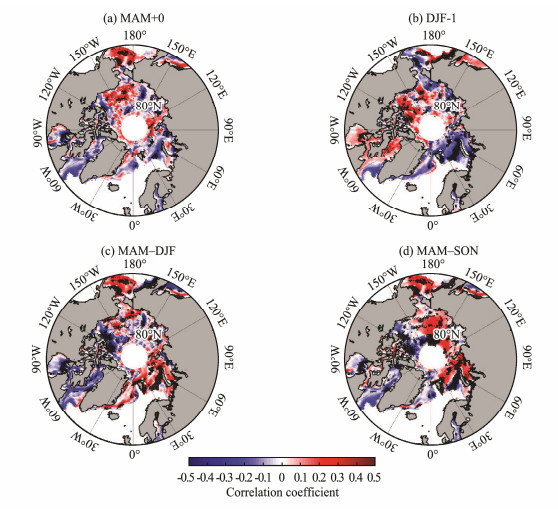
The correlation map of PC1 with spring ASIC (MAM+ 0) is characterized by a positive correlation over Beaufort Sea and Bering Strait and mainly negative correlation along Eurasia and Greenland (Fig. 2a). In the previous winter (DJF-1), the correlation map shows large areas of negative correlation along Eurasia. Meanwhile, negative correlation appears over Bering Strait (Fig. 2b). The correlation maps of PC1 with changes in ASIC from previous winter and autumn to current spring (MAM–DJF and MAM–SON denote ASIC of MAM minus that of previous DJF and SON) are characterized by a positive correlation along Eurasia and negative correlation along Canada and west of Greenland (Figs. 2c and 2d). Therefore, ASI melts may be an important cause of summer extreme rainfall in China.
|
Fig. 2 Correlation maps of PC1 of Chinese summer extreme rainfall with Arctic sea ice concentration: (a) MAM+0, (b) DJF-1, (c) MAM–DJF, and (d) MAM–SON. The black dotted regions show a correlation coefficient of 0.28 with statistical significance at the 90% confidence level. |
The correlation coefficients of ASICI and PC1 of four time periods (MAM+0, DJF-1, MAM–JF, and MAM–SON) are calculated using the method introduced in part 2 of this paper to further analyze the relationship between them. ASICI of all four time periods has a negative correlation coefficient with PC1. MAM and DJF exhibit the values -0.46 and -0.41, which are smaller than -0.32 (95% confidence level). Thus, MAM and DJF ASICI are more appropriate predictors than the other time periods. Considering that DJF ASICI as a predictor has a long lead time, it is chosen for the prediction of summer extreme rainfall in China.
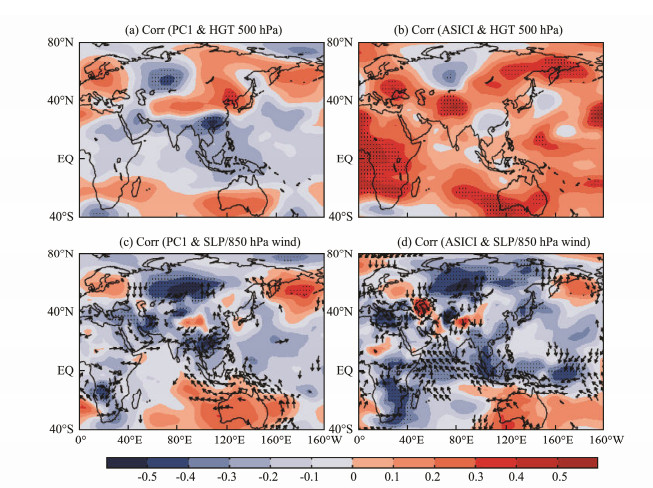
The correlation between PC1 and JJA at 500 hPa geopotential height (Fig. 3a) reflects the character of the Eurasian wave train, with two significant negative center over the Urals and South China and two positive centers over Western Europe and North China. The western Pacific subtropical high is positioned more southward, and the continental high is stronger than normal in this situation. Water vapor cannot be transported to the north of China, and most water vapor stays in southern China. As a result, less rain falls in northern China and more falls in southern China. The correlation between ASICI and JJA at 500 hPa geopotential height (Fig. 3b) shows a similar distribution over Eurasian, with slight differences. The region of the stronger continental high pressure is wide, and a weak subtropical high over South China covers a small area. An important role that ASI plays in the appearance of EOF1 type summer extreme rainfall in China may be strengthening the continental high pressure. The correlation between PC1 and SLP at 850 hPa wind (Fig. 3c) demonstrates a significant cyclone over South China, which is beneficial to the emergence of heavy rainfall. A significant anti-cyclone occurs over South China Sea, and it helps transport water vapor to South China. The correlation between ASICI and SLP at 850 hPa wind (Fig. 3d) indicates no significant cyclone over South China, but a north wind is observed to come from high latitude. Another important role that ASI plays in the appearance of EOF1 type summer extreme rainfall in China is to provide cold air, which is also beneficial to the emergence of heavy rainfall by increasing the instability of air.
|
Fig. 3 Correlation fields between PC1 and (a) 500 hPa geopotential height, (c) SLP (shading), 850 hPa wind (vectors), in June–August (JJA) during 1979–2015. (b) and (d) are similar to (a) and (c) but for ASICI. Dotted areas denote regions with correlation coefficients significant at the 95% confidence level. |
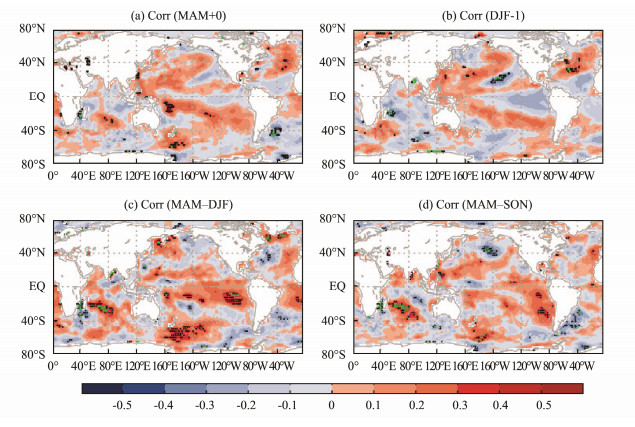
Fig. 4 shows that the most significant positive correlation areas between SST and Chinese summer extreme rainfall are over the southwestern Indian Ocean (40°E–90°E, 40°S–0°) during the time period of DJF to MAM and SON to MAM. Thus, the change in SST from autumn and winter of the previous year to spring in the tropical Indian Ocean may be an important cause of Chinese summer extreme rainfall. Using the zonal mean SST of this area (40°E–90°E, 40°S–0°), we build an SSTI of MAM+0, DJF-1, MAM–DJF, and MAM–SON. The temporal correlation coefficients between the four SSTI and PC1 are 0.41, 0.42, 0.49, and 0.57which are all at a 95% confidence level during 1979–2015. Thus, we choose SSTI of MAM-SON whose correlation coefficient with PC1 is highest as a predictor of Chinese summer extreme rainfall.
|
Fig. 4 Correlation fields between PC1 and SST at (a) MAM+0, (b) DJF-1, (c) MAM–DJF, and (d) MAM–SON. Black dotted areas denote regions with correlation coefficients significant at the 95% confidence level and green dotted areas at the 99% confidence level. |
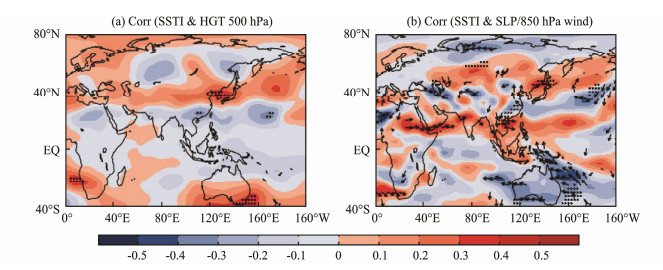
The correlation between SSTI and JJA at 500 hPa geopotential height (Fig. 5a) shows a similar distribution to PC1, but the negative correlation area over the Urals is not significant at the 95% confidence level. In addition, an obvious cyclone (850 hPa wind) occurs over South China, with significant negative correlation on the SLP field. This cyclone can also be found on the correlation field between PC1 and 850 hPa wind but not on ASIC. These findings suggest that the influence of SST predictor to Chinese summer extreme rainfall is mainly concentrated in the low latitudes. The anomaly of SST from autumn before to spring over the southwestern Indian Ocean may indicate that more cyclones can cause heavy rain over South China in summer than in other seasons. On the 850 hPa wind field, a southwest wind belt from the western Indian Ocean to the South China Sea has a significant correlation with SSTI. This result implies that SST anomaly in the Indian Ocean may contribute to the development of the southwest monsoon. As a result, more water vapor will be transferred to South China.
|
Fig. 5 Correlation fields between SSTI and (a) 500 hPa geopotential height and between SSTI and (b) SLP (shading) and 850 hPa wind (vectors) in June–August (JJA) during 1979–2015. Dotted areas denote regions with correlation coefficients significant at the 95% confidence level. |
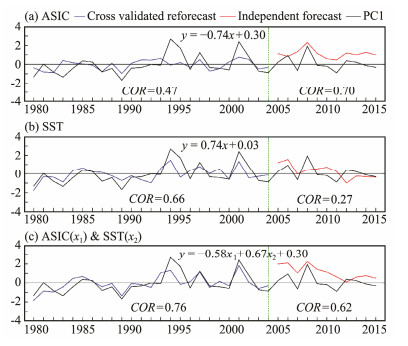
To investigate the predictability source of Chinese summer extreme rainfall, we compare the forecast skills of PA, PS, and PAS. Using PA, PS, and PAS, PC1 prediction models are established through linear regression. The detailed definitions of the selected predictors for PC1 are presented in Sections 3 and 4. The cross-validation method (Michelson, 1987) is used to make a retrospective forecast for PC1. We train the models using data during 1980–2004 and then apply the models to forecast the target years of 2005–2015. The observed PC is shown by a black line in Fig. 6, whereas the corresponding cross-validation re- forecast PC and independent forecast PC are in blue and red lines. For PA, PS, and PAS, the CORs of cross-validation reforecast PC and observed PC are 0.47, 0.66, and 0.76, respectively (Fig. 6). The three correlation coefficients are all at the 95% significant level but at the 99% level for PS and PAS. Thus, PC1 can be regarded as predictable by ASIC and SST during 1980–2004, and SST is a more effective predictor than ASIC in this period. In Fig. 6b, the model established by SST can better reflect the peak value of PC1, whereas the ASIC model is weaker than SST in this respect. However, in the independent forecast period of 2005–2015, the COR skill of the ASIC and SST models differs. The COR skill for the ASIC model is 0.7, which is at the 99% significant level and better than that for the period of 1980–2004. The COR skill for the SST model is 0.27, which is not significant at the 95% significant level. Thus, ASIC is a more effective predictor than SST for Chinese summer extreme rainfall in recent years. In Fig. 6c, the model established by PAS has the best prediction effect during 1980–2004. Although SST plays a major role during this period, consideration of the combined effect of the two predictors can lead to better prediction effects. In the independent forecast period of 2005–2015, the COR skill of PAS is lower than that of PA. Our results provide further evidence that the ASI is the key factor for the forecast of Chinese summer extreme rainfall in recent decades. ASI is melting at an increasing rate in recent years (Comiso, 2012; Stroeve et al., 2012). In September 2007, the ASI reached its lowest areal extent, which is about 40% below the long-term mean (Comiso et al., 2008). Further research revealed that the ongoing reductions of ASI may be impacting various aspects of weather and climate in the Northern Hemisphere mid-latitudes. Our results are consistent with findings of previous studies.
|
Fig. 6 Time series of PC1 obtained from observation (black line), cross-validated reforecast (blue line), and independent forecast (red line). |
The present study investigates the predictability and prediction of Chinese summer extreme rainfall for the 37-year period of 1979–2015.
The leading four major modes of Chinese summer extreme rainfall are identified by EOF, which explains 31% of the total variability. EOF1, which is independent, is studied in this paper. EOF1 reflects an extreme rainfall distribution in which more extreme rainfall appears in South and North China, whereas less occurs in the Yangtze River Ba sin. EOF1 is closely related to the Eurasian wave train, which includes a positive anomaly over North China and negative anomaly over the Urals and South China. It is also associated with a significant anomalous cyclone on low-level wind field over South China.
The lead-lag correlation between PC1 and ASIC from autumn of the previous year to spring of the current year indicates that the changes in ASIC at previous winter (DJF-1) and current spring (MAM+1) significantly impact Chinese summer extreme rainfall. In terms of PC1 and SST, the change in SST at the selected region over tropical India Ocean from previous autumn to current spring (MAM–SON) is a key factor. The spatial correlation between ASICI and summer atmospheric circulation indicates that the main contribution of Arctic Sea ice to Chinese summer extreme rainfall is at high latitudes, causing a significant positive anomaly over North China and negative anomaly over the Urals on 500 hPa. For SST, the main contribution is mainly at low latitudes, causing a cyclone anomaly on 850 hPa wind field and negative anomaly on SLP.
To assess the predictability of Chinese summer extreme rainfall, three prediction models are built using ASIC and SST as predictors. The cross-validated reforecast of the PA model for PC1 of Chinese summer extreme rainfall during the period of 1980–2004 achieves a significant forecast COR skill of 0.47, whereas that of the PS model is higher at 0.66. These values suggest that the main sources of predictability of Chinese summer extreme rainfall are rooted in tropical oceans for 1980–2004. Meanwhile, the PAS model has the best COR skill of 0.76, which indicates that the predictability of Chinese summer extreme rainfall can yield a better result by considering the joint influence of ASI and SST during this period. However, the COR skill of the independent forecast of the ASIC model is 0.27 for 2005–2015, which is not significant, whereas the SST model achieves a significant COR skill of 0.70 for the same period. This obvious difference indicates that the effect of ASI on Chinese summer extreme rainfall is becoming more important and the predictability signal of Chinese summer extreme rainfall is more from polar areas in the past decade.
Anomalies of ASI may be a key factor to the weather and climate changes in China. In this study, we mainly focus on the predictability of Chinese summer extreme rainfall. The linkage between the ASI, SST, and Chinese summer extreme rainfall is not completely understood. Some studies (Wu et al., 2009a, 2009b) showed that the combined impacts of both spring ASI and Eurasian snow cover on the Eurasian wave train are thought to be the possible reason of the linkage between ASI and Chinese summer rainfall. The summer Arctic dipole anomaly may serve as the bridge linking the spring ASI and Chinese summer rainfall. In the future, additional studies are needed to confirm their relationships.
AcknowledgementsAuthors thank NCEP and NCAR, the ECMWF for reanalysis data, the NSIDC for ASIC data, the National Meteorological Information Center of China for observation datasets. This study is supported by the National Natural Science Foundation of China (No. 41575067), and the National Major Scientific Research of Global Change Research (No. 2015CB953904). We also appreciate two anonymous reviewers' comments.
Alexander, M. A., Bhatt, U. S., Walsh, J. E., Timlin, M. S., Miller, J. S. and Scott, J. D., 2004. The atmospheric response to realistic Arctic sea ice anomalies in an AGCM during winter. Journal of Climate, 17: 890-905. DOI:10.1175/1520-0442(2004)017<0890:TARTRA>2.0.CO;2 (  0) 0) |
Bell, J. L., Sloan, L. C. and Snyder, M. A., 2004. Regional changes in extreme climatic events: A future climate scenario. Journal of Climate, 17(1): 81-87. (  0) 0) |
Chen, H. X., Liu, N. and Zhang, Z. H., 2013. Severe winter weather as a response to the lowest Arctic sea-ice anomalies. Acta Oceanologica Sinica, 32(10): 11-15. DOI:10.1007/s13131-013-0360-y (  0) 0) |
Comiso, J. C., 2012. Large decadal decline of the Arctic multiyear ice cover. Journal of Climate, 25(4): 1176-1193. (  0) 0) |
Comiso, J. C., Parkinson, C. L., Gersten, R. and Stock, L., 2008. Accelerated decline in the Arctic sea ice cover. Geophysical Research Letters, 35(1): L01703. (  0) 0) |
Deser, C., Walsh, J. E. and Timlin, M. S., 2000. Arctic sea ice variability in the context of recent atmospheric circulation trends. Journal of Climate, 13: 617-633. DOI:10.1175/1520-0442(2000)013<0617:ASIVIT>2.0.CO;2 (  0) 0) |
Fang, L. and Zeng, Q. C., 2008. Statistical prediction of East Asian summer monsoon rainfall based on SST and sea ice concentration. Journal of the Meteorological Society of Japan, 86(1): 237-243. DOI:10.2151/jmsj.86.237 (  0) 0) |
Guo, D., Gao, Y., Bethke, I., Gong, D. Y., Ola, M. J. and Wang, H. J., 2014. Mechanism on how the spring arctic sea ice impacts the East Asian summer monsoon. The Oretical and Applied Climatology, 115(1-2): 107-119. DOI:10.1007/s00704-013-0872-6 (  0) 0) |
Lee, J. Y., Lee, S. S., Wang, B., Ha, K. J. and Jhun, J. G., 2013. Seasonal prediction and predictability of the Asian winter temperature variability. Climate Dynamics, 41(3-4): 573-587. DOI:10.1007/s00382-012-1588-5 (  0) 0) |
Lesk, C., Rowhani, P. and Ramankutty, N., 2016. Influence of extreme weather disasters on global crop production. Nature, 529: 84-87. DOI:10.1038/nature16467 (  0) 0) |
Li, J. and Wang, B., 2017. Predictability of summer extreme precipitation days over eastern China. Climate Dynamics, 51: 1-12. (  0) 0) |
Liu, R., Liu, S. C., Cicerone, R. J., Shiu, C. J., Li, J., Wang, J. L. and Zhang, Y. H., 2015. Trends of extreme precipitation in eastern China and their possible causes. Advances in Atmospheric Sciences, 32(8): 1027-1037. DOI:10.1007/s00376-015-5002-1 (  0) 0) |
Magnusdottir, G., Deser, C. and Saravanan, R., 2004. The effects of North Atlantic SST and sea ice anomalies on the winter circulation in CCM3. Part Ⅰ: Main features and storm track characteristics of the response. Journal of Climate, 17(5): 857-876. DOI:10.1175/1520-0442(2004)017<0857:TEONAS>2.0.CO;2 (  0) 0) |
Michaelsen, J., 1987. Cross-validation in statistical climate fore- cast models. Journal of Applied Meteorology, 26(11): 1589-1600. DOI:10.1175/1520-0450(1987)026<1589:CVISCF>2.0.CO;2 (  0) 0) |
Niu, T., Zhao, P. and Chen, L. X., 2003. Effects of the sea-ice along the North Pacific on summer rainfall in China. Acta Meteorological Sinica, 17(1): 52-64. (  0) 0) |
North, G. R., Bell, T. L., Cahalan, R. F. and Moeng, F. J., 1982. Sampling errors in the estimation of empirical orthogonal functions. Monthly Weather Review, 110(7): 699-706. DOI:10.1175/1520-0493(1982)110<0699:SEITEO>2.0.CO;2 (  0) 0) |
Overland, J. E. and Wang, M., 2010. Large-scale atmospheric circulation changes are associated with the recent loss of Arctic sea ice. Tellus Series A: Dynamic Meteorology & Oceanography, 62(1): 1-9. (  0) 0) |
Overland, J. E., Wang, M. and Salo, S., 2008. The recent Arctic warm period. Tellus Series A: Dynamic Meteorology & Ocean- ography, 60(4): 589-597. (  0) 0) |
Schweiger, A. J., Lindsay, R. W., Vavrus, S. and Francis, J. A., 2008. Relationships between Arctic sea ice and clouds during autumn. Journal of Climate, 21(18): 4799-4810. DOI:10.1175/2008JCLI2156.1 (  0) 0) |
Stroeve, J. C., Serreze, M. C., Holland, M. M., Kay, J. E., Malanik, J. and Barrett, A. P., 2012. The Arctic's rapidly shrinking sea ice cover: A research synthesis. Climatic Change, 110(3-4): 1005-1027. DOI:10.1007/s10584-011-0101-1 (  0) 0) |
Wang, Y. and Zhou, L., 2005. Correction to 'observed trends in extreme precipitation events in China during 1961–2001 and the associated changes in large-scale circulation'. Geophysical Research Letters, 32(17): 982. (  0) 0) |
Wu, B., Zhang, R. and Wang, B., 2009. On the association between spring Arctic sea ice concentration and Chinese summer rainfall: A further study. Advances in Atmospheric Sciences, 26(4): 666-678. DOI:10.1007/s00376-009-9009-3 (  0) 0) |
Wu, B., Zhang, R. H., Wang, B. and D'Arrigo, R., 2009. On the association between spring Arctic sea ice concentration and Chinese summer rainfall. Geophysical Research Letters, 36: L09501. (  0) 0) |
Xing, W. and Wang, B., 2017. Predictability and prediction of summer rainfall in the arid and semi-arid regions of China. Climate Dynamics, 49: 1-13. DOI:10.1007/s00382-016-3323-0 (  0) 0) |
Xing, W., Wang, B. and Yim, S. Y., 2014. Peak-summer East Asian rainfall predictability and prediction part Ⅰ: Southeast Asia. Climate Dynamics, 47(1-2): 1-13. (  0) 0) |
Yim, S. Y., Wang, B., Kim, H. and Yoo, H. D., 2016. Peak- summer East Asian rainfall predictability and prediction: Extratropical East Asia. Climate Dynamics, 47(1-2): 15-30. DOI:10.1007/s00382-015-2849-x (  0) 0) |
Zhai, P., Zhang, X., Wan, H. and Pan, X., 2005. Trends in total precipitation and frequency of daily precipitation extremes over China. Journal of Climate, 18(7): 1096-1108. DOI:10.1175/JCLI-3318.1 (  0) 0) |
Zhao, P., Zhang, X., Zhou, X., Ikeda, M. and Yin, Y., 2004. The sea ice extent anomaly in the north pacific and its impact on the East Asian summer monsoon rainfall. Journal of Climate, 17(17): 3434-3447. DOI:10.1175/1520-0442(2004)017<3434:TSIEAI>2.0.CO;2 (  0) 0) |
Zhou, T., Song, F., Lin, R. and Chen, X., 2013. The 2012 north China floods: Explaining an extreme rainfall event in the context of a longer-term drying tendency. Bulletin of the American Meteorological Society, 94: S49-S51. (  0) 0) |
 2019, Vol. 18


