2) Key Laboratory of Submarine Geosciences and Prospecting Techniques of Ministry of Education, Ocean University of China, Qingdao 266100, China;
3) College of Geophysics and Petroleum Resources, Yangtze University, Wuhan 430100, China;
4) College of Engineering, Ocean University of China, Qingdao 266100, China
The ocean is rich in mineral resources, and understanding the subsurface geological structure is essential for the responsible exploitation of these marine resources (Leal et al., 2020). Marine electromagnetic methods are widely employed to detect geoelectric structures, and marine magnetotelluric (MT) and controlled-source electromagnetic (CSEM) methods are crucial in oil and gas exploration (Constable et al., 1998; Eidesmo et al., 2002; Constable, 2010; Li and Li, 2017; Duan et al., 2021). Among these techniques, electric field measurement serves as a fundamental component.
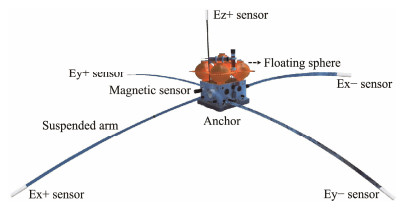
Marine electric field sensors are critical for measuring underwater electric fields (Key, 2011). During marine exploration, sensor pairs are symmetrically mounted at the ends of a suspended arm (as illustrated in Fig.1, with Ex+ and Ex− representing the sensor pairs) and submerged in seawater. The electric field signals generated through electrochemical processes provide fundamental information about the geological structures beneath the seabed.
|
Fig. 1 Diagram of marine electric field measurement. |
Electric field signals decay rapidly in the ocean owing to their high conductivity (Constable et al., 1998; Chen et al., 2015), requiring marine electric field sensors with excellent long-term stability and low noise levels. Considering that land-based sensors do not meet the demands of marine electromagnetic surveys (Constable, 2013), the development of sensors with these enhanced capabilities is crucial.
Among the various marine electric field sensors, including Cu/CuSO4, Pb/PbCl2, Ag/AgCl, and carbon fiber, the Ag/AgCl non-polarized electrode is considered the most suitable for measuring marine electric fields. The Cu/CuSO4 electrode generates noise when in contact with seawater, causing the effective signal to be obscured (Constable, 2013). While the Pb/PbCl2 electrode performs well in marine electric field experiments (Petiau and Dupis, 2010), its use is limited due to the significant environmental and health risks posed by lead and its compounds (Iqbal, 2012; Raj and Das, 2023). Filloux (1973) employed Ag/AgCl electrodes for marine electric field detection. Crona et al. (2001) compared the performance of Ag/AgCl and carbon fiber electrodes, concluding that Ag/AgCl electrodes are more sensitive to tidal fluctuations and other slowly varying signals.
Direct current (DC) electrolysis and calcination are the primary methods for preparing Ag/AgCl sensors (Rootare and Powers, 1977; Wei et al., 2012; Constable, 2013). Electrodes prepared via DC electrolysis exhibit greater stability and lower noise levels (Bard et al., 2022). Webb et al. (1985) used this method to prepare Ag/AgCl solid-state electrodes, which demonstrated relatively high performance. The effective reaction area of electrodes prepared using this method is concentrated on the electrode surface. Enhancing electrode performance typically involves increasing the effective reaction area. To enhance electrode performance, Constable et al. (1998) and Chen et al. (2015) built upon the work of Webb et al. (1985) by conducting numerous experiments and refining the electrolytic process. Their results demonstrated that noise was minimized by using large, low-impedance electrodes, with evidence suggesting that larger electrodes are inherently quieter. However, increasing the size of the silver foil within the electrode, as Webb et al. (1985) did to 5 cm × 65 cm, not only adds complexity but also raises the cost. Wei et al. (2012) and Luo et al. (2020) used the calcination method to prepare Ag/AgCl porous electrodes and assessed how the production process affects their performance. This method increases the reaction area by enhancing the electrode porosity. However, despite the larger reaction area, the preparation process for this type of electrode is quite complex. As a result, electrodes prepared using both DC electrolysis and calcination techniques still require further refinement.
The double-pulse electrodeposition technique is similar to the DC electrolysis process in that a deposited layer forms on the electrode surface by applying a specific voltage or current. However, a key feature of the double-pulse electrodeposition method is the ability to adjust the direction and magnitude of the current during the electrolysis process. Studies have shown that electrodes prepared using this method exhibit superior properties compared with those produced via DC electrolysis (Lee et al., 1999; Mohan and Raj, 2005; Pellicer et al., 2006), including a larger specific surface area, enhanced corrosion resistance, and greater hardness. Consequently, the double-pulse electrodeposition method can utilize a smaller area of silver foil to produce stable electrodes. This means that the method not only allows for the quick and efficient preparation of electrodes with stable performance but also addresses the issues associated with electrodes made via direct current electrolysis. Although this technique has been applied in various contexts, it has rarely been used for the preparation of Ag/AgCl marine electric field electrodes.
In this paper, we prepared Ag/AgCl marine electric field sensors using the double-pulse electrodeposition method and evaluated their exchange current density, stability, active response, and noise level through a series of experiments. The results demonstrated excellent performance across all self-made sensors. Furthermore, valid electric field data were successfully obtained from the self-made sensor during field tests. The sensors prepared using the doublepulse electrodeposition method contribute to accurate longterm measurements of marine electric fields.
2 Reaction and Polarization Mechanism of the Ag/AgCl Marine Electric Field ElectrodeThrough the double-pulse electrodeposition method, an all-solid Ag/AgCl reversible electrode, commonly represented as Ag/AgCl/Cl−, was prepared using silver foil (as the substrate) and silver chloride as the primary raw materials. The reversible reaction of the electrode can be expressed as follows:
| ${\rm AgCl + {e^ - } \rightleftharpoons Ag + C{l^ - }. }$ | (1) |
Ag+ undergoes a reduction process during the electrode's cathodic reaction, where it is reduced to Ag. The chemical equations are as follows:
| ${\rm AgCl \rightleftharpoons A{g^ + } + C{l^ - },} $ | (2) |
| ${\rm A{g^ + } + C{l^ - } \rightleftharpoons AgCl. }$ | (3) |
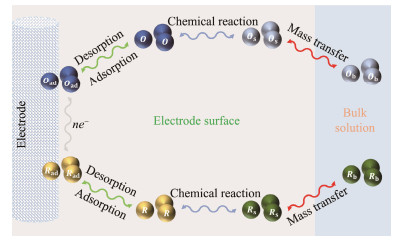
The oxidation restoration reaction typically involves multiple fundamental electrode processes, including mass transfer, surface adsorption and desorption, electrical crystallization, and homogeneous reactions that accompany the electrochemical reaction (Fig.2). These processes occur on the electrode's surface, meaning that the surface state and effective reaction area of the electrode influence the reaction rate and determine its properties.
|
Fig. 2 Electrode reaction process. |
From a microscopic perspective, the net reaction rate of the electrode is determined by the difference between all electrode processes, as described by the Butler-Volmer equation (Böckris et al., 2002).
| $ i = {i^0}\left\{ {\exp \left[ {\alpha nF\left({E - {E_\alpha }} \right)/RF} \right] - \exp \left[ {\beta nF\left({E - {E_\beta }} \right)/RF} \right]} \right\}, $ | (4) |
where i0 is the exchange current density, α and β are the transfer coefficients (α + β = 1), F is the Faraday constant, R is the molar gas constant, n is the number of electrons involved in the electrode reaction, T is the thermodynamic temperature, and E − Eα and E − Eβ indicate the cathodic and anodic overpotentials, respectively.
When the rates of each fundamental process of the electrode are equal, the electrode is in equilibrium, and the potential is referred to as the equilibrium electrode potential. Macroscopically, the net reaction rate of the electrode is zero (i.e., i = 0, and E − Eα = E − Eβ), indicating that the electrode reaction is reversible. Changes in the environment can shift the electrode from equilibrium to a polarized state. A polarizing electrode continues to accumulate electrons, deviating further from the equilibrium state, a phenomenon known as polarization. At the same time, this process accelerates the flow of electrons, bringing the electrode closer to the equilibrium state, a process known as depolarization. The coexistence and interaction of polarization and depolarization ultimately determine the performance of the electrode.
Assuming that the rates of the cathodic and anodic reactions are i1 and i2, respectively, the net reaction rate of the electrode is given by
| $ i = {i_1} - {i_2}. $ | (5) |
With ηC and ηA representing the cathodic and anodic overpotentials, the reaction rates for the cathodic and anodic processes of the Ag/AgCl electrode can be expressed as follows:
| $ {i_1} = {i^0}\exp \left({\alpha F{\eta _C}/RT} \right), $ | (6) |
| $ {i_2} = {i^0}\exp \left({\beta F{\eta _A}/RT} \right). $ | (7) |
Eqs. (6) and (7) reveal that a larger exchange current density of the electrode results in a smaller overpotential. Additionally, a higher exchange current density indicates greater reversibility of the electrode. Therefore, the exchange current density can be considered a quantitative measure of the reversibility of an electrode reaction.
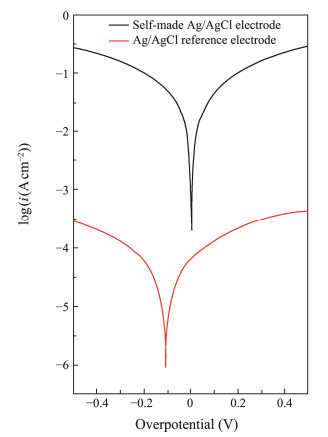
A Tafel test was conducted on the homemade Ag/AgCl electrode using the ParStat 4000A reference-grade electrochemical workstation (Ametek Scientific Instruments, USA), along with a computer for data recording and storage. The resulting data are illustrated in Fig.3, with a scan rate of 5 mV s−1 and a scan range of −0.5 to 0.5 V. The exchange current densities for the Ag/AgCl reference electrode and the home-made Ag/AgCl electrode were 7.4989 × 10⁻⁵ A cm−2 and 0.093 A cm−2, respectively. The experiment demonstrated that the homemade Ag/AgCl electrode has a higher exchange current density and is less likely to become polarized. This indicates that the homemade sensors are more reversible, which can enhance their stability and response.
|
Fig. 3 Tafel test results for the electrode. |
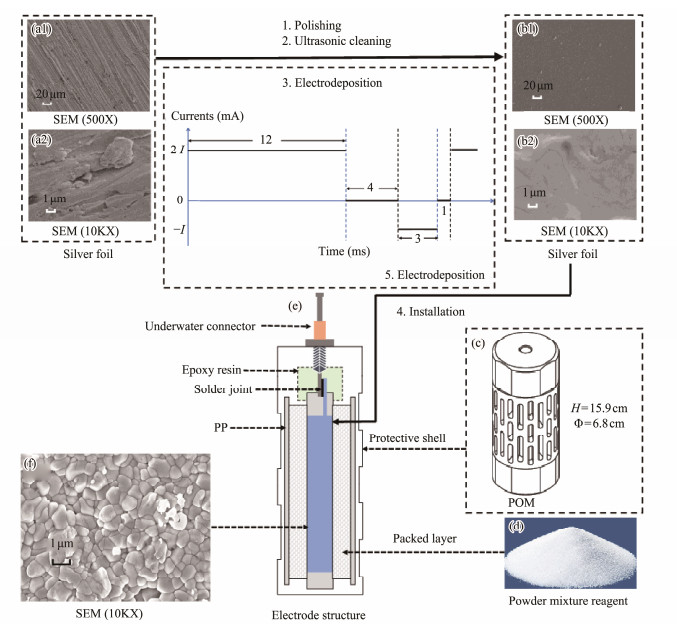
Fig.4c illustrates the designed electrode sheath, which has a height of 15.9 cm and a diameter of 6.8 cm. It consists of a water-permeable shell and a filter core, both made from polyformaldehyde (POM) and polypropylene (PP) cotton, respectively. These materials are highly resistant to pressure and corrosion, allowing them to withstand long-term testing at temperatures ranging from −40℃ to 100℃.
Since seawater serves as the electrolyte for the marine electric field electrode, the ion exchange rate between the seawater and the electrode significantly affects measurement accuracy. Therefore, to enhance the ion exchange rate both inside and outside the electrodes and ensure their stability and accuracy, numerous elongated holes have been sequentially created in the water-permeable shell.
Additionally, the PP cotton protects the AgCl from light exposure and prevents mud, sand, and microbes from entering the electrode. The water-permeable shell, with its holes, along with the lightweight PP cotton, significantly reduces the weight of the electrode sheath, enhancing its portability.
3.2 Pretreatment of Untreated Silver FoilThe surface properties of the silver foil (5 cm × 10 cm used in this paper), which serves as the electrode substrate, are crucial for the performance of the electric field sensor. Generally, fewer defects in the silver foil result in better sensor performance. Scanning electron microscopy (SEM) images of the untreated silver foil are illustrated in Figs. 4a1 – a2. The surface of the silver foil exhibits numerous defects, which are particularly detrimental to AgCl adhesion during electrode preparation. These defefcts also make the electrode susceptible to corrosion from the large amounts of Cl− present in seawater during measurements, leading to the generation of abnormal active points. This phenomenon typically results in reduced stability, increased noise levels, and a shortened lifespan for the electrode.
|
Fig. 4 Flowchart for the preparation of the marine electric field electrode. |
Polishing, ultrasonic cleaning, and the double-pulse technique were employed to remove surface defects from untreated silver foil. The pretreatment procedure is outlined as follows: First, the silver foil was polished with 1500-grit sandpaper (Fig.4, step 1) to enhance its luster. Second, the untreated silver foil was soaked in acetone for 6 h, followed by ultrasonic treatment in acetone, ethanol, and deionized (DI) water for 30 min each to eliminate surface impurities (Fig.4, step 2). Subsequently, the silver foil underwent electrodeposition (Fig.4, step 3) using square-wave double-pulse electrodeposition for 250 s, with maximum and minimum currents of 1000 mA and −500 mA, respectively.
SEM images of the silver foil after treatment are illustrated in Figs.4b1 – b2. The images reveal a flat and dense surface without any visible defects. The rugged yet smooth surface of the silver foil increases both the reactive surface area and the sediment surface area, promoting the polymerization of sediments during electrode preparation and improving the uniformity and density of the sediment surface.
3.3 Installation and Double-Pulse ElectrodepositionThe treated silver foil was placed inside the electrode sheath and connected to an underwater connector. The space between the filter core and the silver foil was filled with a suitable mixture of diatomaceous earth and silver chloride (Fig.4d). After installation (Fig.4, step 4) and double-pulse electrodeposition (Fig.4, step 5), the Ag/AgCl electrodes (Fig.4e) were prepared. During the electrodeposition process, the wave pattern aligns with the maximum and minimum currents, coinciding with the pretreatment of the silver foil described above. The silver foil undergoes electrodeposition for a total duration of 280 s. The SEM image (Fig.4f) illustrates that the surface of the silver foil is covered with densely arranged AgCl particles, almost all of which are smaller than 1 μm in diameter. These tiny particles on the surface of the electrode core can significantly increase the number of active centers, thereby accelerating each fundamental process of the electrochemical reaction and extending the stable period of the electrodes during testing.
In summary, the double-pulse electrodeposition technique increases the effective reaction area of the electrode within the same volume, thereby enhancing the overall performance of the electrode. The self-made electric field sensors offer several advantages over comparable sensors, including a simpler structure, higher stability, lower noise levels, and improved portability. These features contribute to more accurate and reliable data collection and analysis.
4 Working Mechanism of the Ag/AgCl Marine Electric Field SensorMarine electromagnetic methods can be categorized into marine MT and CSEM techniques (Constable, 2013). To collect electric field signals of varying frequencies and intensities during marine MT and CSEM surveys (Lu et al., 2019; Duan et al., 2020), marine electric field sensors are essential. By analyzing and interpreting the received electromagnetic signals in the frequency domain, the electrical resistivity distribution beneath the seafloor can be accurately determined.
In marine electric field measurements, sensors are used in pairs and connected to data acquisition equipment via cables (Fig.5). The distance between each pair of sensors is denoted by d.

|
Fig. 5 Diagram illustrating the connection of a pair of sensors in marine electric field measurement. |
In Fig.5, sensors 1 and 2 are home-made Ag/AgCl electrodes utilized as reference electrodes. The potential of the Ag/AgCl electrode is determined by the Nernst equation (Feiner and McEvoy, 1994).
| $ U_{\mathrm{AgCl} / \mathrm{Ag}}=\psi_{\mathrm{AgCl} / \mathrm{Ag}}^{\Theta}+\left(R T \ln C_{\mathrm{Ag}^{+}}\right) / F, $ | (8) |
where ψAgCl/AgΘ is the standard potential of the Ag/AgCl electrode, and
The solubility product constant of AgCl (Schmuckler, 1982) is given by Ksp(AgCl)Θ = 1.77 × 10⁻¹⁰. Assuming that
| $ U_{\mathrm{AgCl} / \mathrm{Ag}}=\psi_{\mathrm{AgCl} / \mathrm{Ag}}^{\Theta}+\left[R T \ln \left(K_{\mathrm{sp}(\mathrm{AgCl})}^{\Theta} / C_{\mathrm{Cl}^{-}}\right)\right] / F . $ | (9) |
Eq. (9) demonstrates that both the ambient temperature and the concentration of Cl− in the electrolyte influence the electrode potential. The sensor pair used for marine electric field measurements is symmetrical and operates within a relatively small scale, where ambient temperature and salinity levels remain constant. As a result, the environmental influences on the sensor pairs are consistent throughout the marine electric field measurements.
The performance of a sensor is fundamentally influenced by its structure. Although the raw materials and preparation processes for the sensor pair are consistent, minor structural differences may occur, impacting the performance of individual sensors. These discrepancies, such as potential variations (UAgCl/Ag, 1 = UAgCl/Ag, 2), arise from the electrode structure rather than from the marine environment.
The potentials of the sensors in the marine environment are denoted as UO1 and UO2, which are influenced by specific test conditions such as temperature and the concentration of Cl−. UP1 and UP2 represent the potentials of the surrounding marine environment where the sensor pair is located. Consequently, the potential difference in the surrounding marine environment can be expressed as follows:
| $U_{P 1}-U_{P 2}=\left(U_{O 1}-U_{\mathrm{AgCl} / \mathrm{Ag}, 1}\right)-\left(U_{O 2}-U_{\mathrm{AgCl} / \mathrm{Ag}, 2}\right)=\left(U_{O 1}-U_{O 2}\right)-\left(U_{\mathrm{AgCl} / \mathrm{Ag}, 1}-U_{\mathrm{AgCl} / \mathrm{Ag}, 2}\right) .$ | (10) |
Under the assumption that UAgCl/Ag, 1 − UAgCl/Ag, 2 = δ, δ represents the potential difference between the pair of sensors, it follows that a more uniform performance of the electrode pair will result in a smaller potential difference. Therefore, Eq. (10) can be rewritten as
| $ {U_{P1}} - {U_{P2}} = {U_{O1}} - {U_{O2}} - \delta . $ | (11) |
Similar to the electrostatic field, the stable current field in a uniform earth can also be considered a potential field, which can be described by
| $E=-\operatorname{grad} U.$ | (12) |
Its differential form is given by
| $ E=-\Delta U / \Delta d. $ | (13) |
The electric field strength E can be expressed as
| $ E=\left(U_{P 1}-U_{P 2}\right) / d=\left(U_{O 1}-U_{O 2}-\delta\right) / d. $ | (14) |
Eq. (9) indicates that the electrode potential varies with changes in environmental conditions. If the performance of the electrodes is entirely consistent, the potential difference between the electrode pair will remain constant. Conversely, if there are variations in the environment, the potential difference will fluctuate. This phenomenon is known as potential difference drift, reflecting the fluctuations in the potential difference of the electrode pair over a continuous period of 24 h or more.
Testing the sensor pair for potential difference and potential difference drift is known as the sensor stability test. The greater the consistency of the sensors' performance, the lower their potential difference and potential difference drift, indicating higher stability of the sensor pair. This paper presents a multi-channel sensor stability test system, which comprises three components: a multi-channel data acquisition instrument (Agilent 34972A), a computer, and a water tank (plastic, dimensions: 30 cm × 30 cm × 30 cm). During the test, the paired electrodes are connected to the data acquisition instrument, allowing for direct output of the potential difference. To ensure consistency in the environmental conditions for the electrodes, the distance between the paired electrodes should be minimized. Depending on the size of the electrodes, the center-to-center distance between a pair of electrodes typically does not exceed 5 cm. The multi-channel sensor stability test system is more efficient than conventional methods.
Marine electric field signals can fluctuate over time, requiring sensors to accurately record varying electrical signals in the changing marine environment. This means the sensors must respond effectively to alterations in the test conditions. A signal generator is utilized to produce different signals, allowing for an assessment of each sensor's response consistency in both the time and frequency domains. This evaluation is commonly referred to as the active response test. To ensure that sensor pairs respond effectively to various marine signals, they must meet the following requirements: 1) In the time domain, the response waveforms and periods of all sensors should match those of the signal source; 2) In the frequency domain, the response amplitudes of all sensor pairs must be consistent, and the corresponding frequencies of the sensor pairs and the signal source should align as well.
The active response test system comprises the transmission source, emission electrodes, a data recording and storage instrument, and a water tank. This experiment was conducted in a tank measuring 100 cm × 70 cm × 30 cm tank. The transmission source used is a RIGOL DG 1022U signal generator, while the emission electrodes consist of graphite electrode plates. The data recording and storage instrument is an NI PXIe-1071. During testing, a pair of electrodes, seawater, and two graphite electrode plates of identical size were placed in the tank simultaneously. Each graphite electrode plate measures 60 cm in length and 30 cm in width, with a distance of 90 cm between the pairs of graphite electrodes. The distance between each pair of sensors is maintained at 10 cm.
During the measurement, the sensor continuously engages in electrochemical processes, generating noise that originates from the electrochemical system itself rather than from the attached instrument or any external disturbances. If the noise level of the sensor is excessively high, the effective signal may become submerged in this intense noise, making it difficult to obtain reliable electric field signals. This issue can complicate subsequent data processing. Therefore, an ultra-low-noise level is essential for sensors used in marine electric field measurements. Generally, the noise of marine electric field sensors is required to be less than 10 nV (
Noise measurement is akin to sensor stability measurement, as both aim to assess the fluctuations in the potential difference of the sensor pair. To evaluate the noise level, the recorded data is processed using Fast Fourier Transform (FFT). However, because extraneous (electrical) interference often occurs at specific frequencies during measurements, a quiet location is selected for the test to accurately capture the true noise level of the sensors. Both the sensor and the noise acquisition equipment are placed inside a shielded box during the test. The noise acquisition system includes a preamplifier unit to amplify the signal, a precision 24-bit data acquisition module to convert the electrical signal into a digital format, and a master module along with a monitoring module to store and process the digital signal.
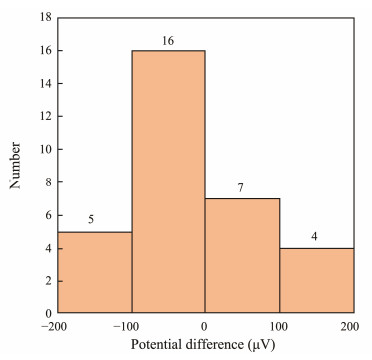
5 Results and Discussion 5.1 Stability Test of the Ag/AgCl Marine Electric Field SensorThe double-pulse electrodeposition method was employed to prepare 32 pairs of Ag/AgCl electrochemical electrodes. Following this, the potential difference of each electrode pair was tested for 50 h, and the mean value was calculated. The distribution of the average potential difference is illustrated in Fig.6. The measured potential differences were less than ±200 μV, with 72% of the measurements falling within ±100 μV. Four pairs of electrodes, exhibiting potential differences of less than ±100 μV, were tested over a period of 20 d. These sensor pairs were designated as A, B, C, and D.
|
Fig. 6 Potential difference distribution of 32 pairs of Ag/AgCl electrodes. |
Fig.7 illustrates the time series of the potential difference for four pairs of sensors, while Table 1 summarizes their main parameters. The potential difference drift of each sensor pair changes over time, with the potential difference for all pairs varying from −24.76 μV to 62.07 μV.

|
Fig. 7 Time series of the potential difference for four pairs of sensors. |
|
|
Table 1 Parameters of electrode stability test |
To evaluate the stability of the sensor pair during longterm testing, considering the maximum, minimum, and drift values of the potential difference is essential. Additionally, the mean value and standard deviation of the potential difference serve as important evaluation parameters. The potential difference should ideally fall within the range of −1 mV to 1 mV, with a preference for smaller drift values. For example, while sensor pair A has the largest mean value of potential difference, it also exhibits the smallest standard deviation, indicating minimal dispersion of the potential difference during the test. Consequently, this pair of sensors is regarded as the most stable. Table 1 indicates that the potential difference for each pair of sensors falls within the range of −100 μV to 100 μV. Thus, at the micro-level, the structural differences between the sensors are minimal, and variations in the test environment – such as temperature and ion concentration – exert nearly identical effects on each sensor.
All sensor pairs were categorized for two applications based on their stability. Sensor pairs A and B were employed to measure the marine electric field, while sensor pairs C and D remained on the boat as backup sensors. Sensor pairs C and D underwent the same handling and transport procedures as sensor pairs A and B.
For all sensor pairs, the minimum potential difference drift is 2.77 μV per 24 h (equivalent to 17.10 μV per 20 d). This electrode exhibits a smaller potential difference drift compared with Ag/AgCl electrodes prepared by other methods, such as calcination (less than 10 μV per 24 h) (Luo et al., 2020) and DC electrolysis (less than 5 μV per 24 h) (Wang et al., 2014). For other types of marine electric field electrodes, such as the controllable 3D flower-like Ag-CF electrode and the flexible composite Ag-AgNWs-CF electrode, the potential difference drift values were 18.62 μV per day (Hu et al., 2023) and 67.22 μV per day (Hu et al., 2022), respectively. Consequently, the sensor pair prepared using the double-pulse electrodeposition method demonstrates excellent stability over an extended period.
5.2 Active Response Test of the Ag/AgCl Marine Electric Field SensorThe active response test of the sensor is a crucial indicator for evaluating the performance of the sensor pair, as it measures how the self-made sensor pair responds to different signals. Theoretically, if the area of the signal source used in the active response test is infinite and the volume of the electrode is negligible compared with the area of the signal source, the electrode can be considered to be positioned in a uniform electric field. In practice, the electric field generated may not be uniform due to the limited size of the emitter electrode area in the signal source used for the active response test system and the relatively large distance between the graphite electrode plates. Consequently, the relationship between the sensor pair response intensity and the signal source remains uncertain. Therefore, we focus on assessing the consistency of their waveforms and associated frequencies.
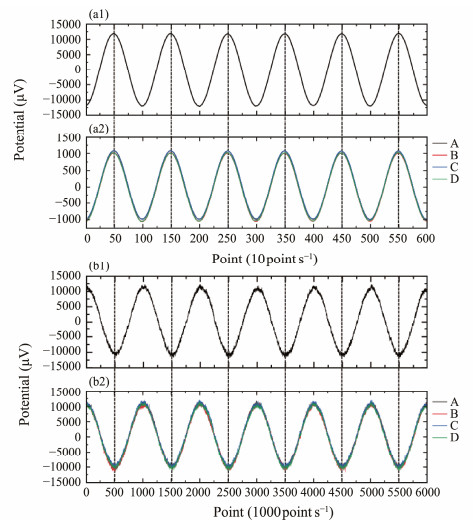
In the test, the signal generator successively outputs sinusoidal signals at frequencies of 0.1 and 1 Hz. The results, illustrated in Fig.8, demonstrate that all pairs of sensors respond effectively to the sine wave at each frequency. Under identical conditions, the period and waveform of all sensors match those of the signal source, and the amplitudes of the response results from each sensor are nearly the same. All the test results indicate small differences in the DC bias of each sensor response, which may arise from environmental factors or the test instrumentation. Additionally, the smoothness of the signal source and the sensor response curve reduces as the sampling rate increases, leading to glitches, as evidenced in the 1 Hz test results. Environmental noise is the primary contributor to this issue.
|
Fig. 8 Time series of sensor pair responses during the active response test, with signal sources at frequencies of 0.1 Hz (a1) and 1 Hz (b1) and corresponding sensor responses at 0.1 Hz (a2) and 1 Hz (b2). |
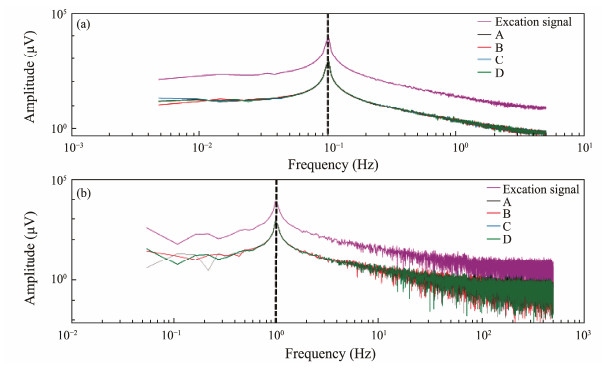
In the frequency domain, the test results were transformed using FFT to assess the consistency of the sensor responses (Fig.9). From Fig.9a, the amplitudes of the response results from all sensor pairs are consistent at a frequency of 0.1 Hz. Additionally, the frequencies of the responses from all sensor pairs match that of the signal source. Similar conclusions can be drawn from Fig.9b.
|
Fig. 9 Amplitude spectra of the sensor pair during the active response test at frequencies of 0.1 Hz (a) and 1 Hz (b). |
In summary, the homemade Ag/AgCl sensor pairs exhibit strong responsiveness to the signal source in both the time and frequency domains. Moreover, the responses of multiple sensors under the same conditions are consistent and satisfactory. Therefore, the self-made sensors prepared using the double-pulse electrodeposition method demonstrate excellent active response performance.
5.3 Noise and Deep-Water Measurement of the Ag/AgCl Marine Electric Field Sensor 5.3.1 Noise assessmentThe electrode pairs are connected to the signal acquisition equipment for sensor noise evaluation. It is crucial to know the system noise (both instrumental and ambient) a priori. When the inputs of the signal acquisition unit are short-circuited, it records only the noise from the measurement system, excluding any extraneous noise captured by the sensor. Once the instrument noise is established, the noise level of the sensor can be accurately determined.
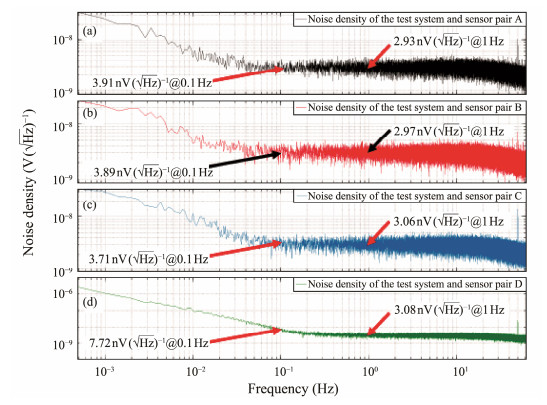
The noise levels of the test system in this study at 1 Hz and 0.1 Hz are 2.87 nV (
|
Fig. 10 Noise density for the test system and sensor pairs. |
| $ \sqrt{\left(2.93^2-2.87^2\right)} \mathrm{nV}(\sqrt{\mathrm{~Hz}})^{-1}=0.59 \mathrm{nV}(\sqrt{\mathrm{~Hz}})^{-1}. $ |
The noise of the sensor pair A at 0.1 Hz is given by
| $ \sqrt{\left(3.91^2-3.02^2\right)} \mathrm{nV}(\sqrt{\mathrm{~Hz}})^{-1}=2.48 \mathrm{nV}(\sqrt{\mathrm{~Hz}})^{-1}. $ |
Similarly, the noise levels of sensor pairs B, C, and D can be calculated, as presented in Table 2.
|
|
Table 2 Noise level of the sensor pair |
The noise levels of Ag/AgCl marine electric field electrodes prepared by DC electrolysis and calcination were reported as 0.6 nV (
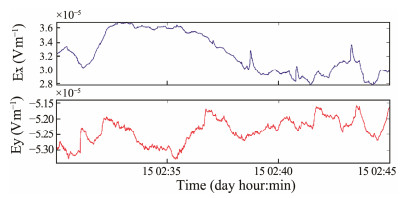
Marine electric field measurements were conducted in the South China Sea using sensor pairs positioned at a depth of 2805 m. The measurements spanned several days, with sensor pairs A and B designated for the Ex and Ey channels of the survey site, respectively. Fig.11 illustrates a portion of the time series of horizontal electric field signals recorded in the South China Sea.
|
Fig. 11 Time series of the horizontal electric field components Ex (top) and Ey (bottom) measured on the seafloor. |
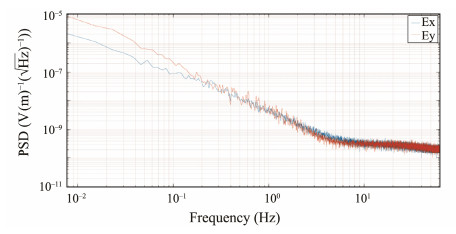
The power spectral densities were calculated from the time series illustrated in Fig.11 using the FFT. As illustrated in Fig.12, the signal intensity gradually decreases with increasing frequency. The signal strength is notably weak for frequencies above 10 Hz, which aligns with the findings of geoelectric tests conducted in the western waters of the United States (Fujii and Chave, 1999).
|
Fig. 12 Spectral curves of electric fields measured in deep water. The blue line represents Ex, and the red line represents Ey. |
In this paper, we demonstrate that double-pulse electrodeposition is an effective method for preparing marine electric field sensors. This technique enhances the specific surface area of the electrode and improves the overall performance of the sensor. The sensor, composed of an electrode core and sheath, exhibits excellent performance in both laboratory and deep-sea measurements. The potential difference of the sensor pairs does not exceed ±62.1 μV, with typical potential difference drift values of 2.77 μV per 24 h and 17.10 μV per 20 d. All sensor pairs respond to the source signal without distortion, and the noise level at 1 Hz is 0.59 nV (
The study is supported by the National Natural Science Foundation of China (Nos. U23B20158, 91958210, 4200 4055). We thank the crew of 'DongFangHong 3' during cruise NORC2022-05, as well as the OUCEM laboratory technicians for their excellent support. We also thank Mr. Zeyu Lu for the helpful discussions on the use of relevant tools.
Author Contributions
All authors contributed to the study conception and design. Conceptualization, methodology, visualization and data curation were performed by Chenjuan Wang. Validation and formal analysis were performed by Yuguo Li, Jie Lu and Chenjuan Wang. Investigation and resources were performed by Chenjuan Wang, Tianyi Dai and Zhihao Zhong. Debugging of data recorder instruments in noise test system were performed by Lanjun Liu and Jialin Chen. Yuguo Li was responsible for the acquisition of funding acquisition, project administration and supervision. The draft of the manuscript was written by Chenjuan Wang, and all authors read and approved the final manuscript.
Data Availability
All data generated and analyzed during this study are included in this published article and its additional files.
Declarations
Ethics Approval and Consent to Participate
This article does not contain any studies with human participants or animals performed by any of the authors.
Consent for Publication
Informed consent for publication was obtained from all participants.
Conflict of Interests
The authors declare that they have no conflict of interests. Yuguo Li is one of the Editorial Board Members, but he was not involved in the journal's review of, or decision related to, this manuscript.
Bard, A. J., Faulkner, L. R., and White, H. S., 2022. Electrochemical Methods: Fundamentals and Applications. 3rd edition. John Wiley & Sons, Chichester, 580-631.
(  0) 0) |
Böckris, J., Reddy, A., and Gamboa-Aldeco, M., 2002. Modern Electrochemistry. Fundamentals of Electrodics. 2nd edition. Kluwer Academic, New York, 1035-1400.
(  0) 0) |
Chen, K., Wei, W. B., Deng, M., Wu, Z. L., and Yu, G., 2015. A seafloor electromagnetic receiver for marine magnetotellurics and marine controlled-source electromagnetic sounding. Applied Geophysics, 12: 317-326. (  0) 0) |
Constable, S., 2010. Ten years of marine CSEM for hydrocarbon exploration. Geophysics, 75(5): 75A67-75A81. (  0) 0) |
Constable, S., 2013. Instrumentation for marine magnetotelluric and controlled source electromagnetic sounding. Geophysical Prospecting, 61: 505-532. DOI:10.1111/j.1365-2478.2012.01117.x (  0) 0) |
Constable, S., Orange, A. S., Hoversten, G. M., and Morrison, H. F., 1998. Marine magnetotellurics for petroleum exploration Part Ⅰ: A sea-floor equipment system. Geophysics, 63(3): 816-825. (  0) 0) |
Crona, L., Fristedt, T., Lundberg, P., and Sigray, P., 2001. Field tests of a new type of graphite-fiber electrode for measuring motionally induced voltages. Journal of Atmospheric and Oceanic Technology, 18(1): 92-99. (  0) 0) |
Duan, S. M., Hölz, S., Dannowski, A., Schwalenberg, K., and Jegen, M., 2021. Study on gas hydrate targets in the Danube Paleo-Delta with a dual polarization controlled-source electromagnetic system. Marine and Petroleum Geology, 134: 105330. (  0) 0) |
Duan, S. M., Li, Y. G., Pei, J. X., Zhao, T. H., Wu, Z. Q., Han, B., et al., 2020. Carbonate imaging with magnetotellurics in a shallow-water environment, South Yellow Sea, China. Journal of Applied Geophysics, 178: 104076. (  0) 0) |
Eidesmo, T., Ellingsrud, S., MacGregor, L. M., Constable, S., Sinha, M. C., Johansen, S. E., et al., 2002. Sea Bed Logging (SBL), a new method for remote and direct identification of hydrocarbon filled layers in deepwater areas. First Break, 20: 144-152. (  0) 0) |
Feiner, A. S., and McEvoy, A. J., 1994. The Nernst equation. Journal of Chemical Education, 71(6): 493-494. (  0) 0) |
Filloux, J. H., 1973. Techniques and instrumentation for study of natural electromagnetic induction at sea. Physics of the Earth and Planetary Interiors, 7(3): 323-338. (  0) 0) |
Fujii, I., and Chave, A. D., 1999. Motional induction effect on the planetary-scale geoelectric potential in the eastern North Pacific. Journal of Geophysical Research, 104(1): 1343-1359. (  0) 0) |
Hu, Z. H., He, T. C., Li, W. H., Huang, J. P., Zhang, A. Q., Wang, S. Y., et al., 2023. Controllable 3D flower-like Ag-CF electrodes as flexible marine electric field sensors with high stability. Inorganic Chemistry, 62(8): 3541-3554. DOI:10.1021/acs.inorgchem.2c04039 (  0) 0) |
Hu, Z. H., Peng, Y. D., Guo, D. Q., Li, W. H., He, T. C., Bao, Z. Y., et al., 2022. Flexible composite Ag-AgNWs-CF as low noise marine electric field sensor. Composites Part A: Applied Science and Manufacturing, 152: 106711. DOI:10.1016/j.compositesa.2021.106711 (  0) 0) |
Iqbal, M. P., 2012. Lead pollution – A risk factor for cardiovascular disease in Asian developing countries. Pakistan Journal of Pharmaceutical Sciences, 25(1): 289-294. (  0) 0) |
Key, K., 2012. Marine electromagnetic studies of seafloor resources and tectonics. Surveys in Geophysics, 33: 135-167. (  0) 0) |
Leal, M. C., Anaya-Rojas, J. M., Munro, M. H. G., Blunt, J. W., Melian, C. J., Calado, R., et al., 2020. Fifty years of capacity building in the search for new marine natural products. Proceedings of the National Academy of Sciences, 117(39): 24165-24172. (  0) 0) |
Lee, S., Yang, C. S., and Chung, H. J., 2022. Development of multi-rod type Ag-AgCl electrodes for an underwater electric field sensor. Journal of Sensor Science and Technology, 31(1): 45-50. (  0) 0) |
Lee, W. H., Tang, S. C., and Chung, K. C., 1999. Effects of direct current and pulse-plating on the co-deposition of nickel and nanometer diamond powder. Surface and Coatings Technology, 120: 607-611. (  0) 0) |
Li, G., and Li, Y. G., 2017. Joint inversion for transmitter navigation and seafloor resistivity for frequency-domain marine CSEM data. Journal of Applied Geophysics, 136: 178-189. (  0) 0) |
Lu, J., Li, Y. G., and Du, Z. J., 2019. Fictitious wave domain modelling and analysis of marine CSEM data. Geophysical Journal International, 219(1): 223-238. (  0) 0) |
Luo, W., Dong, H. B., Xu, J. M., Ge, J., Liu, H., and Zhang, C., 2020. Development and characterization of high-stability allsolid-state porous electrodes for marine electric field sensors. Sensors and Actuators A: Physical, 301: 111730. (  0) 0) |
Mohan, S., and Raj, V., 2005. A comparative study of DC and pulse gold electrodeposits. Transactions of the IMF, 83(2): 72-76. (  0) 0) |
Northrop, R. B., 1990. Analog Electronic Circuits: Analysis and Applications. Addison-Wesley, New York, 265-307.
(  0) 0) |
Pellicer, E., Gómez, E., and Vallés, E., 2006. Use of the reverse pulse plating method to improve the properties of cobalt-molybdenum electrodeposits. Surface and Coatings Technology, 201(6): 2351-2357. (  0) 0) |
Petiau, G., and Dupis, A., 1980. Noise, temperature coefficient, and long time stability of electrodes for telluric observations. Geophysical Prospecting, 28(5): 792-804. (  0) 0) |
Raj, K., and Das, A. P., 2023. Lead pollution: Impact on environment and human health and approach for a sustainable solution. Environmental Chemistry and Ecotoxicology, 5: 79-85. (  0) 0) |
Rootare, H. M., and Powers, J. M., 1977. Preparation of Ag/AgCl electrodes. Journal of Biomedical Materials Research, 11: 633-635. (  0) 0) |
Schmuckler, J. S., 1982. Solubility product constant, Ksp. Journal of Chemical Education, 59(3): 245-246. (  0) 0) |
Wang, Z. D., Deng, M., Chen, K., Wang, M., Zhang, Q. S., and Zeng, D., 2014. Development and evaluation of an ultralownoise sensor system for marine electric field measurements. Sensors and Actuators A: Physical, 213: 70-78. (  0) 0) |
Webb, S. C., Constable, S., Cox, C. S., and Deaton, T. K., 1985. A seafloor electric field instrument. Journal of Geomagnetism and Geoelectricity, 37(12): 1115-1129. (  0) 0) |
Wei, Y. G., Cao, Q. X., Huang, Y. X., Wang, Y. P., and Li, G. F., 2012. Performance of Ag/AgCl porous electrode based on marine electric field measurement. Rare Metal Materials and Engineering, 41(12): 2173-2177. (  0) 0) |
 2025, Vol. 24


