2) Polar Research Institute of China (PRIC), Shanghai 200000, China;
3) College of Mathematical Science, Inner Mongolia Normal University, Hohhot 010022, China
Internal solitary waves (ISWs) are a ubiquitous phenomenon in marginal seas (Jackson, 2007). Along with strong horizontal and vertical currents, large-amplitude ISWs can propagate a long distance from their generation sites while keeping their waveform nearly invariant (e.g., Alford et al., 2010; Lien et al., 2012, 2014; Huang et al., 2014, 2016). As a result, large-amplitude ISWs have the potential to damage offshore engineering structures (Xu et al., 2012) and considerably impact nutrient transport systems (Dong et al., 2015). When ISWs shoal onto slopes or shelf topographies, they break down, thereby inducing enhanced turbulent mixing (Vlasenko et al., 2002; Moum et al., 2007; Vlasenko and Stashchuk, 2007; Sutherland et al., 2013; Lamb, 2014; Jones et al., 2020).
Overall, the generation of ISWs is closely related to the tide-topography interactions. The generation of ISWs has several mechanisms. One mechanism is the nonlinear steepening of internal tides (Lee and Beardsley, 1974). For moderate tidal currents, linear internal waves are first generated over topography. As they radiate away from such landforms, they gradually evolve into ISWs (Farmer et al., 2009; Buijsman et al., 2010; Li and Farmer, 2011; Li, 2014; Alford et al., 2015). The second mechanism is the formation of lee waves (Maxworthy, 1979). In the presence of strong tidal currents, depression waves are formed on the leeward side of the topography by supercritical tidal flow. As the tidal flow weakens, the depression wave starts to propagate upstream and then develops into ISWs near topography. The third mechanism is the 'local' formation of ISWs induced by the interaction of internal wave beams with the thermocline (Gerkema, 2001). In addition to the aforementioned mechanisms, ISWs can be generated by other mechanisms, e.g., local collapse events (Maxworthy 1979), internal hydraulic jumps (Cummins et al., 2006), and upstream influences (Raju et al., 2021).
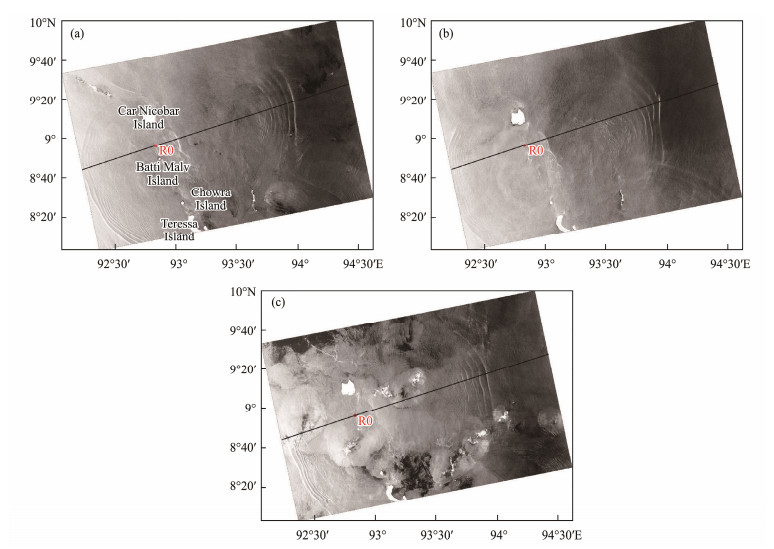
The Andaman Sea (AS) is located in the northeast Indian Ocean. Because of the presence of shallow ridges, strong stratification tendencies, and tidal currents, the AS is regarded as a hotspot for the generation of ISWs. Since the oceanographic survey of Perry and Schimke (1965), numerous studies of ISWs through in situ measurements, remote sensing, and numerical modeling have been conducted (e.g., Osborne and Burch, 1980; Alpers et al., 1997; Jackson et al., 2012; Jensen et al., 2020; Magalhaes et al., 2020; Raju et al., 2021). Several types of ISWs are active in the AS, including rank-ordered first-mode wave packets and high-mode waves (da Silva and Magalhaes, 2016; Magalhaes and da Silva, 2018; Raju et al., 2019). ISWs in the AS are mainly generated in the western island chain, which includes the Nicobar Archipelago and Andaman Islands (Raju et al., 2019, 2021; Jensen et al., 2020; Magalhaes et al., 2020). With a steep topography and a high degree of barotropic to baroclinic energy conversion (Mohanty et al., 2018), multiple channels in the Nicobar Archipelago are potential generation points of ISWs (Raju et al., 2019, 2021; Jensen et al., 2020). In Figs. 1a – c, bidirectional ISWs propagating from submarine ridge R0 located at 92.83˚E, 8.94˚N are visible in the channel between Car Nicobar Island and Batti Malv Island. Using synthetic aperture radar (SAR) imagery from TerraSAR-X in the AS between 8˚N and 10˚N, Magalhaes and da Silva (2018) showed the pattern of ISWs in that region and noted that the generation of ISWs is attributed to the beam-pycnocline interactions. A study conducted by Magalhaes et al. (2020) revealed that the topographic characteristics of the 10˚N channel play an important role in the generation of secondary ISWs. Through nonhydrostatic three-dimensional modeling, Raju et al. (2021) described the generation mechanisms of ISWs in the channel between Car Nicobar Island and Batti Malv Island and the channel between Batti Malv Island and Chowra Island. As mentioned previously, the mechanism of the generation of ISWs in the channel shown in Fig. 1 is still controversial, and the factors that affect the generation of ISWs therein have not been adequately explored, which motivates this work.
|
Fig. 1 Sentinel-1 advanced synthetic aperture radar (ASAR) image of the Bay of Bengal acquired at (a) 12:00 UTC on April 12, 2017, (b) 12:00 UTC on March 02, 2018, and (c) 12:00 UTC on May 01, 2018. The topographic section in the numerical simulation is marked with black lines. |
In this work, to explore the generation and evolution of ISWs from the ridge located at 92.83˚E, 8.94˚N, numerical simulations are performed. Moreover, several sensitivity experiments are conducted to examine the corresponding influencing factors. The remainder of this paper is organized as follows: Section 2 presents the model setup and the nondimensional parameters considered in the ISW dynamics. Section 3 presents the results of the standard run. Section 4 discusses the impacts of topography, tidal forcing, and seasonal stratification on the generation and evolution of ISWs. Finally, Section 5 presents the summary along with some further discussions.
2 Methodology 2.1 Model SetupIn this work, a fully nonlinear nonhydrostatic model, i.e., the Massachusetts Institute of Technology General Circulation Model (MITgcm; Marshall et al., 1997), is employed. For simplification, a 2D (x–z plane) configuration is considered. The horizontal direction resolution is 500 m in the central region, which is sufficient to scrutinize detailed wave structures and comparable to that used in previous studies (Buijsman et al., 2010; Li, 2014; Vlasenko et al., 2018); it is gradually stretched to 1 km toward the open boundaries. The vertical direction has 140 uneven layers, with thicknesses increasing from 10 m near the surface to 50 m near the bottom. The time step is set to 15 s, which satisfies the Courant-Friedrichs-Lewy condition, and the results are outputted every 10 min. The Coriolis frequency is 2.28 × 10⁻⁵ s−1, corresponding to a latitude of 9˚N. The horizontal viscosity is set to vh = 25 m2 s−1 to suppress grid-scale noise (Legg and Huijits, 2006), and the horizontal diffusivity is set to κh = 10−3 m2 s−1. The PP81 scheme (Pacanowski and Philander, 1981) is applied to calculate vertical viscosity and diffusivity, as follows:
| $ \nu = \frac{{{\nu _0}}}{{{{(1 + \mu Ri)}^n}}} + {\nu _b}, $ | (1) |
| $ \kappa = \frac{\nu }{{(1 + \mu Ri)}} + {\kappa _b}, $ | (2) |
where Ri is the Richardson number, N is the buoyancy frequency, and νb = 10−5 m2 s−1 and κb = 10−5 m2 s−1 are the background viscosity and diffusivity values, respectively. Following previous studies, we set ν0 = 1.5 × 10⁻² m2 s−1, α = 1, and n = 1 (e.g., Vlasenko et al., 2010, 2012; Min et al., 2019; Wang et al., 2020). Sponge layers are added to the east and west boundaries to avoid the reflection of baroclinic waves. Moreover, the no-slip condition is applied to the bottom boundary. The model is forced by adding a force to the right-hand side of the momentum equations (Vlasenko et al., 2010, 2012; Guo et al., 2011), which have the following forms: Fx = UH0 /H(x)ωcos(ωt) and Fy = UH0 /H(x)fsin(ωt) in the zonal and meridional directions, respectively. H0 is the depth where the barotropic tide has velocity U, H(x) is the local water depth, and f is the Coriolis parameter. All of the simulations are performed for seven days.
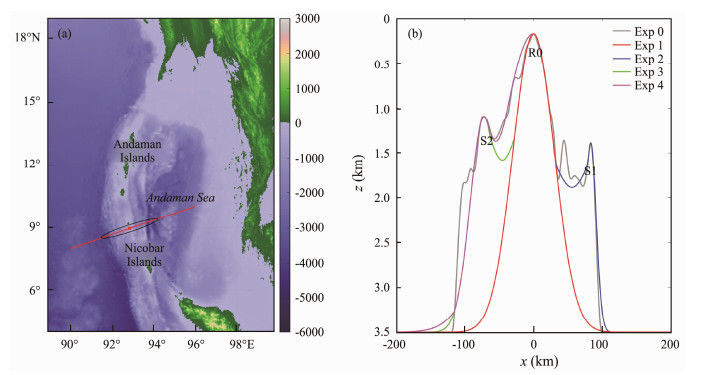
Bathymetry data are extracted from the ETOPO1 global dataset along the transect shown in Fig. 2, which has a direction that is generally consistent with the propagating direction of ISWs (Fig. 1). The maximum depth is set to 3500 m. In addition to crest R0, the realistic topography has several sills (Fig. 2b). To explore the impact of topography on the generation and evolution of ISWs, several sensitivity experiments are performed (i.e., Exps 1 – 4 in Table 1). In Exp 1, a fitted Gaussian ridge is used. In Exp 2 and Exp 3, the fitted Gaussian ridges of R0 + S1 and R0 + S2 are considered to explore the role of small sills. To further discuss the effect of distinct topographic structures, the modified topography R0 + S2 is used in Exp 4.
|
Fig. 2 (a) Bathymetry of the AS. The black line denotes the tidal ellipse of M2 at R0, and the red line denotes the transect of the 2D domain of the simulation corresponding to (b). Sills S1 and S2 surround ridge R0, which affect the generation of ISWs from R0. Notably, the west flank of R0 has more distinct characteristics, i.e., a smoother slope and shallower depth, than the east flank. |
|
|
Table 1 Configurations of the sensitivity experiments |
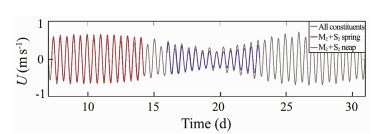
The barotropic tidal currents are extracted by the Oregon State University Tidal Inversion Software (OTIS; Egbert and Erofeeva, 2002) global atlas (TPXO7.2) at 92.83˚E, 8.94˚N. As shown in Table 2, semidiurnal tides are predominant in the AS, which has also been noted in previous studies (e.g., da Silva and Magalhaes, 2016; Raju et al., 2019). By contrast, the contribution of diurnal tides can be negligible (Table 2). In a standard run, only M2 tidal force is imposed. To explore the variation in the generation of ISWs during the spring and neap tides, the M2 and S2 tides are considered in the sensitivity runs (Fig. 3).
|
|
Table 2 Data on the major axis of the tidal ellipse of eight principal tidal constituents |
|
Fig. 3 Tidal currents at R0 (92.83˚E, 8.94˚N) derived using OTIS. |
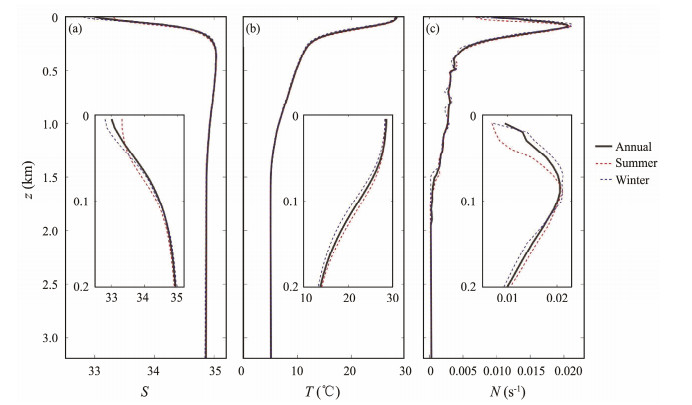
Horizontally uniform stratification is employed in this work and extracted from the World Ocean Atlas 2018 dataset. The maximum buoyancy frequency is located at 90 m and has a value of 0.021 s−1 (Fig. 4). Given that stratification could affect the generation of ISWs, summer and winter stratifications are used in the sensitivity runs (i.e., Exp 7 and Exp 8 in Table 1) for the corresponding exploration.
|
Fig. 4 Initial (a) salinity, (b) temperature, and (c) buoyancy frequency profiles. |
As proposed in previous studies (Buijsman et al., 2010; Guo et al., 2011; Vlasenko et al., 2012), several nondimensionless parameters control the generation of ISWs:
1) The tidal excursion length is expressed as σ = U/(Lω), where L is the horizontal topographic length scale and U is the amplitude of the tidal current. When σ << 1, only internal tides with a given tidal frequency are generated. However, when σ >> 1, internal lee waves along with higher harmonics are formed (Bell, 1975). When σ ~ 1, a 'mixed tidal lee wave' regime appears because the time derivative and advection provide comparable contributions (Nakamura et al., 2000; Vlasenko et al., 2005).
2) The slope criticality parameter is expressed as γ = (dh/dx)/α, where dh/dx is the topographic slope and α =
3) The topographic Froude number is expressed as Frt = U/(NmaxH), where Nmax is the maximum value of N(z) and H is the topographical height (Legg and Huijts, 2006; Legg and Klymak, 2008). This parameter describes the occurrence of blocking and the nonlinear hydraulic effects caused by topography. When Frt < 1, the topography affects the flow, resulting in the occurrence of blocking. By contrast, when Frt > 1, the topography has a negligible effect on the flow. When Frt ~ 1, tidal flows over a given topographical setting share common properties in terms of their harmonic oscillation and the presence of unsteady lee waves, which indicate mixed tidal lee waves (Nakamura et al., 2000).
4) The internal Froude number is defined as the ratio of the barotropic velocity U to the internal wave speed of each mode ci, i.e., Frw = U/ci. The linear internal wave speed c is calculated by solving the boundary value problem (Gill, 1982) along with the prescribed boundary condition φ (0) = φ (−H) = 0, as follows:
| $ \frac{{{{\text{d}}^2}\phi (z)}}{{{\text{d}}z}} + \frac{{{N^2}(z)}}{{{c^2}}}\phi (z) = 0. $ | (3) |
Waves behave linearly when Frw << 1 but become nonlinear when Frw >> 1.
Potential generation points of internal waves can be predicted by calculating the internal body force (IBF), as follows:
| $ IBF = {\rho _0}Uh(x)z\frac{{N_z^2}}{\omega }{\left[ {\frac{1}{{h(x)}}} \right]_x}, $ | (4) |
where U and ω are the amplitude and frequency of barotropic tides, respectively (Baines, 1973; Li, 2014; Vlasenko et al., 2018).
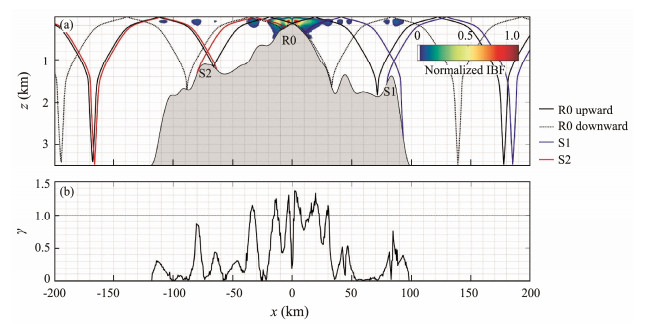
The dominant generation point of internal waves is R0, as shown in Fig. 5a. The amplitude of the barotropic current on R0 is approximately 0.4 m s−1. As shown in Table 3, the topographic Froude value is 0.286 for the realistic topography, indicating the occurrence of blocking. When σ << 1 and γ > 1, ridge R0 falls within Regime 5 according to Garrett and Kunze (2007), featuring higher harmonics.
|
Fig. 5 (a) Normalized internal body force for realistic bathymetry. The red, blue, and green lines denote the ray paths from R0, S1, and S2, respectively, which are calculated by the linear dispersion relation |
|
|
Table 3 Physical parameters for ISWs generated in the AS |
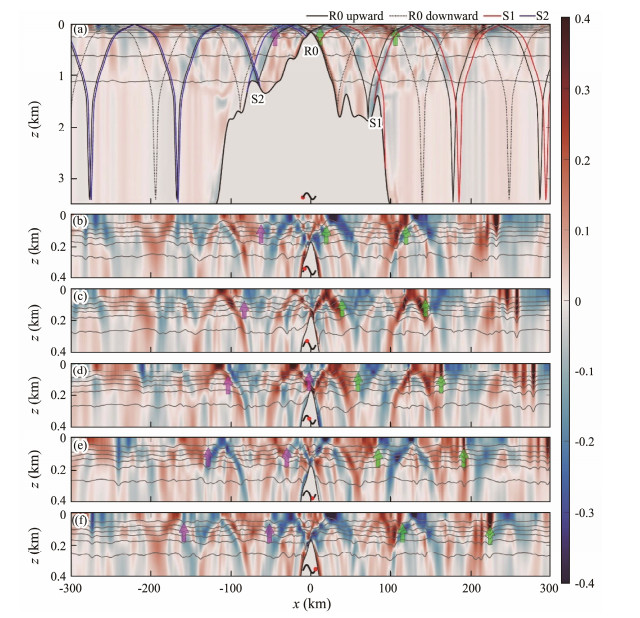
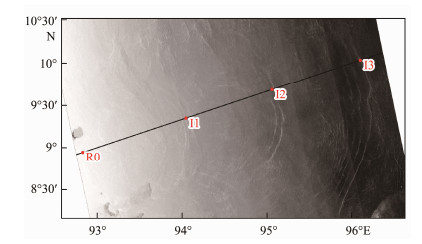
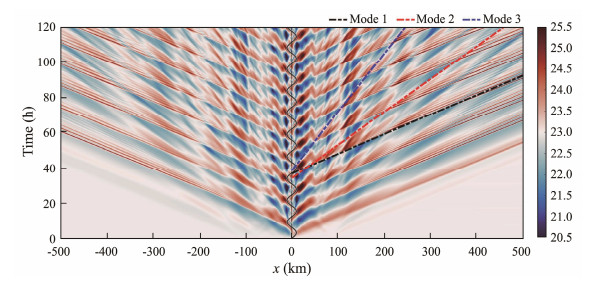
Fig. 6 displays the snapshots of the horizontal baroclinic velocities along with the isotherms within one tidal cycle. Overall, the generation points of internal wave beams are consistent with their predicted IBFs shown in Fig. 5a. The internal wave beams (black lines in Fig. 6a) are supercritically generated from R0 and propagate obliquely according to the dispersion relation following Regime 5 proposed by Garrett and Kunze (2007). Meanwhile, internal wave beams radiating from S1 and S2 are also visible (blue and red lines in Fig. 6a). Far from the topographic landforms, beam-like structures gradually become invisible, whereas low-mode waves are dominant because high-mode waves are always dissipated locally because of a strong vertical shear force (Pickering and Alford, 2012). Moreover, at the start of flood or ebb tides, depression waves on the leeward side of the topographic feature are visible. As they propagate downstream, the depression waves evolve into rank-ordered ISW packets (colored arrows in Fig. 6). The locations of leading waves in the simulation results are compared with those in the SAR image, as shown in Fig. 7. Generally, the locations of leading waves and the distance between two wave packets in the simulation results are consistent with those observed in the SAR image, which validates the simulation results. Fig. 6 indicates that the eastward ISWs are more energetic than the westward ISWs. The Hovmöller diagram of T(x, t) at z = 100 m is shown in Fig. 8. ISW packets with a speed of c1 = 2.51 m s−1, which are indicated by diagonal fingers, are consistent with those obtained using Eq. (3). Moreover, second-mode and third-mode internal waves with speeds of c2 = 1.49 m s−1 and c3 = 0.83 m s−1, respectively, which are consistent with the theoretical values, are detected in Fig. 8. However, these high-mode internal waves do not evolve into ISWs.
|
Fig. 6 Snapshots of horizontal baroclinic velocities (shadings, unit: m s−1) and isotherms (gray contours) during a tidal cycle. The phase of each snapshot is denoted by a red dot. The characteristic rays of internal waves are denoted by colored lines. The green and violet arrows denote the eastward-propagating and westward-propagating ISWs, respectively. |
|
Fig. 7 ENVISAT ASAR image of the Andaman Sea acquired at 15:48 UTC on March 1, 2009. The topographic section in the numerical simulation is marked with a black line. The locations of leading waves in the simulation results are marked by red dots (I1, I2, and I3). |
|
Fig. 8 Hovmöller diagram of T(x, t) (shading, unit: ℃) at z = 100 m for Exp 1. The black line denotes the barotropic tidal current at R0, and the black, red, and blue dash-dotted lines denote the first-mode, second-mode, and third-mode internal waves, respectively. |
By tracing the waves back to the generation sites, the generation of ISWs is determined to be related to the time when the tidal flow pattern changes its direction. Figs. 6 and 8 reveal that ISWs trace back to depression waves (marked by colored arrows in Fig. 6), which originate from the downstream tidal flow. The depression waves downstream propagate approximately 100 km before they evolve into ISWs. Therefore, the generation mechanism of bidirectional ISWs is the nonlinear steepening of internal tide mechanisms (Lee and Beardsley, 1974; Bujisman et al., 2010). The flood tide moves from west to east of R0; a depression wave propagates away from topography and evolves into a rank-ordered ISW packet because of its nonlinearity. Moreover, no ISWs evolved from elevation waves propagating from R0.
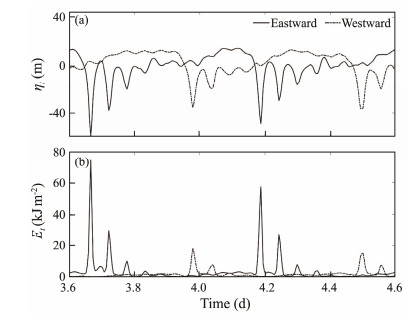
The characteristics of ISWs can be examined through the times series of vertical displacement and energy. As shown in Fig. 9a, overall, both eastward-moving and westward-moving ISWs behave as rank-ordered wave packets, which are consistent with the results derived from SAR images (Fig. 1). However, the eastward waves have a larger amplitude (59.1 m) than the western waves (40.3 m) and involve more secondary waves in the packets. This result indicates the generation of asymmetric ISWs. More over, the energy of ISWs is calculated as the sum of baroclinic kinetic energy and available potential energy (Buijsman et al., 2010), as follows:
| $ {E_k} = \frac{1}{2}{\rho _0}\int_{ - H}^0 {({u^2} + {w^2})} {\text{d}}z, $ | (5) |
| $ {E_p} = \frac{1}{2}{\rho _0}\int_{ - H}^0 {\frac{{{b^2}}}{{{N^2}}}} {\text{d}}z, $ | (6) |
|
Fig. 9 (a) Vertical displacement of the 9.8℃ isotherms and (b) depth-integrated energy for eastward and westward ISWs at x = ±300 km. |
where u is the baroclinic velocity, w is the vertical velocity, and b = −gρ'/ρ0 is the buoyancy (where ρ0 and ρ' are the background and perturbation densities, respectively). The energy of the eastward ISWs reaches 74.2 kJ m−2, which is four times larger than that of the westward ISWs which have negligible energy of secondary waves. These results indicate that, although ISWs are observed in both the Bay of Bengal (BoB) and the AS, ISWs in the two regions have different intensities. ISWs in the AS are more energetic than those in the BoB.
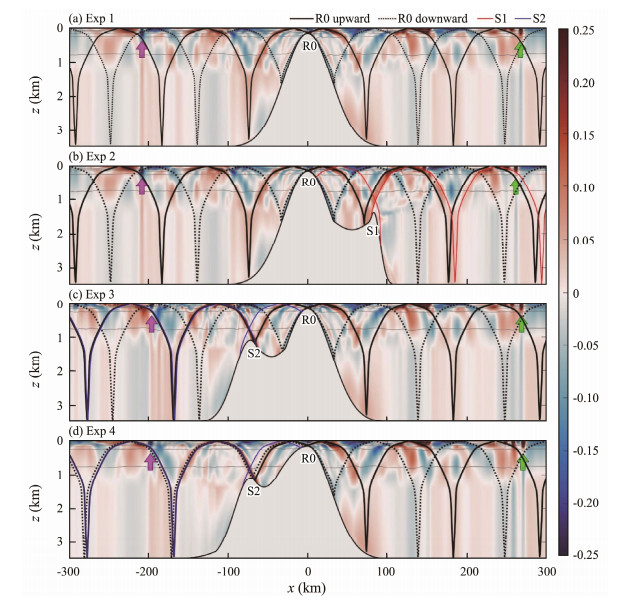
4 Sensitivity Experiments 4.1 Topographic FeaturesThe asymmetry of ISWs on the west and east sides of the landform is described in Section 3; this asymmetry is related to the asymmetric features of the topography. Therefore, sensitivity runs (i.e., Exps 1 – 4) are performed to explore the impact of topography on the generation of ISWs. The topography utilized in Exp 1 only features the Gaussian fitting of R0 (Fig. 10b), whereas the topographies employed in Exp 2 and Exp 3 fit R0 + S1 (Fig. 10c) and R0 + S2 (Fig. 10d), respectively. In Exp 1 (Fig. 10a), because the ridge is supercritical, both upward and downward internal tidal beams are observed. Consistent with Exp 0, no ISWs are generated near the landform. Rank-ordered ISW packets emerge approximately 100 km away from ridge crest R0. The generation mechanism of bidirectional ISWs is also the nonlinear steepening of internal tides. In Exp 2 and Exp 3 (Figs. 10b and 10c), in addition to the beams generated by R0, beams radiating from S1 and S2 are detected, resulting in a wavefield exhibiting asymmetric features.
|
Fig. 10 Snapshots of horizontal baroclinic velocities (shadings, unit: m s−1) and the associated isotherms (gray contours) of Exps1 – 4 at 91 h. The characteristic rays of internal waves are denoted by colored lines. The green and violet arrows denote the eastward-propagating and westward-propagating ISWs, respectively. |
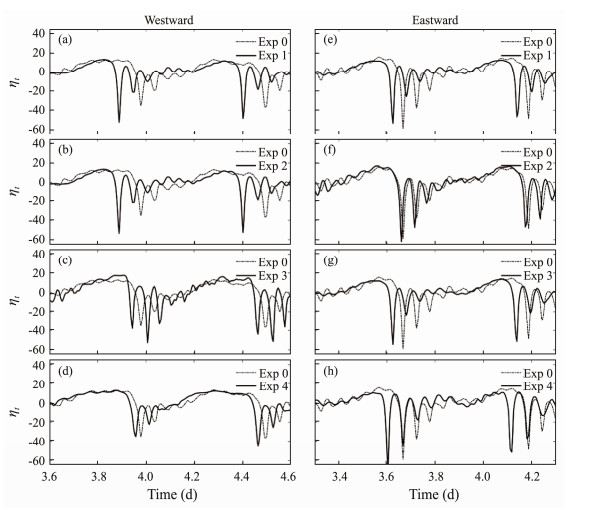
A quantitative comparison of the bidirectional ISWs produced in the sensitivity runs is shown in Fig. 11. First, the bidirectional ISWs in Exp 1 are symmetrical (Figs. 11a and 11e), indicating that the asymmetry of ISWs could be attributed to S1 and S2. The west flank of R0 in Exp 2 is similar to that in Exp 1, which results in the same pattern and different patterns of internal waves in the west and east regions of R0, respectively (Figs. 10a and 10b). Therefore, similar east-flanking waves relative to R0 were observed in Exp 1 and Exp 3 (Figs. 10a and 10c). As the internal wave beams from S1 and S2 reflect off the supercritical slope of R0, they were blocked by ridge R0. Moreover, the westward (eastward) ISWs of Exp 2 (Exp 3) in Fig. 11b (Fig. 11c) are similar to those of Exp 1. Overall, when ebb (flood) tidal currents flowed over R0 in Exp 2 (Exp 3), the upstream dynamic process had a minor effect on the depression waves generated from R0, thereby providing further evidence that ISWs are generated because of the nonlinear steepening of internal tides.
|
Fig. 11 Vertical displacement of the 9.8℃ isotherms for the (a – d) westward and (e – h) eastward ISWs at x = ±300 km. |
In Fig. 11f, the eastward ISWs of Exp 2 are similar to those of the standard run (Exp 0), which indicates that sill S1 has a major effect on the evolution of eastward ISWs. In Fig. 10b, the eastward upward internal wave beams from R0 (denoted by black solid lines), which are reflected twice, are nearly in phase with the internal wave beams from the west flank of S1 (red lines). In that case, the amplitude of the internal wave is enhanced by the modulating effect of those internal waves, resulting in the strengthening of the nonlinear evolution of eastward ISWs.
In Fig. 10c, the modulating effect of internal waves from upward wave beams from R0 and S2 also contributes to the enhancement of westward ISWs (Fig. 11c). However, given the aforementioned effect, the westward rank-ordered ISW packets of the standard run (dash-dotted line in Fig. 11c) are instead weakened. Hence, another sensitivity experiment (Exp 4) is performed, and the topography of the landform has a modified west flank of ridge R0 in contrast to that of Exp 3, which is similar to its realistic topography. In Fig. 11d, the suppression of the evolution of ISWs indicates that the west flank of ridge R0 has a major suppressive effect on the generation of ISWs. Then, the suppressive effect of the west flank of R0 decreases the modulating effect of westward internal waves from R0 and S2. Notably, the slight difference in slope on the west flank of R0 between Exp 1 and Exp 4 results in the difference between eastward internal waves shown in Fig. 11h, indicating that distinct topographic structures should be considered in corresponding research.
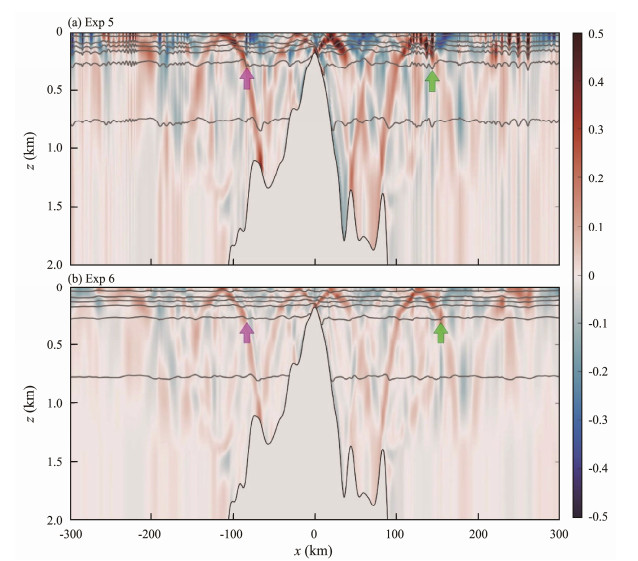
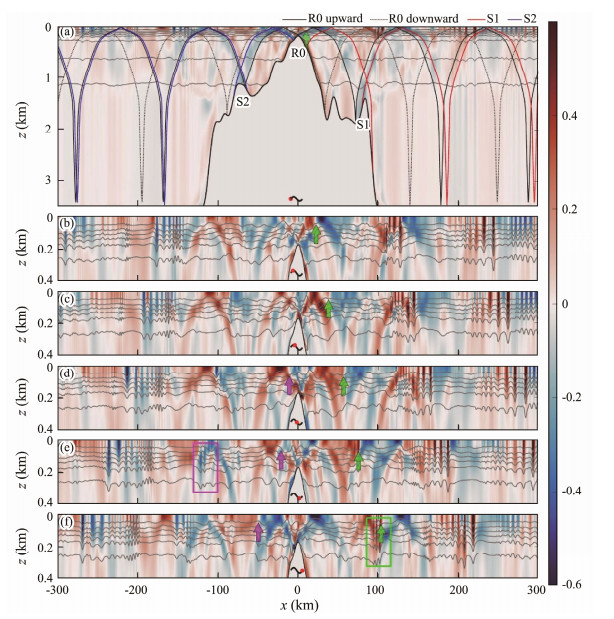
4.2 Tidal ForcingTidal currents vary during the spring and neap tides in the AS, which could affect the generation of ISWs. Therefore, Exp 5 and Exp 6 are performed. During the spring tide, internal tidal beams are enhanced (Fig. 12a). However, during the neap tide, no pronounced ISWs are identified. The topographic Froude numbers for the simulated spring and neap tides are 0.428 and 0.155, respectively, which fall within the same regime as Exp0 according to Regime 5 proposed by Garrett and Kunze (2007). Snapshots of the wavefield generated during a tidal cycle for Exp 5 are shown in Fig. 13. Depression waves evolve into rank-ordered ISW packets, which are also generated from the start of flood or ebb tides. The generation of bidirectional ISWs is also attributed to the nonlinear steepening of internal tides. Meanwhile, the modulating effect of internal waves mentioned in Section 4.1 is enhanced (colored box in Fig. 13). Moreover, more waves are included in the wave packets during the spring tide.
|
Fig. 12 Snapshots of horizontal baroclinic velocities (shadings, unit: m s−1) and isotherms (gray contours) of Exps 4 – 5 at 91 h. |
|
Fig. 13 Snapshots of the spring tidal force in Exp 5, which is similar to that shown in Fig. 6. |
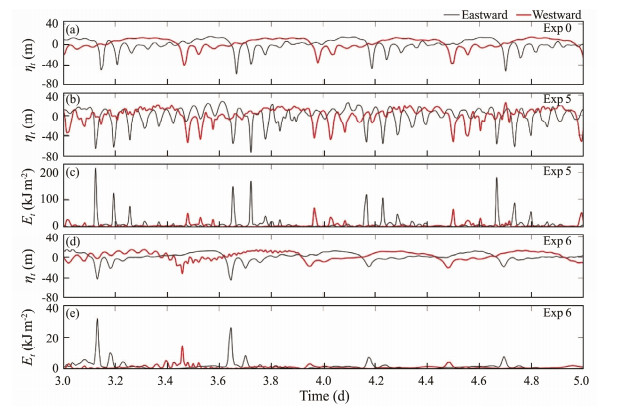
The vertical displacement at z = 500 m and the depth-integrated baroclinic energy gradient are shown in Fig. 14. During the spring tide, the rank-ordered ISW packets are enhanced. The westward-leading ISW is strengthened with an amplitude of 54 m, which is 14 m larger than that induced during the standard run. The amplitude of the eastward-leading ISW (76 m) is slightly larger than that of the standard run (Exp 0), whereas the secondary ISWs of the wave packets are much stronger than those in Exp 0 (Figs. 14a and 14b). Overall, the baroclinic energy of the leading wave is maximized in rank-ordered ISWs, which reaches 215.9 kJ m−2. However, during the neap tide, the amplitudes of both eastward and westward ISWs decrease to 20 m, and the baroclinic energies are 7.2 kJ m−2 and 4.2 kJ m−2, respectively. Moreover, during the neap tide, fewer waves are included in the rank-ordered wave packets.
|
Fig. 14 Vertical displacement of the 9.8℃ isotherms in (a) Exp 0, (b) Exp 5, and (e) Exp 6 and depth-integrated energy for eastward (black lines) and westward (red lines) ISWs in (c) Exp 5 and (e) Exp 6 at x = ± 300 km. |
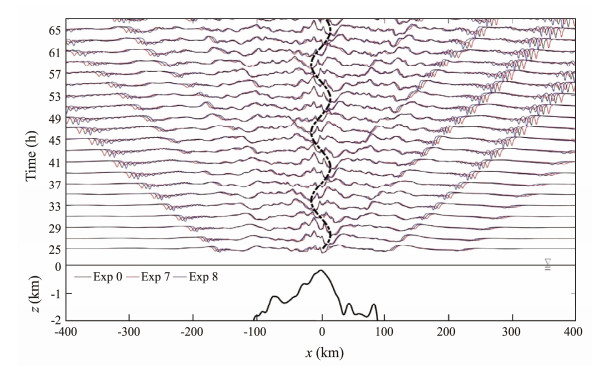
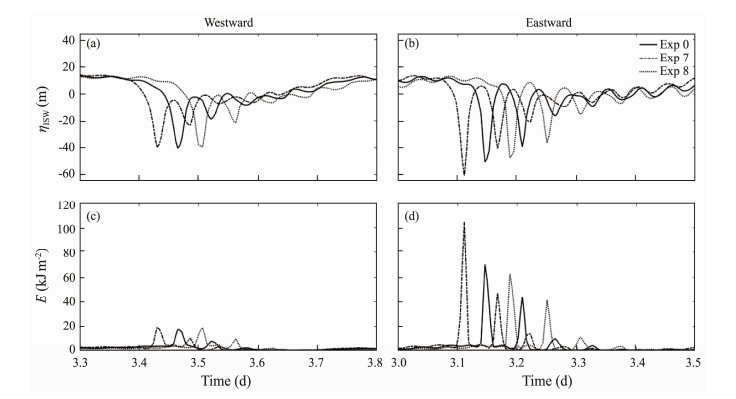
To investigate the influence of seasonal stratification on the generation and evolution of ISWs, Exp 7 and Exp 8 are performed, and the comparisons of the results are shown in Fig. 15. Near the ridge crest, the isothermal displacements are nearly the same for Exp 0, Exp 7, and Exp 8. However, as depression waves evolve, ISWs in Exp 7 are slightly faster than those in Exp 0 and Exp 8, as shown in Fig. 15. The phase speeds of the first-mode internal wave are c1 = 2.57 and 2.43 m s−1 in summer and winter, respectively. In Fig. 16, the slightly strong pycnocline in summer results in a larger amplitude (61 m) and a larger amount of baroclinic energy (104 kJ m−2) than that in winter. How ever, three to four ISWs are detected in eastward rankordered packets in each simulation. By contrast, seasonal stratifications have no effect on the evolution of westward ISWs, which might be due to the suppressive effect of ISWs by the topographic structure. Generally, because of slight differences in the buoyancy frequency, seasonal stratification only has a minor effect on the generation and evolution of ISWs.
|
Fig. 15 Comparison of isotherms at a vertical level of 10 (z = 95 m) between Exp 0, Exp 7, and Exp 8 in the upper frame, where the black, red, and blue lines denote Exp 0, Exp 7, and Exp 8, respectively. The lower subplot is the bathymetry at z = 0 – 2 km. |
|
Fig. 16 (a, b) Vertical displacement of the 9.8℃ isotherms and (c, d) depth-integrated energy for eastward and westward ISWs in Exp 0, Exp 7, and Exp 8 at x = ± 300 km, respectively. |
To investigate the asymmetry of bidirectional ISWs in the AS, the fully nonlinear nonhydrostatic 2D MITgcm was applied. In the standard run, the M2 tidal constituent forcing and realistic topography along the 8.94˚N transect at the Nicobar Archipelago in the AS were configured. A series of sensitivity experiments were performed to explore the influences of topography, tidal flow, and seasonal stratification on the generation and evolution of ISWs, and the main conclusions of this study are listed as follows:
1) Rank-ordered first-mode ISW packets in this region are mainly generated by semidiurnal barotropic tides. With the subcritical tidal flow extracted using OTIS, the generation mechanism of bidirectional ISWs is the nonlinear steepening of internal tides. Moreover, bidirectional ISWs exhibit asymmetric features.
2) Distinct topographic characteristics play an important role in the asymmetry of bidirectional ISWs. The enhanced amplitude of internal wave beams from R0 + S1 and R0 + S2 reinforces the evolution of bidirectional ISWs. However, the topographic features of the west flank of R0 decrease the energy of internal waves, resulting in the suppression of the evolution of westward ISWs. This finding indicates the importance of topographic details in numerical simulations. With a resolution of 1 arcmin in the ETOPO1 global dataset, the simulation of ISWs requires more details of the topographic characteristics.
3) Although the fortnight effect of tides cannot change the generation mechanism of ISWs, it has a modulating effect on the generation and evolution of ISWs. During the spring tide, ISWs are enhanced by a strong tidal flow and the modulating effect of internal wave beams and exhibit rank-ordered wave packets. However, during the neap tide, ISWs become nearly west-east symmetric and exhibit a single wave.
4) The effect of seasonal stratification is negligible because of the small difference between summer and winter in tropical regions. However, the deeper pycnocline in summer makes ISWs propagate faster in summer than in winter and slightly enhances the amplitude and baroclinic energy of eastward rank-ordered ISWs.
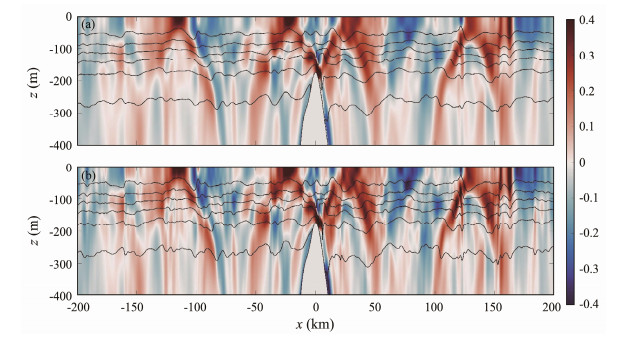
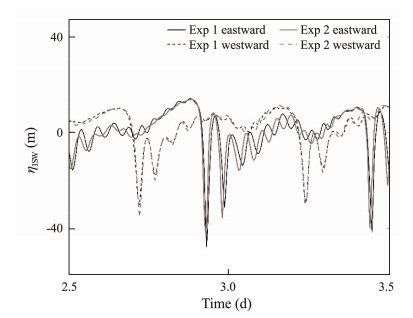
Appendix: Sensitivity of Simulation Results to Model ResolutionAccording to Vitousek and Fringer (2011), the horizontal resolution of the model affects the simulation results of ISW. Here dx/he < 1, indicating that physical dispersion would be dominant as proposed by Xie et al. (2015). Moreover, to further validate these findings, we conducted additional simulations with a small dx (100 m) in the central region. The results are generally consistent with those in Exp1 with dx = 500 m (Figs.A1 and A2), indicating that the choice of horizontal resolution does not influence the analysis of the results, as long as the ratio dx/he meets the aforementioned requirement.
|
Fig. A1 Snapshots of horizontal baroclinic velocities (shadings, unit: m s−1) and isotherms (gray contours) of (a) Exp 1 and (b) Exp 9 at 93 h. |
|
Fig. A2 Vertical displacement of the 9.8℃ isotherms for the westward (dashed lines) and eastward (solid lines) ISWs in Exp 1 (black lines) and Exp 9 (gray lines) at x = ± 300 km. |
This work was supported by the National Natural Science Foundation of China (No. 41876012), the National Basic Research Program of China (973 Program) (No. 2017YFC1405605), and the Fundamental Research Funds for the Central Universities (No. 202061001).
Alford, M. H., Lien, R. C., Simmons, H., Klymak, J., Ramp, S., Yang, Y. J., et al., 2010. Speed and evolution of nonlinear internal waves transiting the South China Sea. Journal of Physical Oceanography, 40(6): 1338-1355. DOI:10.1175/2010JPO4388.1 (  0) 0) |
Alford, M. H., Peacock, T., Mackinnon, J. A., Nash, J. D., Buijsman, M. C., Centuroni, L. R., et al., 2015. The formation and fate of internal waves in the South China Sea. Nature, 521(7550): 65-69. DOI:10.1038/nature14399 (  0) 0) |
Alpers, W., Heng, W. C., and Hock, L., 1997. Observation of internal waves in the Andaman Sea by ERS SAR. IGARSS97 IEEE International Geoscience & Remote Sensing Symposium Remote Sensing – A Scientific Vision for Sustainable Development. IEEE, 4: 1518-1520. (  0) 0) |
Baines, P. G., 1973. The generation of internal tides by flat-bump topography. Deep Sea Research and Oceanographic Abstracts, 20: 179-205. DOI:10.1016/0011-7471(73)90050-8 (  0) 0) |
Bell, T. H., 1975. Lee waves in stratified flows with simple harmonic time dependence. Journal of Fluid Mechanics, 67: 705-722. DOI:10.1017/S0022112075000560 (  0) 0) |
Buijsman, M. C., McWillianms, J. C., and Jackson, C. R., 2010. East-west asymmetry in nonlinear internal waves from Luzon Strait. Journal of Geophysical Research: Oceans, 115: C10057. (  0) 0) |
Cummins, P. F., Armi, L., and Vagle, S., 2006. Upstream internal hydraulic jumps. Journal of Physical Oceanography, 36: 753-769. DOI:10.1175/JPO2894.1 (  0) 0) |
Da Silva, J. C. B., and Magalhaes, J. M., 2016. Internal solitons in the Andaman Sea: A new look at an old problem. SPIE Remote Sensing. Remote Sensing of the Ocean, Sea Ice, Coastal Waters, and Large Water Regions 2016, 9999: 999907.
(  0) 0) |
Dong, J., Zhao, W., Chen, H., Meng, Z., Shi, X., and Tian, J., 2015. Asymmetry of internal waves and its effects on the ecological environment observed in the northern South China Sea. Deep-Sea Research Part Ⅰ, 98: 94-101. DOI:10.1016/j.dsr.2015.01.003 (  0) 0) |
Egbert, G. D., and Erofeeva, S. Y., 2002. Efficient inverse modeling of barotropic ocean tides. Journal of Atmospheric and Oceanic Technology, 19: 183-204. DOI:10.1175/1520-0426(2002)019<0183:EIMOBO>2.0.CO;2 (  0) 0) |
Farmer, D., Li, Q., and Park, J. H., 2009. Internal wave observations in the South China Sea: The role of rotation and non-linearity. Atmosphere-Ocean, 47: 267-280. DOI:10.3137/OC313.2009 (  0) 0) |
Garrett, C., and Kunze, E., 2007. Internal tide generation in the deep ocean. Annual Review of Fluid Mechanics, 39: 57-87. DOI:10.1146/annurev.fluid.39.050905.110227 (  0) 0) |
Gerkema, T., 2001. Internal and interfacial tides: Beam scattering and local generation of solitary waves. Journal of Marine Research, 59: 227-255. DOI:10.1357/002224001762882646 (  0) 0) |
Gill, A. E., 1982. Atmosphere-Ocean Dynamics. Academic Press, London, 645pp.
(  0) 0) |
Guo, C., Chen, X., Vlasenko, V., and Stashchuk, N., 2011. Numerical investigation of internal solitary waves from the Luzon Strait: Generation process, mechanism and three-dimensional effects. Ocean Modelling, 38(3): 203-216. (  0) 0) |
Huang, X., Chen, Z., Zhao, W., Zhang, Z., Zhou, C., Yang, Q., et al., 2016. An extreme internal solitary wave event observed in the northern South China Sea. Scientific Reports, 6: 30041. DOI:10.1038/srep30041 (  0) 0) |
Huang, X., Zhao, W., Tian, J., and Yang, Q., 2014. Mooring observations of internal solitary waves in the deep basin west of Luzon Strait. Acta Oceanologica Sinica, 33: 82-89. (  0) 0) |
Jackson, C. R., 2007. Internal wave detection using the moderate resolution imaging spectroradiometer (MODIS). Journal of Geophysical Research: Oceans, 112: C11012. DOI:10.1029/2007JC004220 (  0) 0) |
Jackson, C. R., da Silva, J. C. B., and Jeans, G., 2012. The generation of nonlinear internal waves. Oceanography, 25: 108-123. DOI:10.5670/oceanog.2012.46 (  0) 0) |
Jensen, T. G., Magalhães, J., Wijesekera, H. W., Buijsman, M., Helber, R., and Richman, J., 2020. Numerical modelling of tidally generated internal wave radiation from the Andaman Sea into the Bay of Bengal. Deep-Sea Research Part Ⅱ, 172: 104710. DOI:10.1016/j.dsr2.2019.104710 (  0) 0) |
Jones, N. L., Ivey, G. N., Rayson, M. D., and Kelly, S. M., 2020. Mixing driven by breaking nonlinear internal waves. Geophysical Research Letters, 47: 19. (  0) 0) |
Lamb, K. G., 2014. Internal wave breaking and dissipation mechanisms on the continental slope shelf. Annual Review of Fluid Mechanics, 46: 231-254. DOI:10.1146/annurev-fluid-011212-140701 (  0) 0) |
Lee, C. Y., and Beardsley, R. C., 1974. The generation of long nonlinear internal waves in a weakly stratified shear flow. Journal of Geophysical Research Atmospheres, 79: 453-462. DOI:10.1029/JC079i003p00453 (  0) 0) |
Legg, S., and Huijts, K. M. H., 2006. Preliminary simulations of internal waves and mixing generated by finite amplitude tidal flow over isolated topography. Deep-Sea Research Part Ⅱ, 53: 140-156. DOI:10.1016/j.dsr2.2005.09.014 (  0) 0) |
Legg, S., and Klymak, J., 2008. Internal hydraulic jumps and overturning generated by tidal flow over a tall steep ridge. Journal of Physical Oceanography, 38: 1949-1964. DOI:10.1175/2008JPO3777.1 (  0) 0) |
Li, Q., 2014. Numerical assessment of factors affecting nonlinear internal waves in the South China Sea. Progress in Oceanography, 121: 24-43. DOI:10.1016/j.pocean.2013.03.006 (  0) 0) |
Li, Q., and Farmer, D. M., 2011. The generation and evolution of nonlinear internal waves in the deep basin of the South China Sea. Journal of Physical Oceanography, 41: 1345-1363. DOI:10.1175/2011JPO4587.1 (  0) 0) |
Lien, R. C., D'Asaro, E., Henyey, F., Chang, M. H., Tang, T. Y., and Yang, Y. J., 2012. Trapped core formation within a shoaling nonlinear internal wave. Journal of Physical Oceanography, 42: 511-525. DOI:10.1175/2011JPO4578.1 (  0) 0) |
Lien, R. C., Henyey, F., Ma, B., and Yang, Y. J., 2014. Large-amplitude internal solitary waves observed in the northern South China Sea: Properties and energetics. Journal of Physical Oceanography, 44: 1095-1115. DOI:10.1175/JPO-D-13-088.1 (  0) 0) |
Magalhaes, J. M., and da Silva, J. C. B., 2018. Internal solitary waves in the Andaman Sea: New insights from SAR imagery. Remote Sensing, 10: 861. DOI:10.3390/rs10060861 (  0) 0) |
Magalhaes, J. M., da Silva, J. C. B., and Buijsman, M. C., 2020. Long lived second mode internal solitary waves in the Andaman Sea. Scientific Reports, 10: 10234. DOI:10.1038/s41598-020-66335-9 (  0) 0) |
Marshall, J., Adcroft, A., Hill, C., Perelman, L., and Heisey, C., 1997. A finite volume, incompressible Navier-Stokes model for studies of the ocean on parallel computers. Journal of Geophysical Research: Oceans, 102: 5753-5766. DOI:10.1029/96JC02775 (  0) 0) |
Maxworthy, T., 1979. A note on the internal solitary waves produced by tidal flow over a three-dimensional ridge. Journal of Geophysical Research: Oceans, 84: 338-346. DOI:10.1029/JC084iC01p00338 (  0) 0) |
Min, W., Li, Q., Zhang, P., Xu, Z., and Yin, B., 2019. Generation and evolution of internal solitary waves in the southern Taiwan Strait. Geophysical and Astrophysical Fluid Dynamics, 113: 287-302. DOI:10.1080/03091929.2019.1590568 (  0) 0) |
Mohanty, S., Rao, A. D., and Latha, G., 2018. Energetics of semidiurnal internal tides in the Andaman Sea. Journal of Geophysical Research: Oceans, 123: 6224-6240. DOI:10.1029/2018JC013852 (  0) 0) |
Moum, J. N., Klymak, J. M., Nash, J. D., Perlin, A., and Smyth, W. D., 2007. Energy transport by nonlinear internal waves. Journal of Physical Oceanography, 37: 1968-88. DOI:10.1175/JPO3094.1 (  0) 0) |
Nakamura, T., Awaji, T., Hatayama, T., Akitomo, K., Takizawa, T., Kono, T., et al., 2000. The generation of large-amplitude unsteady lee waves by subinertial K1 tidal flow: A possible vertical mixing mechanism in the Kuril Straits. Journal of Physical Oceanography, 30: 1601-1621. DOI:10.1175/1520-0485(2000)030<1601:TGOLAU>2.0.CO;2 (  0) 0) |
Osborne, A. R., and Burch, T. L., 1980. Internal solitons in the Andaman Sea. Science, 208: 451-460. DOI:10.1126/science.208.4443.451 (  0) 0) |
Pacanowski, I., and Philander, S., 1981. Parameterization of vertical mixing in numerical models of tropical oceans. Journal of Physical Oceanography, 11(11): 1443-1451. DOI:10.1175/1520-0485(1981)011<1443:POVMIN>2.0.CO;2 (  0) 0) |
Perry, R. B., and Schimke, G. R., 1965. Large-amplitude internal waves observed off the northwest coast of Sumatra. Journal of Geophysical Research: Atmospheres, 70(10): 2319-2324. DOI:10.1029/JZ070i010p02319 (  0) 0) |
Pickering, A., and Alford, M. H., 2012. Velocity structure of internal tide beams emanating from Kaena Ridge, Hawaii. Journal of Physical Oceanography, 42(6): 1039-1044. DOI:10.1175/JPO-D-12-018.1 (  0) 0) |
Raju, N. J., Dash, M. K., Bhaskaran, P. K., and Pandey, P. C., 2021. Numerical Investigation of bidirectional mode-1 and mode-2 internal solitary wave generation from north and south of Batti Malv Island, Nicobar Islands, India. Journal of Physical Oceanography, 51: 47-62. DOI:10.1175/JPO-D-19-0182.1 (  0) 0) |
Raju, N. J., Dash, M. K., Dey, S. P., and Bhaskaran, P. K., 2019. Potential generation sites of internal solitary waves and their propagation characteristics in the Andaman Sea – A study based on MODIS true-colour and SAR observations. Environmental Monitoring and Assessment, 191: 809. DOI:10.1007/s10661-019-7705-8 (  0) 0) |
Sutherland, B. R., Barrett, K. J., and Ivey, G. N., 2013. Shoaling internal solitary waves. Journal of Geophysical Research: Oceans, 118: 4111-4124. DOI:10.1002/jgrc.20291 (  0) 0) |
Vitousek, S., and Fringer, O. B., 2011. Physical vs. numerical dispersion in nonhydrostatic ocean modelling.. Ocean Modelling, 40(1): 72-86. DOI:10.1016/j.ocemod.2011.07.002 (  0) 0) |
Vlasenko, V., and Stashchuk, N., 2007. Three-dimensional shoaling of large-amplitude internal waves. Journal of Geophysical Research: Oceans, 112: C11018. DOI:10.1029/2007JC004107 (  0) 0) |
Vlasenko, V., Guo, C., and Stashchuk, N., 2012. On the mechanism of A-type and B-type internal solitary wave generation in the northern South China Sea. Deep-Sea Research Part I, 69: 100-112. DOI:10.1016/j.dsr.2012.07.004 (  0) 0) |
Vlasenko, V., Stashchuk, N., and Hutter, K., 2002. Water exchange in fjords induced by tidally generated internal lee waves. Dynamics of Atmospheres and Oceans, 35: 63-89. DOI:10.1016/S0377-0265(01)00085-9 (  0) 0) |
Vlasenko, V., Stashchuk, N., and Hutter, K., 2005. Baroclinic Tides: Theoretical Modeling and Observational Evidence. Cambridge University Press, New York, 351pp.
(  0) 0) |
Vlasenko, V., Stashchuk, N., and Nimmo-Smith, W. A. M., 2018. Three-dimensional dynamics of baroclinic tides over a seamount. Journal of Geophysical Research: Oceans, 123: 1263-1285. DOI:10.1002/2017JC013287 (  0) 0) |
Vlasenko, V., Stashchuk, N., Guo, C., and Chen, X., 2010. Multimodal structure of baroclinic tides in the South China Sea. Nonlinear Processes in Geophysics, 17: 529-543. DOI:10.5194/npg-17-529-2010 (  0) 0) |
Wang, S., Meng, J., Li, Q., and Chen, X., 2020. Evolution of internal solitary waves on the slope-shelf topography in the northern South China Sea. Ocean Dynamics, 70: 729-743. (  0) 0) |
Xie, J., He, Y., Chen, Z., Xu, J., and Cai, S., 2015. Simulations of internal solitary wave interactions with mesoscale eddies in the northeastern South China Sea. Journal of Physical Oceanography, (12): 150923131654000. (  0) 0) |
Xu, Z., Yin, B., Yang, H., and Qi, J., 2012. Depression and elevation internal solitary waves in a two-layer fluid and their forces on cylindrical piles. Chinese Journal of Oceanology & Limnology, 30: 703-712. (  0) 0) |
 2023, Vol. 22


