2) Frontier Science Center for Deep Ocean Multispheres and Earth System (FDOMES) and Physical Oceanography Laboratory, Ocean University of China, Qingdao 266100, China;
3) Laoshan Laboratory, Qingdao 266237, China
In the western Arctic, Pacific Waters (PW) enter the Chukchi Sea via the Bering Strait at an annual mean rate of 1 Sverdrup (Sv; 1 Sv = 106 m3 s−1; Woodgate, 2018). The inflow of PW was enhanced largely due to the increase in the far-field Pacific-Arctic 'pressure-head' force from 1990 onward (Woodgate and Peralta-Ferriz, 2021). Seasonally, the surface current dominates the summer Bering Strait throughflow, which includes relatively warm and fresh Alaska Coastal Water (ACW) and the cooler and saltier summer Bering Sea Water (sBSW, von Appen and Pickart, 2012). The ACW mainly flows via the Alaska Coastal Current. In Barrow Canyon, a portion of the ACW outflow feeds the eastward-flowing current to the Beaufort Sea, known as the Beaufort Shelfbreak Jet (Weingartner et al., 1998, 2005; Pickart et al., 2009), and the sBSW is advected poleward through the central pathway between Herald and Hanna Shoals (Woodgate et al., 2005). These two types of Pacific Summer Waters can significantly impact the marine environment of the Arctic region via substantial heat and freshwater input (Yang, 2006; Pickart et al., 2013). The ACW may experience more rapid heat loss than sBSW because it overlies sBSW and contains more heat (Steele et al., 2004). The spatial correlations between newly open water areas and regions of temperature increase of warm halocline indicate that ACW may play an important role in the loss of Arctic sea ice (Stroeve and Notz, 2018). From previous studies, the anomalously warm ACW intrusion into the Canada Basin via anticyclonic eddies can cause upward heat flux of O(1 – 10) W m−2, which melts the bottom of sea ice at a rate of 4 mm d−1 (Kawaguchi et al., 2012; Fine et al., 2018, 2022; Lin et al., 2021). Under various conditions of North Pacific wind fields, the temperature and salinity properties of ACW inflow also change, demonstrating the annual difference of the ACW heat and freshwater contents in the Arctic Ocean in general (Zhang et al., 2020).
The transport through Barrow Canyon accounts for roughly 94% of the ACW during July – September (Itoh et al., 2013). However, the export of ACW in this region is liable to flow directly northward to the Canada Basin under the circumstances of increased and strengthened easterly winds (Okkonen et al., 2009; Brugler et al., 2014). Synchronously, insolation warms the surface water through newly ice-free areas in the Chukchi Sea during the melting season (Timmermans et al., 2018). Subsequently, these warmed waters are mostly subducted in the northern Chukchi Sea to the Central Canada Basin, along the isopycnals that outcrop on the surface to feed the ACW (Timmermans et al., 2014). Steel et al. (2004) argued that the ACW and sBSW in the Canadian Basin may be geographically separated under the regime of the positive Arctic Oscillation (AO) index. Other studies suggested that the transport of the ACW and sBSW has no significant correlation with the AO index (Wang et al., 2009). In recent years, with reinforced easterly winds along the coast of Alaska, more ACW flow has progressed to a northerly path via northward Ekman transport and has been injected into the Arctic Ocean with sBSW (Watanabe, 2011; Brugler et al., 2014). Less coverage of sea ice, in combination with anomalous anticyclonic wind fields on the basin scale, provides an opportunity to alter the Beaufort Gyre intensively and extensively (Rampal et al., 2009; Yang, 2009). Thus, ACW and sBSW may not be geographically separated but can coexist widely in the entire basin.
The dramatic sea ice decline in the Pacific sector of the Arctic over the last few decades may be the consequence of the increased inflow and heat flux of the ACW (Itoh et al., 2015). Nevertheless, freshwater is accumulating at an average rate of (397 ± 116) km3 yr−1 in the Beaufort Gyre region (Proshutinsky et al., 2019), which indicates the enhanced stratification in the western Arctic surface layers and damped disturbances in external forcing (Bertosio et al., 2022). Without forceful eddies or mixing, ACW experiences difficulty in producing sufficient upward vertical heat flux to impact sea ice due to the restriction of haloclines in addition to over-thin mixed layers (< 12 m) despite the considerable heat content carried by the ACW (Fer, 2009; Jackson et al., 2010; Toole et al., 2010; Lincoln et al., 2016). Downstream at the continental slope north of Alert, Ellesmere Island, ACW still appears despite the substantial loss of its heat content by that point (Newton and Sotirin, 1997); the ACW overcomes these barriers to release heat in certain conditions during flow. Since 2012, the freshwater content in the Makarov Basin has increased as a result of enormous freshwater northward intrusion out of the Beaufort Gyre, which thickened the halocline layer and strengthened stratification in the upper water column within this region (Bertosio et al., 2022). This hydrographic condition may create an opportunity for ACW to proceed farther downstream areas as the ACW heat loss responds to the strength of upper ocean stratification. Therefore, comprehending the mechanism and reasons for the changes in the ACW is the key to revealing the relationship between warming ACW and sea ice reduction in the western Arctic.
This study used the in-water temperature and salinity data sampled by ice-borne Drift-Towing Ocean Profilers (DTOP) over the Alpha Ridge during the 9th and 11th Chinese National Arctic Research Expedition to investigate the revolution of ACW north of Canada Basin and its connection to oceanic heat flux. In Section 2, we describe the overall data set applied in this study and the calculation of relevant physical quantities. Section 3 presents the hydrography results from the DTOP records, estimates of heat flux, and analysis of the Ekman upwelling related to the ACW heat release. Section 4 summarizes our results and discussion.
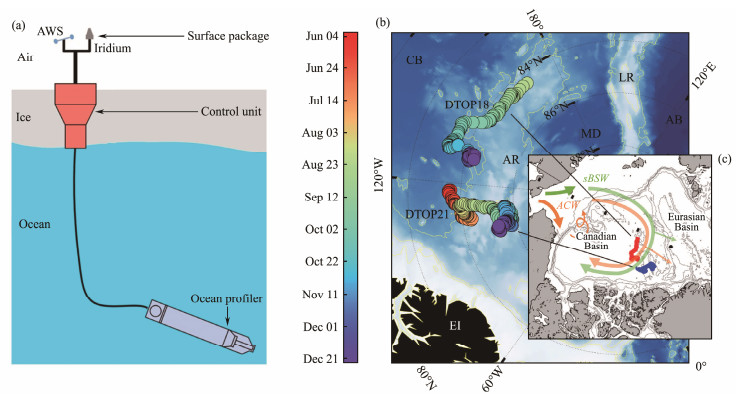
2 Data and Methods 2.1 DTOP Buoy DataThe temperature and salinity profiles from the DTOP buoys, which were designed by the Ocean University of China and manufactured by Tianjin Yuanxun Technology Co., Ltd., were analyzed here. Meteorologic sensors on the DTOP measured hourly the near-surface air temperature, humidity, and pressure using a module of the Global Positioning System recording the real-time coordinates of buoy sites. The underwater CTD profiling instrument sampled the temperature and salinity of the underlying ice-covered ocean on a 12 h basis with a weightless cable of 120 m in length (Fig. 1a). The long-term hydrographic properties beneath the ice bottom to the depth of nearly 120 m captured by DTOP can be analyzed to study the interactive processes between sea ice and ocean. The sampled data were transmitted to the domestic surficial receiving station through the iridium system in real time. Buoy DTOP18 collected profiles from August 22, 2018, to December 12, 2018, before it stopped transmitting data, and the data from DTOP21 over the period of June 1, 2021 – December 24, 2021, were also used. Both buoys were deployed over the Alpha Ridge north of the Canada Basin, with DTOP21 located farther east, closer to Ellesmere Island (Figs. 1b and 1c). In this study, the traditional potential temperature and practical salinity were utilized as the basis for the discrimination of water masses and the calculation of relevant physical quantities.
|
Fig. 1 (a) Schematic of the Drift-Towing Ocean Profilers (DTOP). (b) Drift trajectories of DTOP18/21 (circles in colors). Background showing bathymetry in meters. Yellow isolines are 500, 1000, and 2500 m. CB, Canada Basin; AR, Alpha Ridge; MB, Makarov Basin; LR, Lomonosov Ridge; AB, Amundsen Basin; and EI, Ellesmere Island are indicated. (c) Zoomed-out study area where the DTOP18 (red) and DTOP21 (blue) drifted in the Arctic Ocean and schematic circulation of the ACW (orange) and sBSW (green). The Canadian Basin includes the Canada Basin and the Makarov Basin. |
Data inverted by microwave brightness temperature from the successor of Advanced Microwave Scanning Radiometer for Earth Observing System on the satellite 'Shizuku' (GCOM-W1), which was developed by Japan Aerospace Exploration Agency, were used to estimate daily-average sea ice concentration Csi on a 6.25 km grid (Melsheimer and Spreen, 2019). Monthly mean sea ice drift data calculated based on combinations of multiple satellite sensors and gridded onto a Lambert azimuthal equal area grid with 25-km grid resolution were obtained from National Snow and Ice Data Center (NSIDC, Tschudi et al., 2019). The objectively analyzed data set of temperature and salinity with a spatial resolution of 0.25˚ × 0.25˚ and 5 m in lateral and vertical, respectively, from World Ocean Atlas 2018's (WOA18) 13-year monthly mean (2005 – 2017) climatology was adopted here to compare with our DTOP results (Locarnini et al., 2018). The hourly wind speed at 10 m, downward shortwave radiation under clear skies, and cloud friction obtained from the 5th generation European Centre for Medium-Range Weather Forecasts reanalysis (ERA5) were analyzed to study the relations between atmospheric conditions and oceanic variation (Hersbach et al., 2018).
2.3 Methods of CalculationFrom observations of heat flux and Reynolds stress during the Marginal Ice Zone Experiment, based on the turbulence theory, McPhee (1992) suggested a simple bulk parameterization of oceanic heat flux:
| $ F_w^{{\text{OHF}}} = {\rho _{sw}}{c_p}{C_H}{u_*}\delta T, $ | (1) |
where ρsw is the sea water density, and cp is the specific heat of sea water (3.98 × 10³ J kg−1), CH is a bulk heat transfer coefficient (5.7 × 10⁻⁴ ± 4 × 10⁻⁴; McPhee, 2002); u* is the interface friction velocity as described in Eq. (2); δT = Tml − Tf (Sml) represents the surface mixed layer (SML) temperature elevation above freezing Tf, where Tml and Sml are the temperature and salinity of SML, respectively. u* is described using the Rossby similarity theory (McPhee et al., 1999):
| $ \frac{{\kappa V}}{{{u_*}}} = \log \frac{{{u_*}}}{{f{z_0}}} - A - iB, $ | (2) |
where κ is von Karman's constant (0.4); V is the ice velocity relative to the surface geostrophic flow. Here, V can approximate the sea ice drift velocity calculated by the coordinate data derived from DTOP, given that it considerably outweighs the surface geostrophic flow velocity. f is the Coriolis parameter, z0 is the hydraulic roughness length of the underside of the ice (0.1 m); A and B are similarity constants with values of 2.21 and 1.91, respectively.
The net incident solar radiation SWn that enters the upper ocean through leads or open water is calculated using the following equation (Stanton et al., 2012):
| $ S{W_n} = S{W_d}(1 - 0.25{c^3})(1 - {\alpha _w})(1 - {C_{si}}), $ | (3) |
where SWd is the downward shortwave radiation top of the atmosphere under clear skies; c is the cloud fraction, αw is the albedo of open water and leads (0.07); Csi is the sea ice concentration. Here, the local Csi (0 ≤ Csi ≤ 1) at the buoy sites was estimated by averaging the concentration value from grid points found within circles with 50 km radii.
The Ekman pumping vertical velocity we relevant to the curl of wind stress is defined as follows (Polyakov et al., 2013):
| $ {w_e} = \frac{1}{{{\rho _{sw}}}}(\nabla \times \frac{{\vec \tau }}{f}), $ | (4) |
where the wind stress
| $ \vec \tau = {\rho _\alpha }{C_d}|{\vec u_s}|{\vec u_s}, $ | (5) |
| $ {C_d} = (1.5 + 2.233{C_{si}} - 2.333C_{si}^2){10^{ - 3}}, $ | (6) |
where ρα is the air density (1.25 kg m−3);
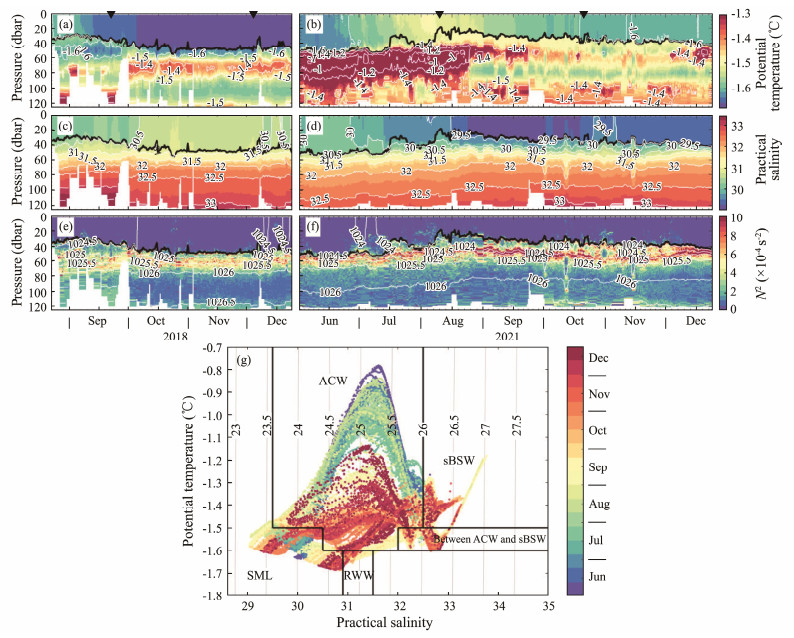
Normally, the freezing season of sea ice in the central Arctic ends during June and early July (Lei et al., 2018). The SML depth (MLD) exceeded 50 m due to the brine-driven convection mixing at this time with a salinity greater than 30.0 (Fig. 2). SML was generally heated to above −1.5℃ in July and August, affected by solar radiation and freshened by the meltwater out of sea ice base. The shoaling of MLD occurred significantly during mid-summer, with a minimum of approximately 20 m in August (Fig. 2b). SML became cooler and denser in September. After October, the SML temperature dropped to between −1.72℃ and −1.62℃, and MLD was deeper than 40 m. In September 2018, a subtle near-surface temperature maximum (NSTM) ranged from −1.58℃ to −1.55℃ at the MLD of approximately 30 – 40 m (Figs. 2a and 3a). Its formation was associated with the summer solar radiation that entered the upper ocean, where the water column was cooled down and freshened by the melting of sea ice, which resulted in a temperature maximum at an intermediate depth (Jackson et al., 2010; Steele et al., 2011). With the dramatic decline of sea ice extent in recent years, NSTM in the Canada Basin has appeared farther north and survived winters (Zhao and Cao, 2011). Beneath NSTM, remnant winter water (RWW) with a temperature below −1.6℃ and salinity ranging from 31.0 to 31.5 can be found; this water was the residual of the previous winter's mixed layer (Jackson et al., 2011; Steele et al., 2011; Figs. 2a, 2c, 2g, and 3a). The layer of RWW became thinner after October 2018 but remained below the SML (Fig. 3b). However, the RWW was barely visible over the same season in 2021. Therefore, the water with a temperature of nearly −1.5℃, which was warmed by summer solar radiation, was directly maintained at the upper part of ACW instead of in the shape of temperature maximum during October – December 2021 (Figs. 2b and 3d).
|
Fig. 2 Hydrographic properties of the upper ocean layer over the Alpha Ridge in 2018 and 2021. (a, b), potential temperature; (c, d), practical salinity; and (e, f), squared Brunt-Väisälä frequency N2. White segments indicate missing data; thick black line represents the surface MLD; thin white lines denote the temperature, salinity, and density isolines; inverted triangles mark the sites of typical profiles shown in Fig. 3. (g), potential temperature-practical salinity diagram from DTOP18/21 drifts. |

|
Fig. 3 Typical hydrographic profiles at sites marked in Fig. 2 with inverted triangles. |
During summertime (June – August) in 2021, within the region of around 83.5˚ – 84.5˚N, 110˚ – 120˚W, the thick layer of ACW was significantly present between 50 and 90 m, with temperature and salinity generally ranging from −1.35℃ to −0.9℃ and from 30.2 to 32.5, respectively, and the temperature maximum
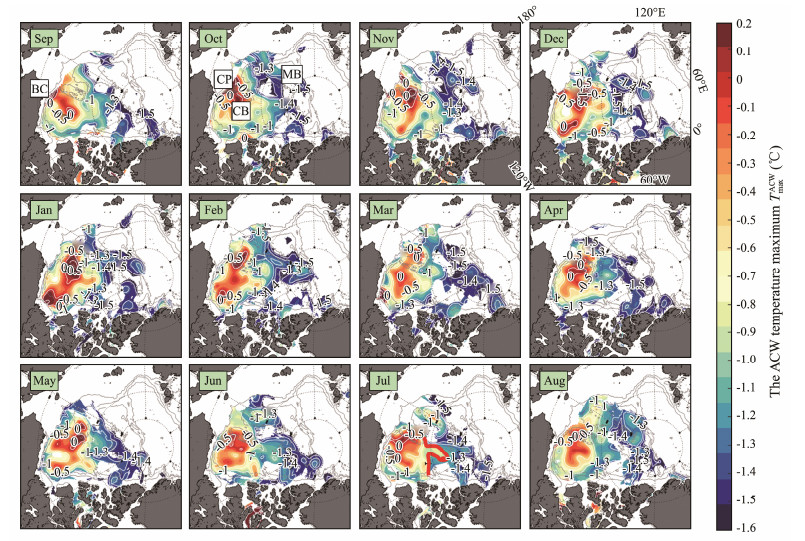
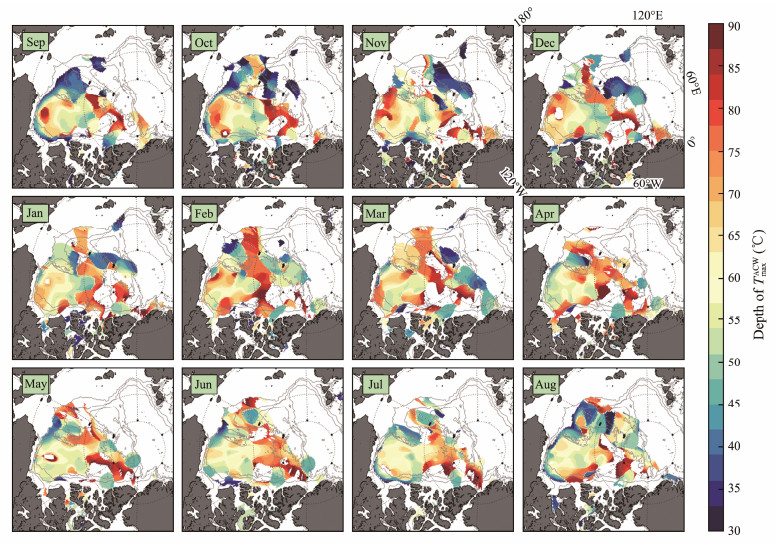
Figs. 4 and 5 show the lateral extent of ACW within the WOA18's 13-year monthly mean (2005 – 2017) climatology. The ACW with the highest temperature maximum was mainly distributed in the Chukchi Plateau and Beaufort Sea. North of Barrow Canyon, the ACW, with a temperature maximum exceeding 1.0℃, started to intrude into the Central Canada Basin from shelfbreak in September. The origin of this ACW intrusion shifted westward slightly to the Chukchi Plateau in October, and the extent of ACW with a temperature maximum exceeding −1.0℃ in the basin continued to expand. The climatological average
|
Fig. 4 Lateral extent of the ACW temperature maximum |
|
Fig. 5 Same as Fig. 4 but with the depth of |
The ACW temperature maximum outside the main region of Beaufort Gyre fluctuated between −1.5℃ and −1.2℃ throughout the year.
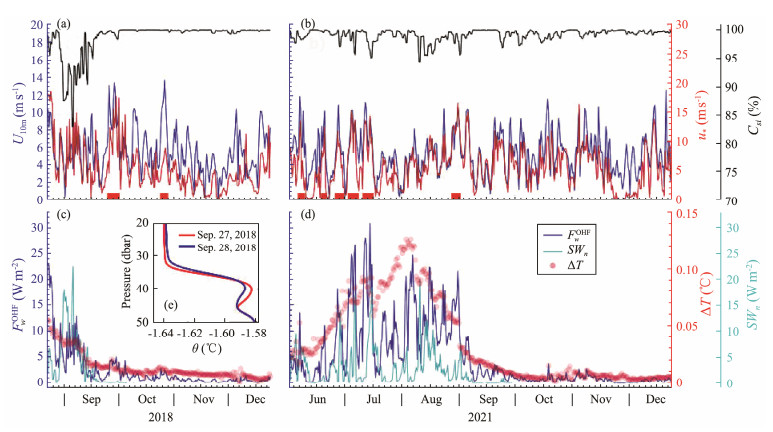
The
|
Fig. 6 Seasonal evolution of the oceanic heat flux |
The net shortwave radiation flux decreased to near zero, with ∆T lower than 0.02℃ since September. A major storm with the highest wind speed over 14 m s−1 was recorded in late September 2018, and the NSTM was observed at the bottom of SML (Fig. 6a). The NSTM is normally trapped by a strong seasonal halocline. The heat stored in the NSTM was hardly released upward to the ice-ocean interface until the halocline structure was eroded by convection mixing through brine rejection during the freezing season or by turbulent mixing through abrupt storm events (Jackson et al., 2012). In late September 2018, the NSTM slightly descended, and the mixed layer temperature increased within 1 d.
Given the above results, the
With the high sea ice concentration in summer (> 90%), the
| $ F_w^{{\text{ACW}}} = \frac{\partial }{{\partial t}}({\rho _{sw}}{c_p}T{\text{d}}z) = {\rho _{sw}}{c_p}k\frac{{\partial T}}{{\partial z}}, $ | (7) |
where k and ∂T/∂z are the vertical diffusivity and ACW temperature gradient, respectively. Macdonald et al. (1993) estimated the bulk diffusivity in the Canada Basin halocline (4 × 10⁻⁵ m2 s−1). Referring to the research of Steele et al. (2004), ∂T/∂z is calculated as the average temperature gradient between the depths of
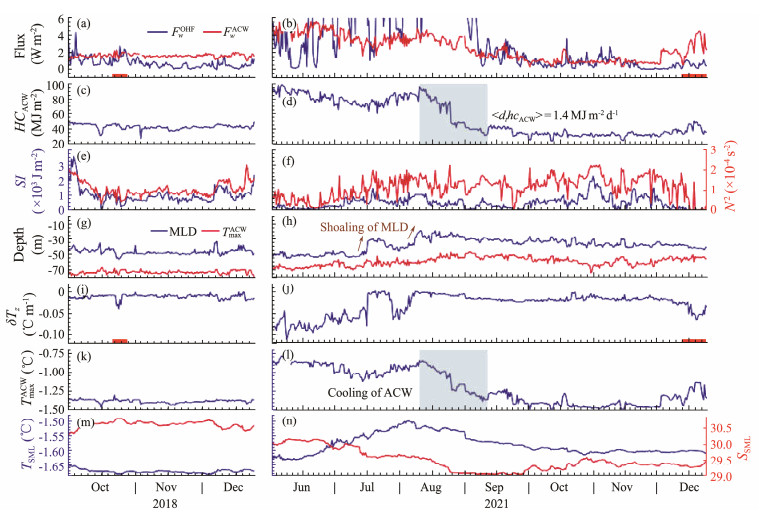
The ACW regularly released diapycnal heat flux of approximately 3 – 4 W m−2 during summer, and
| $ SI = - \int_{ - h}^0 {\left\{ {\rho (z) - \left\langle \rho \right\rangle } \right\}} gz{\text{d}}z, $ | (8) |
| $ \left\langle \rho \right\rangle = \frac{1}{h}\int_{ - h}^{\text{0}} {\rho (z){\text{d}}z}, $ | (9) |
|
Fig. 7 Comparison of the under-ice |
where 〈ρ〉 is the average density of vertical integration, and h is the depth, which was set to the depth of
The distance between the mixed layer base and the depth of
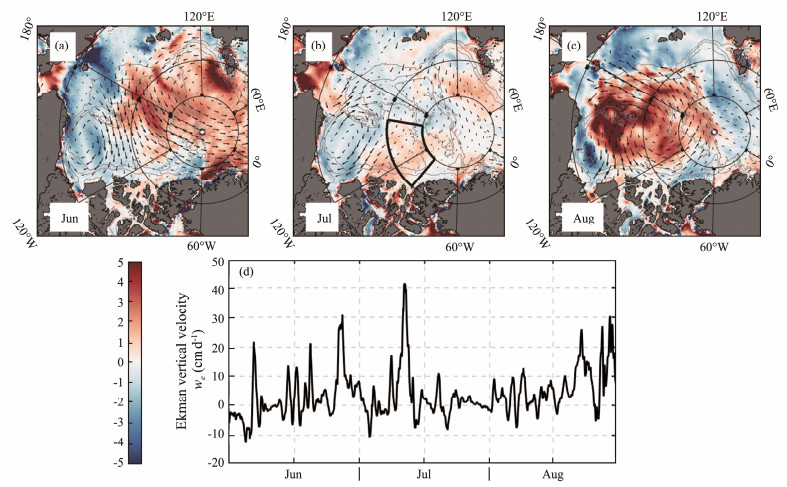
Upwelling and entrainment during storm events are considered to be vital physical mechanisms for the heat loss out of the ACW (Yang et al., 2001). In our study, powerful Ekman suction spread widely all over the Arctic Ocean except for the Beaufort Gyre region in June 2021 (Fig. 8a). More ACW can be swept into the Transpolar Drift with the expansion of Beaufort Gyre in years of the negative AO index (−1.80 in winter 2020/2021). In the flowing process with the Transpolar Drift, the heat stored in the ACW was consumed continuously by vertical heat flux during the upwelling. In July 2021, the vertical Ekman velocity we decreased in the Arctic Ocean, apart from the region north of the Canada Basin (80˚ – 85˚N, 100˚ – 160˚W, Fig. 8b). The daily time series showed that in early July, we in this area peaked at over 40 cm d−1 (Fig. 8d). Polyakov et al. (2013) noted that episodic atmospheric events, such as cyclones, can distort isopycnal surfaces substantially. This finding explains the abruptly thinned SML from 50 m to 30 m in mid-July (Figs. 2 and 7). The slight weakening of Ekman suction between July and August alleviated the upward heat loss out of the ACW, with the renewal of heat content of more than 80 MJ m−2 (Fig. 7d). The intensified Ekman suction in August was widespread and covered almost the entire Canadian Basin (Fig. 8c). Since mid-August, we in the calculated area escalated again and stabilized at (9.4 ± 8.0) cm d−1 in general (Fig. 8d), which caused a remarkable decline in the ACW temperature maximum and heat content at a mean rate of 1.4 MJ m−2 d−1 (Figs. 7d and 7i, respectively). Furthermore, the mixed layer correspondingly thinned again from about 40 m to 20 m under the action of cyclonic Beaufort Gyre, which can reshape isopycnal surfaces into an inverted bowl-shaped convex structure, as mentioned above.
|
Fig. 8 Lateral extent in the Arctic Ocean of monthly mean Ekman vertical velocity we (color shading) and sea ice drift velocity (black arrows) from NSIDC data during June (a), July (b), and August (c) in 2021. (d), Time series of average Ekman vertical velocity we in the region north of the Canada Basin (80˚ – 85˚N, 100˚ – 160˚W, the thick black box shown in (b)). |
The Ekman suction (or cyclonic Beaufort Gyre) can also produce northward Ekman transport in the Northern Canada Basin, which facilitates the release of freshwater that was previously converged in the basin (Giles et al., 2012). For instance, the reduced salinity observed in the upper ocean of the Eurasian Basin in 2010 was believed to be caused by the injection of freshwater as a result of a weakened Beaufort Gyre (Timmermans et al., 2011). As shown in Fig. 7n, with the emergence of the substantially strong Ekman suction, the SML salinity decreased by 0.5 twice in July and August, and it stabilized at approximately 29.0 by October. Notably, the freshening of SML could have partly resulted from the freshwater out of the melting sea ice, given the signs of SML temperature decrease were also observed from August.
4 ConclusionsThis study analyzed the temperature and salinity data from the DTOPs deployed over the Alpha Ridge north of the Canada Basin during 2018 and 2021. The data were used to investigate the variabilities of the ACW and the under-ice
The ACW was observed substantially during the period when DTOP18 and DTOP21 drifted in the Arctic Ocean. The temperature maximum of the ACW was generally lower than −1.5℃ in August – September 2018, which was consistent with the climatologic feature of the ACW north of 80˚N. During the summer (June – August) of 2021, the temperature of the 40 m-thick ACW layer generally ranged from −1.35℃ to −0.9℃, with
The under-ice
North of the Beaufort Gyre region in the Arctic Ocean, Ekman suction (upwelling) became pervasive under the influence of wide cyclonic wind fields. Intensive upwelling dominated north of the Canada Basin during summer, with the maximum Ekman vertical velocity exceeding 40 cm d−1, which caused the thinning of the ACW layer and the decline in the ACW temperature due to the upward heat release process on its pathway of transport. This finding is consistent with the climatologic pattern of the cooling of the ACW in this region. North of the Canada Basin, the enhanced Ekman suction distorted the isopycnal surfaces and released the freshwater content that was previously converged in the basin with the northerly Ekman transport. This condition caused the thinning and freshening of SML, as observed in the summer of 2021. Similar to the studies on double-diffusive heat fluxes out of the ACW with calculated turbulent dissipation rates south of the Beaufort Gyre (Kawaguchi et al., 2012; Fine et al., 2018, 2022), further research is required to quantify more precisely
We thank Drs. Xiaoyu Wang and Yilin Liu for their contribution to the DTOP platform preparation and deployment, as well as the crew of the R/V Xuelong for their help. We also thank Linxu Zhai and Xinyun Liu for their valuable comments on the manuscript. This work was supported by the National Natural Science Foundation of China (Nos. 42276239 and 41941012), the National Key R & D Program of China (No. 2019YFC1509101), and the Fundamental Research Funds for the Central Universities (No. 202165005).
Andreas, E. L., Horst, T. W., Grachev, A. A., Persson, P. O. G., Fairall, C. W., Guest, P. S., et al., 2010. Parametrizing turbulent exchange over summer sea ice and the marginal ice zone. Quarterly Journal of the Royal Meteorological Society, 136(649): 927-943. DOI:10.1002/qj.618 (  0) 0) |
Bertosio, C., Provost, C., Athanase, M., Sennéchael, N., Garric, G., Lellouche, J. M., et al., 2022. Changes in freshwater distribution and pathways in the Arctic Ocean since 2007 in the Mercator Ocean global operational system. Journal of Geophysical Research: Oceans, 127(6): e2021JC017701. DOI:10.1029/2021JC017701 (  0) 0) |
Brugler, E. T., Pickart, R. S., Moore, G. W. K., Roberts, S., Weingartner, T., and Statscewich, H., 2014. Seasonal to interannual variability of the Pacific water boundary current in the Beaufort Sea. Progress in Oceanography, 127: 1-20. DOI:10.1016/j.pocean.2014.05.002 (  0) 0) |
Cohen, L., Hudson, S. R., Walden, V. P., Graham, R. M., and Granskog, M. A., 2017. Meteorological conditions in a thinner Arctic sea ice regime from winter to summer during the Norwegian Young Sea Ice Expedition (N-ICE2015). Journal of Geophysical Research: Atmospheres, 122(14): 7235-7259. DOI:10.1002/2016JD026034 (  0) 0) |
Fer, I., 2009. Weak vertical diffusion allows maintenance of cold halocline in the central Arctic. Atmospheric and Oceanic Science Letters, 2(3): 148-152. DOI:10.1080/16742834.2009.11446789 (  0) 0) |
Fine, E. C., MacKinnon, J. A., Alford, M. H., and Mickett, J., 2018. Microstructure observations of turbulent heat fluxes in a warm-core Canada Basin eddy. Journal of Physical Oceanography, 48(10): 2397-2418. DOI:10.1175/JPO-D-18-0028.1 (  0) 0) |
Fine, E. C., MacKinnon, J. A., Alford, M. H., Middleton, L., Taylor, J., Mickett, J. B., et al., 2022. Double diffusion, shear instabilities, and heat impacts of a Pacific summer water intrusion in the Beaufort Sea. Journal of Physical Oceanography, 52(2): 189-203. DOI:10.1175/JPO-D-21-0074.1 (  0) 0) |
Giles, K. A., Laxon, S. W., Ridout, A. L., Wingham, D. J., and Bacon, S., 2012. Western Arctic Ocean freshwater storage increased by wind-driven spin-up of the Beaufort Gyre. Nature Geoscience, 5(3): 194-197. DOI:10.1038/ngeo1379 (  0) 0) |
Hersbach, H., Bell, B., Berrisford, P., Biavati, G., Horányi, A., Sabater, J. M., et al., 2018. ERA5 hourly data on single levels from 1959 to present. Copernicus Climate Change Service (C3S) Climate Data Store (CDS), DOI: 10.24381/cds.adbb2d47.
(  0) 0) |
Itoh, M., Nishino, S., Kawaguchi, Y., and Kikuchi, T., 2013. Barrow Canyon volume, heat, and freshwater fluxes revealed by long-term mooring observations between 2000 and 2008. Journal of Geophysical Research: Oceans, 118(9): 4363-4379. DOI:10.1002/jgrc.20290 (  0) 0) |
Itoh, M., Pickart, R. S., Kikuchi, T., Fukamachi, Y., Ohshima, K. I., Simizu, D., et al., 2015. Water properties, heat and volume fluxes of Pacific water in Barrow Canyon during summer 2010. Deep Sea Research Part Ⅰ: Oceanographic Research Papers, 102: 43-54. DOI:10.1016/j.dsr.2015.04.004 (  0) 0) |
Jackson, J. M., Allen, S. E., McLaughlin, F. A., Woodgate, R. A., and Carmack, E. C., 2011. Changes to the near-surface waters in the Canada Basin, Arctic Ocean from 1993 – 2009: A basin in transition. Journal of Geophysical Research: Atmospheres, 116(C10): C10008. DOI:10.1029/2011JC007069 (  0) 0) |
Jackson, J. M., Carmack, E. C., McLaughlin, F. A., Allen, S. E., and Ingram, R. G., 2010. Identification, characterization, and change of the near-surface temperature maximum in the Canada Basin, 1993 – 2008. Journal of Geophysical Research: Oceans, 115(C5): C05021. DOI:10.1029/2009JC005265 (  0) 0) |
Jackson, J. M., Williams, W. J., and Carmack, E. C., 2012. Winter sea-ice melt in the Canada Basin, Arctic Ocean. Geophysical Research Letters, 39(3): L03603. DOI:10.1029/2011GL050219 (  0) 0) |
Kawaguchi, Y., Itoh, M., and Nishino, S., 2012. Detailed survey of a large baroclinic eddy with extremely high temperatures in the western Canada Basin. Deep Sea Research Part Ⅰ: Oceanographic Research Papers, 66: 90-102. DOI:10.1016/j.dsr.2012.04.006 (  0) 0) |
Ladd, C., and Stabeno, P. J., 2012. Stratification on the eastern Bering Sea shelf revisited. Deep Sea Research Part Ⅱ: Topical Studies in Oceanography, 65: 72-83. DOI:10.1016/j.dsr2.2012.02.009 (  0) 0) |
Lei, R., Cheng, B., Heil, P., Vihma, T., Wang, J., Ji, Q., et al., 2018. Seasonal and interannual variations of sea ice mass balance from the central Arctic to the Greenland Sea. Journal of Geophysical Research: Oceans, 123(4): 2422-2439. DOI:10.1002/2017JC013548 (  0) 0) |
Lin, P., Pickart, R. S., Våge, K., and Li, J., 2021. Fate of warm Pacific water in the Arctic Basin. Geophysical Research Letters, 48(20): e2021GL094693. DOI:10.1029/2021GL094693 (  0) 0) |
Lincoln, B. J., Rippeth, T. P., Lenn, Y. D., Timmermans, M. L., Williams, W. J., and Bacon, S., 2016. Wind-driven mixing at intermediate depths in an ice-free Arctic Ocean. Geophysical Research Letters, 43(18): 9749-9756. DOI:10.1002/2016GL070454 (  0) 0) |
Locarnini, R. A., Mishonov, A. V., Baranova, O. K., Boyer, T. P., Zweng, M. M., Garcia, H. E., et al., 2018. World Ocean Atlas 2018, Volume 1: Temperature. NOAA Atlas NESDIS 81, Silver Spring, Maryland, 52pp.
(  0) 0) |
Macdonald, R. W., Carmack, E. C., and Wallace, D. W., 1993. Tritium and radiocarbon dating of Canada Basin deep waters. Science, 259(5091): 103-104. DOI:10.1126/science.259.5091.103 (  0) 0) |
Maykut, G. A., and McPhee, M. G., 1995. Solar heating of the Arctic mixed layer. Journal of Geophysical Research: Oceans, 100(C12): 24691-24703. DOI:10.1029/95JC02554 (  0) 0) |
McPhee, M. G., 1992. Turbulent heat flux in the upper ocean under sea ice. Journal of Geophysical Research: Atmospheres, 97(C4): 5365-5379. DOI:10.1029/92JC00239 (  0) 0) |
McPhee, M. G., 2002. Turbulent stress at the ice/ocean interface and bottom surface hydraulic roughness during the SHEBA drift. Journal of Geophysical Research: Atmospheres, 107(C10): 8037. DOI:10.1029/2000JC000633 (  0) 0) |
McPhee, M. G., Kikuchi, T., Morison, J. H., and Stanton, T. P., 2003. Ocean-to-ice heat flux at the North Pole environmental observatory. Geophysical Research Letters, 30(24): 2274. DOI:10.1029/2003GL018580 (  0) 0) |
Mcphee, M. G., Kottmeier, C., and Morison, J., 1999. Ocean heat flux in the central Weddell Sea during winter. Journal of Physical Oceanography, 29(6): 1166-1179. DOI:10.1175/1520-0485(1999)029<1166:OHFITC>2.0.CO;2 (  0) 0) |
Melsheimer, C., and Spreen, G., 2019. AMSR2 ASI Sea Ice Concentration Data, Antarctic, Version 5.4 (NetCDF). Data Publisher for Earth & Environmental Sciences, DOI: 10.1594/PANGAEA.898400.
(  0) 0) |
Newton, J. L., and Sotirin, B. J., 1997. Boundary undercurrent and water mass changes in the Lincoln Sea. Journal of Geophysical Research: Oceans, 102(C2): 3393-3403. DOI:10.1029/96JC03441 (  0) 0) |
Okkonen, S. R., Ashjian, C. J., Campbell, R. G., Maslowski, W., Kinney, J. C., and Potter, R., 2009. Intrusion of warm Bering/Chukchi waters onto the western Beaufort Shelf. Journal of Geophysical Research: Atmospheres, 114(9): C00A11. DOI:10.1029/2008JC004870 (  0) 0) |
Pickart, R. S., Pratt, L. J., Torres, D. J., Whitledge, T. E., Proshutinsky, A., Aagaard, K., et al., 2009. Evolution and dynamics of the flow through Herald Canyon in the western Chukchi Sea. Deep Sea Research Part Ⅱ: Topical Studies in Oceanography, 57(1): 5-26. DOI:10.1016/j.dsr2.2009.08.002 (  0) 0) |
Pickart, R. S., Spall, M. A., and Mathis, J. T., 2013. Dynamics of upwelling in the Alaskan Beaufort Sea and associated shelf-basin fluxes. Deep Sea Research Part Ⅰ: Oceanographic Research Papers, 76: 35-51. DOI:10.1016/j.dsr.2013.01.007 (  0) 0) |
Polyakov, I. V., Pnyushkov, A. V., Rember, R., Padman, L., Carmack, E. C., and Jackson, J. M., 2013. Winter convection transports Atlantic water heat to the surface layer in the eastern Arctic Ocean. Journal of Physical Oceanography, 43(10): 2142-2155. DOI:10.1175/JPO-D-12-0169.1 (  0) 0) |
Proshutinsky, A., Krishfield, R., Timmermans, M. L., Toole, J., Carmack, E., McLaughlin, F., et al., 2009. Beaufort Gyre freshwater reservoir: State and variability from observations. Journal of Geophysical Research: Oceans, 114(C1): C00A10. DOI:10.1029/2008JC005104 (  0) 0) |
Proshutinsky, A., Krishfield, R., Toole, J. M., Timmermans, M. L., Williams, W., Zimmermann, S., et al., 2019. Analysis of the Beaufort Gyre freshwater content in 2003 – 2018. Journal of Geophysical Research: Oceans, 124(12): 9658-9689. DOI:10.1029/2019JC015281 (  0) 0) |
Rampal, P., Weiss, J., and Marsan, D., 2009. Positive trend in the mean speed and deformation rate of Arctic sea ice, 1979 – 2007. Journal of Geophysical Research: Oceans, 114(C5): C05013. DOI:10.1029/2008JC005066 (  0) 0) |
Shaw, W. J., Stanton, T. P., McPhee, M. G., Morison, J. H., and Martinson, D. G., 2009. Role of the upper ocean in the energy budget of Arctic sea ice during SHEBA. Journal of Geophysical Research: Oceans, 114(C6): C06012. DOI:10.1029/2008JC004991 (  0) 0) |
Shimada, K., Carmack, E. C., Hatakeyama, K., and Takizawa, T., 2001. Varieties of shallow temperature maximum waters in the western Canadian Basin of the Arctic Ocean. Geophysical Research Letters, 28(18): 3441-3444. DOI:10.1029/2001GL013168 (  0) 0) |
Stanton, T. P., Shaw, W. J., and Hutchings, J. K., 2012. Observational study of relationships between incoming radiation, open water fraction, and ocean-to-ice heat flux in the Transpolar drift: 2002 – 2010. Journal of Geophysical Research: Oceans, 117(C7): C07005. DOI:10.1029/2011JC007871 (  0) 0) |
Steele, M., Ermold, W., and Zhang, J., 2011. Modeling the formation and fate of the near-surface temperature maximum in the Canadian Basin of the Arctic Ocean. Journal of Geophysical Research: Oceans, 116(C11): C11015. DOI:10.1029/2010JC006803 (  0) 0) |
Steele, M., Morison, J., Ermold, W., Rigor, I., Ortmeyer, M., and Shimada, K., 2004. Circulation of summer Pacific halocline water in the Arctic Ocean. Journal of Geophysical Research: Atmospheres, 109(2): C02027. DOI:10.1029/2003JC002009 (  0) 0) |
Stroeve, J. C., and Notz, D., 2018. Changing state of Arctic sea ice across all seasons. Environmental Research Letters, 13(10): 103001. DOI:10.1088/1748-9326/aade56 (  0) 0) |
Timmermans, M. L., Proshutinsky, A., Golubeva, E., Jackson, J., Krishfield, R., McCall, M., et al., 2014. Mechanisms of Pacific summer water variability in the Arctic's central Canada Basin. Journal of Geophysical Research: Oceans, 119(11): 7523-7548. DOI:10.1002/2014JC010273 (  0) 0) |
Timmermans, M. L., Proshutinsky, A., Krishfield, R. A., Perovich, D. K., Richter-Menge, J. A., Stanton, T. P., et al., 2011. Surface freshening in the Arctic Ocean's Eurasian Basin: An apparent consequence of recent change in the wind-driven circulation. Journal of Geophysical Research: Oceans, 116(C8): C00D03. DOI:10.1029/2011JC006975 (  0) 0) |
Timmermans., M. L., Toole, J., and Krishfield, R., 2018. Warming of the interior Arctic Ocean linked to sea ice losses at the basin margins. Science Advances, 4(8): eaat6773. DOI:10.1126/sciadv.aat6773 (  0) 0) |
Toole, J. M., Timmermans, M. L., Perovich, D. K., Krishfield, R. A., Proshutinsky, A., and Richter-Menge, J. A., 2010. Influences of the ocean surface mixed layer and thermohaline stratification on Arctic sea ice in the central Canada Basin. Journal of Geophysical Research: Oceans, 115(C10): C10018. DOI:10.1029/2009JC005660 (  0) 0) |
Tschudi, M., Meier, W. N., and Stewart, J. S., 2019. Quicklook Arctic Weekly EASE-Grid Sea Ice Motion Vectors, Version 1. NASA National Snow and Ice Data Center Distributed Active Archive Center, Boulder, Colorado.
(  0) 0) |
von Appen, W., and Pickart, R., 2012. Two configurations of the western Arctic shelfbreak current in summer. Journal of Physical Oceanography, 42(3): 329-351. DOI:10.1175/JPO-D-11-026.1 (  0) 0) |
Wang, J., Watanabe, E., Ikeda, M., Mizobata, K., Walsh, J., Bai, X., et al., 2009. Is the dipole anomaly a major driver to record lows in Arctic summer sea ice extent?. Geophysical Research Letters, 36(5): L05706. DOI:10.1029/2008GL036706 (  0) 0) |
Watanabe, E., 2011. Beaufort shelf break eddies and shelf-basin exchange of Pacific summer water in the western Arctic Ocean detected by satellite and modeling analyses. Journal of Geophysical Research: Atmospheres, 116(C8): C08034. DOI:10.1029/2010JC006259 (  0) 0) |
Weingartner, T., Aagaard, K., Woodgate, R., Danielson, S., Sasaki, Y., and Cavalieri, D., 2005. Circulation on the north central Chukchi Sea Shelf. Deep Sea Research Part Ⅱ: Topical Studies in Oceanography, 52(24): 3150-3174. DOI:10.1016/j.dsr2.2005.10.015 (  0) 0) |
Weingartner, T., Cavalieri, D., Aagaard, K., and Sasaki, Y., 1998. Circulation, dense water formation, and outflow on the northeast Chukchi Shelf. Journal of Geophysical Research, 103(C4): 7647-7661. DOI:10.1029/98JC00374 (  0) 0) |
Woodgate, R. A., 2018. Increases in the Pacific inflow to the Arctic from 1990 to 2015, and insights into seasonal trends and driving mechanisms from year-round Bering Strait mooring data. Progress in Oceanography, 160(27): 124-154. DOI:10.1016/j.pocean.2017.12.007 (  0) 0) |
Woodgate, R. A., Aagaard, K., and Weingartner, T., 2005. A year in the physical oceanography of the Chukchi Sea: Moored measurements from autumn 1990 – 1991. Deep Sea Research Part Ⅱ: Topical Studies in Oceanography, 52(24): 3116-3149. DOI:10.1016/j.dsr2.2005.10.016 (  0) 0) |
Woodgate, R. A., and Peralta-Ferriz, C., 2021. Warming and freshening of the Pacific inflow to the Arctic from 1990 – 2019 implying dramatic shoaling in Pacific winter water ventilation of the Arctic water column. Geophysical Research Letters, 48(9): e2021GL092528. DOI:10.1029/2021GL092528 (  0) 0) |
Yang, J., 2006. The seasonal variability of the Arctic Ocean Ekman transport and its role in the mixed layer heat and salt fluxes. Journal of Climate, 19(20): 5366-5387. DOI:10.1175/JCLI3892.1 (  0) 0) |
Yang, J., 2009. Seasonal and interannual variability of downwelling in the Beaufort Sea. Journal of Geophysical Research: Oceans, 114(C1): C00A14. DOI:10.1029/2008JC005084 (  0) 0) |
Yang, J., Comiso, J., Krishfield, R., and Honjo, S., 2001. Synoptic storms and the development of the 1997 warming and freshening event in the Beaufort Sea. Geophysical Research Letters, 28(5): 799-802. DOI:10.1029/2000GL011896 (  0) 0) |
Zhang, W., Wang, Q., Wang, X., and Danilov, S., 2020. Mechanisms driving the interannual variability of the Bering Strait throughflow. Journal of Geophysical Research: Oceans, 125: e2019JC015308. DOI:10.1029/2019JC015308 (  0) 0) |
Zhao, J. P., and Cao, Y., 2011. Summer water temperature structures and their interannual variation in the upper Canada Basin. Advances in Polar Science, 22(4): 71-90. (  0) 0) |
 2024, Vol. 23


