2) Key Laboratory of Submarine Geosciences and Prospecting Techniques, MOE and College of Marine Geosciences, Ocean University of China, Qingdao 266100, China;
3) Laboratory for Marine Mineral Resources, Qingdao Marine Science and Technology Center, Qingdao 266071, China
In recent years, the area of the sea ice in the Arctic has been decreasing with the global warming, and the Arctic shipping lanes are expected to be opened. The Arctic region is rich in mineral resources, accounting for one quarter of the world's oil and natural gas resources. Lots of researches have been conducted in the Arctic region on the oil and gas resources, the hydroacoustic characteristics and compositions of seabed sediments, the distribution and sources of clay minerals, and the climate changes (e.g., Burlin and Shipel'kevich, 2006; Hill and Driscoll, 2008; Zhao et al., 2019; Kim et al., 2020a; Li et al., 2021).
The acquisition of sub-seafloor physical properties and the identification of sub-bottom sediment type and structure are very important for submarine geological hazard surveys. There are mainly two methods to determine the physical properties of the seafloor surface sediments. One method is sampling the sediments by grabbing, box or gravity corer sampling, and then determining the physical properties of the seafloor surface sediments in the laboratory, which is costly and time-consuming (e.g., Meng et al., 2015). The other is the acoustic wave detection method. By recording and interpreting the reflected waves travelling through the sub-seafloor layers, the physical properties of the sub-bottom sediments are obtained. This method is economical and can accurately determine the acoustic parameters, types and physical parameters (e.g., bulk density, porosity, and shear strength) of the seafloor sediments (e.g., Wang and Stewart, 2015; Zheng et al., 2017; Rahili and Cahyono, 2019; Zhen et al., 2023).
Acoustic impedance is a parameter with definite physical significance. It is often used for reservoir characterization and predictive analysis of formation lithology (Wang, 2014), and is the product of rock density and P-wave velocity. Acoustic impedance inversion is simply the transformation of seismic data into pseudoacoustic impedance logs at every trace, with all information in the seismic data retained. Chirp sub-bottom profiler data have been successfully used to quantitatively calculate the physical parameters of shallow seafloor sediments. For example, Schock et al. (1989) calculated the absorption attenuation curve of shallow sedimentary layers using sub-bottom profiler data collected at the Narraganset Bay. LeBlanc et al. (1992) performed acoustic impedance inversion calculations on sub-bottom profiler data from the Narraganset Bay near Rhode Island, USA, and obtained sub-bottom sediment types. Wood and Lindwall (1996) performed full-waveform inversion based on a convolution model on sub-bottom profiler data collected along the coast of Florida to obtain the acoustic impedance of sub-bottom sediment. Bull et al. (1998) calculated the seafloor reflection coefficient based on the amplitude of the primary and secondary reflected waves on the seafloor. Stevenson et al. (2002) calculated the absorption attenuation factor of sedimentary strata from the sub-bottom profiler data using the instantaneous frequency matching method adjusted by a casual attenuation filter. Vardy (2015) extracted the acoustic impedance information of the sedimentary layer from sub-bottom profiler data using a genetic algorithm with the objective function defined by the least square sum of the waveform fitting difference. Liu et al. (2015, 2016, 2020, 2021), Liu and Liu (2015, 2016) and Liu and Zhong (2021) proposed the utilization of developed amplitude variations with offset inversion method to estimate the elastic parameters of the interface between the seawater and seafloor sediment. Chen et al. (2016) used the chirp sub-bottom profiler data to invert seafloor properties in the mud volcano region of the southwestern Dongsha Islands. Kim et al. (2016) explored the buried site of an ancient wooden shipwreck off the west coast of Korea by using chirp sub-bottom profiler data. Li et al. (2017) used the sub-bottom profiler data to analyze the river sediments. The chirp sub-bottom profiler data in the area near the Chukchi Plateau in the Arctic have been widely used for qualitative analysis of the subbottom sediment structures (e.g., Hill et al., 2007; Hill and Driscoll, 2008; Jakobsson et al., 2008; Uchida, 2012; Dove et al., 2014; Kim et al., 2020b). However, there is limited scientific research on quantitatively calculation of the physical properties of sediments. At present, a large amount of sub-bottom profiler data have been collected in the Arctic region (e.g., Zhao et al., 2017; Boggild et al., 2020). Compared to the seabed sampling data, the sub-bottom profile data cover a larger area and are more readily accessible. Hence, the sub-bottom profiler data is conducive to obtaining seabed geotechnical properties more efficiently over a larger area.
In this paper, a sub-bottom sediment acoustic impedance model was established according to the characteristics of the shallow stratigraphic structure at the edge of the deep-sea basin on the west side of the Chukchi Sea, and the effectiveness of the algorithm was verified by iterative inversion. The acoustic impedance inversion (using the time-domain adaptive search matching algorithm) was then performed on the processed chirp sub-bottom profiler data, and the seafloor sediment grain size was determined according to the empirical formula between the acoustic impedance and the sediment grain size.
2 MethodsThe time-domain adaptive search matching algorithm first determine the time point m1 with the maximum peak value in the received waveform record y(n), then takes a waveform signal centered on m1, which is equal in length to the wavelet, and calculates the cross-correlation value of the waveform signal and the wavelet. When the cross-correlation value is greater than the predefined threshold, this section of signal is considered effective and will be used in the subsequent processes. Otherwise, it is treated as noise and compressed by multipling a very small coefficient. Subsequently, the reflection coefficient at this time point will be calculated by multiplying the peak value M1 at the time point by a constant scale factor μ, and the reflection coefficient values at other time points are set to 0. Then the remaining waveform record is calculated by subtracting the forward waveform record obtained by the convolution of this reflection coefficient and the wavelet from the received waveform record y(n). The above search steps will be repeated in the remaining waveform record until the iteration stop condition is reached. Through iterations, the reflection coefficient model is updated, the absolute value of the reflected wave amplitude in the remaining waveform records decreases, and the correlation coefficient between the forward waveform records and the initially received waveform records gradually increases.
The specific processes are as follows. Set the maximum value of the sequence y(n) (n = 1, ···, N) as M1 according to the length L of the incident wavelet x(n) and the waveform shape, identify the reflected wave segment of length L centered on m1 in the reflected signal sequence y(n), and calculate the correlation coefficient λ of this segment with the wavelet x(n). If the λ value is greater than the given threshold, define:
| $ {d_1}(n) = \left\{ {\begin{array}{*{20}{c}} 0&{n \ne {m_1}} \\ {\mu {M_1}}&{n = {m_1}} \end{array}} \right., $ | (1) |
where μ is a constant scale factor.
Amend the y(n) series to:
| $ {y_1}(n) = y(n) - x(n) * {d_1}(n), $ | (2) |
where '*' denotes the convolution.
Define the d2(n) sequence as:
| $ {d_2}(n) = \left\{ {\begin{array}{*{20}{c}} 0&{n \ne {m_2}} \\ {\mu {M_2}}&{n = {m_2}} \end{array}} \right., $ | (3) |
where M2 = y(m2) is the maximum value of the sequence of y1(n). Then the current h(n) = d1(n) + d2(n), and the p-th sequence of y(n) can be obtained by successive iterations:
| $ {y_p}(n) = y(n) - x(n) * \left[ {{d_1}(n) + {d_2}(n) + \cdot \cdot \cdot + {d_p}(n)} \right]. $ | (4) |
The p-th estimated sequence of h(n) is:
| $ h(n) = {d_1}(n) + {d_2}(n) + \cdot \cdot \cdot + {d_p}(n). $ | (5) |
If the correlation value between the convolved signal hp(n)*x(n) and the signal y(n) is greater than a given threshold, the p-th estimated sequence hp(n) is set as the reflection coefficient sequence of the stratum.
In this paper, the value of μ = 0.8 is chosen according to Lin (1997). A μ value greater than 0.8 may make the hp(n) sequence difficult to converge and hover around the h(n) expectation sequence, while a μ value that is too small makes the convergence slower. Fig. 1 shows the flow chart of the time-domain adaptive search matching algorithm.

|
Fig. 1 Flow chart showing general processes of a time domain adaptive search matching algorithm. |
When the plane wave is incident normal to the horizontal reflection interface, the reflection coefficient and the acoustic impedance have the following relationship:
| $ {Z_{i + 1}} = {Z_i} \times \frac{{1 + {R_i}}}{{1 - {R_i}}}. $ | (6) |
The recursion formula between the wave impedance value of the (i+1)th layer and the wave impedance value of the first layer is:
| $ {Z_{i + 1}} = {Z_0}\prod\nolimits_{k = 1}^{i + 1} {\frac{{1 + {R_k}}}{{1 - {R_k}}}}, $ | (7) |
where Z0 is the acoustic impedance of the seafloor surface layer and Rk is the reflection coefficient of the k-th layer. Therefore, once the reflection coefficient of all strata and the acoustic impedance value Z0 of first layer are accurately known, the acoustic impedance of all strata can be derived from the recursive Eq. (7).
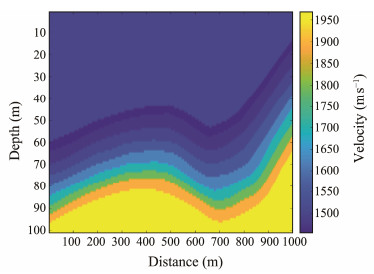
3 Numerical ExperimentsAccording to the characteristics of the shallow sediment structure at the margin of the deep sea basin on the west side of the Chukchi Plateau, a velocity model was established (Fig. 2). From top to bottom, the velocity model consists of 10 layers: sea water layer and sedimentary layers 1 to 9. The density for sea water was set to 1.0 g cm−3 and the densities for each sedimentary layer were converted from the velocities using Gardner's empirical formula, i.e., ρ = 0.31·V 0.25 The velocity, density, and acoustic impedance values are shown in Table 1.
|
Fig. 2 Velocity model of the western deep sea basin margin of the Chukchi Plateau. |
|
|
Table 1 Experimental parameters and inversion results of the model based on deep-sea basin margin on the western side of the Chukchi Plateau |
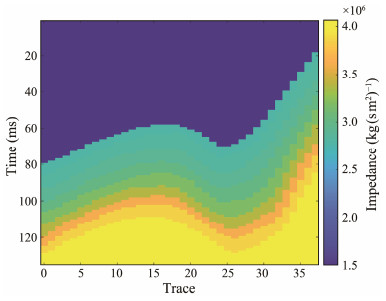
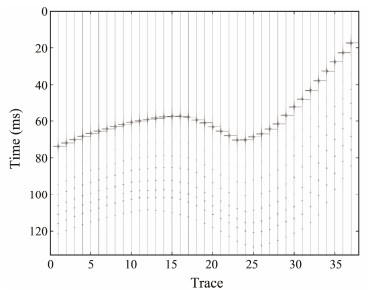
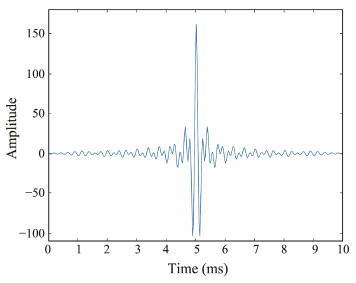
The acoustic impedance model, established based on the velocity model, is shown in Fig. 3. To reduce computation, 37 traces with a trace interval of ca. 28 m were extracted from the ca. 1000-m-long velocity model. The value of the stratigraphic reflection coefficient was calculated from the acoustic impedance model (Fig. 3), and the forward waveform records (Fig. 4) were calculated by convolving the stratigraphic reflection coefficient with the source wavelet (Fig. 5). The source wavelet (Fig. 5) used in the paper is the autocorrelation zero phase Klauder wavelet of a chirp pulse.
|
Fig. 3 Constructed acoustic impedance model. |
|
Fig. 4 Synthetic seismograms produced by convolving the Klauder wavelet with the reflection coefficient model. |
|
Fig. 5 Cross-correlation of the chirp pulse produces a Klauder wavelet, using a sample rate of 32 kHz. |
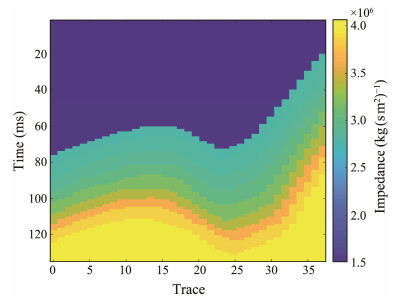
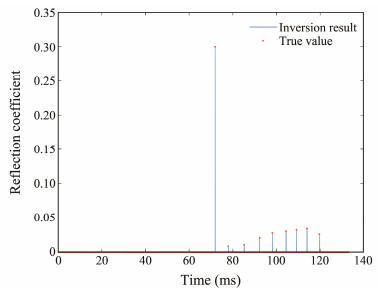
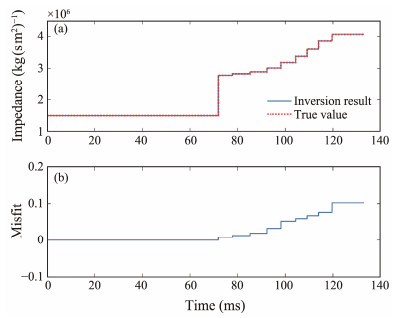
The time-domain adaptive search matching algorithm requires input of forward waveform records (Fig. 4) and source wavelet (Fig. 5). And by iteration, the reflection coefficient value is inverted. According to Eq. (7), the acoustic impedance inversion profile is obtained by setting Z0 equal to the acoustic impedance value of seawater (Fig. 6). The sum of squared errors between the forward waveform records, calculated from the reflection coefficient inversion result and the source wavelet, and the input waveform records is 1.5705×10⁻⁸. In order to visualize the single trace inversion result in the whole acoustic impedance profile, the second synthetic record (Fig. 4) is randomly selected as the input data of the time-domain adaptive search matching algorithm. The output includes reflection coefficient sequence and acoustic impedance values. The reflection coefficients (Fig. 7) are basically consistent with the theoretical model. The acoustic impedance curves obtained from the inversion fit the real acoustic impedance curves very well for each stratum (Fig. 8), with a relative error of less than 2.52×10⁻⁶. Fig. 9 shows that the absolute error between the input reflected waveform data and the inversed reflected waveform record is less than 5.0×10⁻⁵, and the relative error is less than 2.5×10⁻⁶. In this section, we constructed a sedimentary acoustic impedance model of the western deepsea basin margin of the Chukchi Plateau. The Klauder wavelet was selected as the source wavelet, and the theoretical waveform records were obtained through forward calculation. The source wavelet and the theoretical waveform record were used as the input data of the time-domain adaptive search matching algorithm, and the reflection coefficient sequence and acoustic impedance values were obtained through iterations. The sum of squared errors between the theoretical waveform and the waveform calculated from the inversion result is 1.4532×10⁻⁸, indicating the validity of the algorithm.
|
Fig. 6 Inverted acoustic impedance results. |
|
Fig. 7 Comparison of the inverted and true reflection coefficient of the second trace. |
|
Fig. 8 (a) Comparison of the inverted and true acoustic impedance of the second trace. (b) Misfit between the inverted and true acoustic impedance. |

|
Fig. 9 (a) Comparison of the synthetic seismograms produced by convolving the Klauder wavelet with the inverted reflection coefficient and the theoretical seismograms. (b) Misfit between the inverted and the theoretical seismograms. |
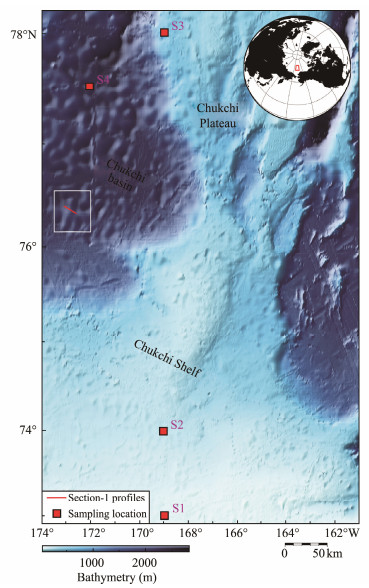
The sub-bottom profiler data for this study were acquired in September 2020 during China's 11th Arctic scientific research cruise aboard R/V Xuelong 2. The experiment was conducted near the Chukchi Plateau area in the Arctic Ocean (Fig. 10). The source excitation parameters are listed in Table 2.
|
Fig. 10 Bathymetry map of the study area. The red line (in the white box) represents the location of the sub-bottom profiler used for acoustic impedance inversion (Fig. 12). Red filled squares indicate the locations of the existing seafloor sampling points S1, S2, S3 and S4. The upper right inset shows the location of the study area. This figure was constructed using GMT 6 (Wessel et al., 2019). Bathymetry data are from a global bathymetry and topography grid, SRTM-15+ (Tozer et al., 2019). |
|
|
Table 2 Excitation parameters of seismic sources |
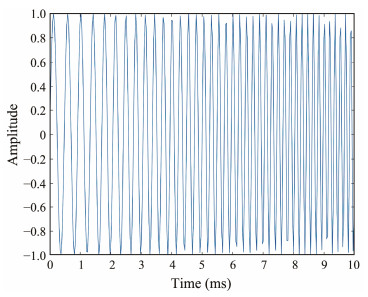
The chirp (Linear FM) seismic wavelet, a signal with instantaneous frequency increasing linearly with time, was used in the sub-bottom profiler measurements on the Chukchi Plateau (Fig. 11). The waveform expression of the seismic wavelet in the time domain is as follows:
| $ s(t) = \sin \left({2{\text{π }}\int_0^t {f(t'){\text{d}}t'} } \right) = \sin \left({2{\text{π }}\left({{f_{{\text{start}}}} + \frac{\mu }{2}t} \right)t} \right). $ | (8) |
|
Fig. 11 Amplitude vs. time plot of 10 millisecond raw chirp pulse, swept 2 to 6 kHz with a center frequency of 4 kHz. |
The instantaneous frequency f (t) of this signal is linearly related to time and is calculated by the following formula:
| $ f(t) = {f_{{\text{start}}}} + \mu \cdot t, $ | (9) |
where 0 ≤ t ≤ T and T is the time length of the source wavelet. μ is the slope, which is expressed as follows:
| $ \mu = \left({{f_{{\text{stop}}}} - {f_{{\text{start}}}}} \right)/T. $ | (10) |
In this paper, the chirp sub-bottom profiler data were processed using TOPAS software. Firstly, matched filtering is used to improve the resolution. Then, band-pass filtering and adjacent trace stacking are performed to improve the signal-to-noise ratio. The s_seismic2wavelet function provided by the MATLAB toolkit Seislab_10.0301 was used to extract the source wavelet from the data. Subsequently, the processed data and the extracted seismic wavelet were fed into the time-domain adaptive search matching algorithm module to derive the reflection coefficient sequence and acoustic impedance values by iterative inversion. Based on the conversion equation between acoustic impedance and sediment grain size, the seafloor sediment grain size profile was calculated.
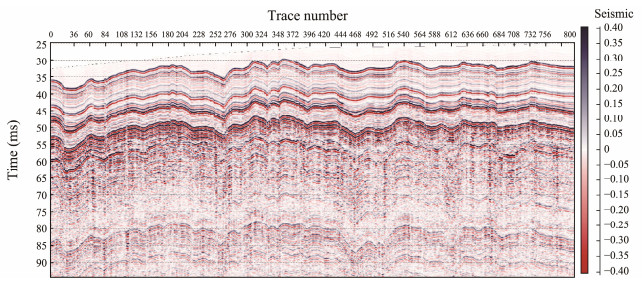
5 Results and Discussion 5.1 Acoustic Impedance Profile Result and EvaluationEight hundred traces, indicated by the red lines in Fig. 10, were used for the acoustic impedance inversion. Fig. 12 shows the sub-bottom profiler.
|
Fig. 12 Section from a chirp sub-bottom profiler of the west side of Chukchi Plateau. |
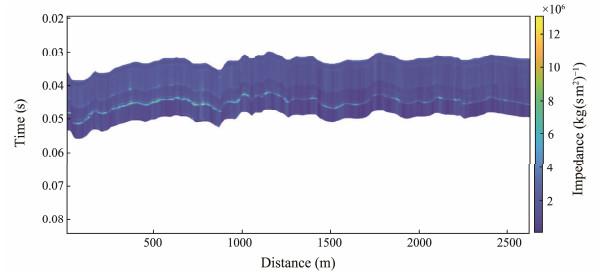
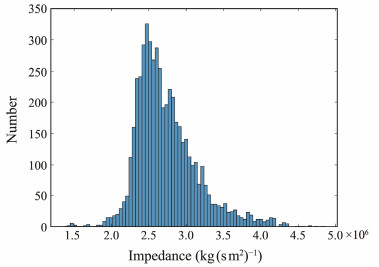
After extracting the wavelet, the time domain adaptive search matching algorithm was used to obtain the acoustic impedance profile (Fig. 13). The profile after interpolation in the horizontal direction is shown in Fig. 13, and the lateral tract spacing is 1/8 of the original. Upon comparison of Figs. 12 and 13, the shallow stratigraphic features of the acoustic impedance profile are generally consistent with the stratigraphic pattern on the shallow sub-bottom profile. The average acoustic impedance value of the submarine surface layer in Fig. 13 is 2.5026×10⁶ kg (s m2)−1. The frequency histogram of the acoustic impedance values for the seafloor surface layer is shown in Fig. 14. In the histogram, the values are classified into a total of 80 groups with each group spacing of 0.05×10⁶ kg (s m2)−1. Among all the recorded traces (5161 in total), there are 2640 traces with acoustic impedance values in the range from 2.2×10⁶ to 2.65×10⁶ kg (s m2)−1, accounting for 51.2%. The number of channels with acoustic impedance values in the range from 2.40×10⁶ to 2.45×10⁶ kg (s m2)−1 is the highest with 367 traces. Based on the data from three existing boreholes in the vicinity of this area (S1, S2 and S3 in Fig. 10) (Meng et al., 2015), the wet bulk density values of the seafloor sediments are 1.5, 1.58 and 1.72 g m−3, with an average value of 1.64 g m−3. The sound speeds in the submarine surface sediment layers are 1425.1, 1441.3 and 1457.1 m s−1, with a mean of 1441.17 m s−1 According to the acoustic impedance formula, the average acoustic impedance value of the submarine surface sediment is 2.3862× 10⁶ kg (s m2)−1, which is well agree with the inversion result obtained in this paper.
|
Fig. 13 Acoustic impedance profile of the whole chirp sonar session shown in Fig. 12, which was calculated by the time domain adaptive search matching algorithm. |
|
Fig. 14 Histogram of the distribution of acoustic impedance values in the sedimentary layer of the seafloor. |
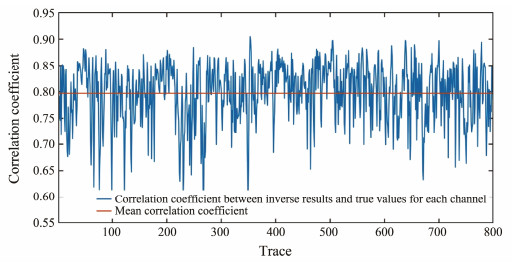
To evaluate the inversion result, the distribution of correlation values between the waveform records calculated from each channel inversion result and the input waveform records is shown in Fig. 15 (with a total of 800 traces involved in the inversion before interpolation). Most of the correlation values in Fig. 15 fall within the range between 0.7 and 0.9, with an average of 0.8 marked by the red line. This indicates the strong correlation between the waveform records obtained by inversion and those, and proves that the inversion result is quite reasonable.
|
Fig. 15 Correlation coefficient between the inversion result and the true value of each channel. |
According to Meng et al. (2015), the surface sediments in the Chukchi Sea consist mainly of clayey silt. We use the empirical relationship between the Index of Impedance (IOI) of siliceous sediments, the sediment acoustic parameters and physical properties proposed by Richardson and Briggs (2004) (Table 3). The IOI is calculated by multiplying the density of the sediment layer by the ratio of the sound speed in the sediment to the sound speed in the seawater (Richardson and Briggs, 2004). It is independent of the pore water temperature, salinity and pressure, but reflects the intrinsic properties of the medium through which sound waves propagate (Richardson and Briggs, 2004).
|
|
Table 3 Empirical predictive relationships of physical and geoacoustic properties based on the IOI for siliciclastic sediments |
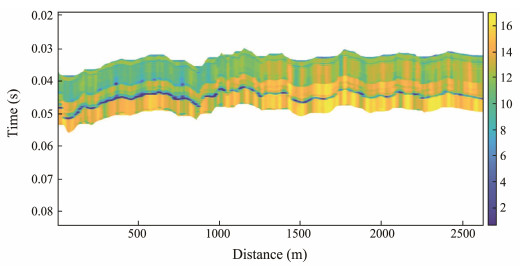
The sediment grain size profile (Fig. 16) was calculated according to the empirical relationship provided in Table 3. A comparison with the acoustic impedance profile (Fig. 13) reveals that the magnitude of the acoustic impedance is positively correlated with the sediment grain size.
|
Fig. 16 Sediment grain size profile of whole chirp sonar session in Fig. 12. |
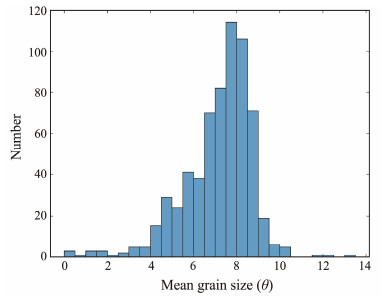
The mean grain size (θ) of the seafloor surface sediment (Fig. 16) is 7.1498. Fig. 17 shows the frequency histogram of sediment grain size for the submarine strata, classified into 28 groups spaced at intervals of 0.5. The number of samples with grain size values (θ) between 6.5 and 9 is 443, accounting for 68.79% of the total 644 samples, and the group with grain size (θ) between 7.5 and 8 contains the largest number of samples, accounting for 17.7% of the total.
|
Fig. 17 Histogram of the distribution of sediment grain size. |
Meng et al. (2015) obtained the grain size values (θ) at three sampling sites (S1, S2, and S3 in Fig. 10) near the study sea area, with values of 7.0, 8.4, and 7.3, respectively (Table 4), which are consistent with our results. According to the mineral grain size classification criteria given in Table 5, the sediment types in the study area are described as very fine silt or clay.
|
|
Table 4 Geotechnical properties and sound velocities obtained from different sediment cores (Chen, 2012; Meng et al., 2015) |
|
|
Table 5 Grain size classification criteria (Wentworth, 1922) |
During the China's third Arctic scientific research in 2008, a core, 287.5 cm in length, was collected near the study area (at the site S4 in Fig. 10). A detailed analysis of the samples revealed that the sand content ranged from 0 to 13.73%, with an average value of 1.02% (Chen, 2012). The content of silt is high, ranging from 44.22% to 84.04% with an average value of 60.5%. The clay content ranged from 13.35% to 55.66% with an average value of 38.48%. The sample is silty clay at the top and gradually changes to clay at the bottom, which also shows good agreement with our results.
Base on a cluster analysis of the, grain size and other compositions over more than 4700 core sediment samples from the Chukchi Sea and the adjacent Arctic Ocean, the submarine sediments are divided into 15 categories, with argillaceous silt clay and clay mud being predominant (Kolesnik et al., 2017).
In summary, the seafloor sediment types identified by the method proposed in this paper are largely consistent with the previous sediment classifications in the area, which supports the effectiveness and accuracy of the inversion method.
6 ConclusionsIn this paper, an acoustic impedance model was established based on the structural characteristics of the shallow strata at the margin of the deep sea basin on the west side of the Chukchi Plateau, and the forward waveform records were obtained. The acoustic impedance inversion results were obtained after the iterative calculation of the time-domain adaptive search matching algorithm. The misfit between the inversion results and the theoretical model is less than 0.067%. Furthermore, the time domain adaptive search matching algorithm was applied to the inversion of the acoustic impedance over the processed sub-bottom profiler data, which revealed an average acoustic impedance value of 2.5026×10⁶ kg (s m2)−1 and an average grain size value (θ) of 7.1498 for the submarine surface stratum, indicating a predominant distribution of very fine silt.
AcknowledgementsWe thank the chief, captain, crew, and science parties of the 11th Chinese National Arctic Research Expedition. This research was supported by the National Key R&D Program of China (No. 2021YFC2801202), the National Natural Science Foundation of China (No. 42076224), and the Fundamental Research Funds for the Central Universities (No. 202262012).
Boggild, K., Mosher, D. C., Travaglini, P., Gebhardt, C., and Mayer, L., 2020. Mass wasting on Alpha Ridge in the Arctic Ocean: New insights from multibeam bathymetry and sub-bottom profiler data. Geological Society, London, Special Publications, 500(1): 323-340. DOI:10.1144/SP500-2019-19 (  0) 0) |
Bull, J. M., Quinn, R., and Dix, J. K., 1998. Reflection coefficient calculation from marine high resolution seismic reflection (Chirp) data and application to an archaeological case study. Marine Geophysical Research, 20(1): 1-11. DOI:10.1023/A:1004373106696 (  0) 0) |
Burlin, Y. K., and Shipel'kevich, Y. V., 2006. Principal features of the tectonic evolution of sedimentary basins in the western Chukchi Shelf and their petroleum resource potential. Geotectonics, 40(2): 135-149. DOI:10.1134/S0016852106020051 (  0) 0) |
Chen, S., Yan, P., and Wang, Y. L., 2016. Inversion of the physical properties of the seabed using Chirp sub-bottom data in mud volcanoes field of the Southwest of Dongsha Islands. Journal of Earth Science, 41(3): 425-432 (in Chinese with English abstract). DOI:10.3799/dqkx.2016.034 (  0) 0) |
Chen, Y., 2012. Comparative study of sediment cores from the Chukchi and Bering Basins and its paleoceanographic implications during late Quaternary. Master thesis. First Institute of Oceanography.
(  0) 0) |
Dove, D., Polyak, L., and Coakley, B., 2014. Wide-spread, multisource glacial erosion on the Chukchi Margin, Arctic Ocean. Quaternary Science Reviews, 92: 112-122. DOI:10.1016/j.quascirev.2013.07.016 (  0) 0) |
Hill, J. C., and Driscoll, N. W., 2008. Paleodrainage on the Chukchi shelf reveals sea level history and meltwater discharge. Marine Geology, 254(3-4): 129-151. DOI:10.1016/j.margeo.2008.05.018 (  0) 0) |
Hill, J. C., Driscoll, N. W., Brigham-Grette, J., Donnelly, J. P., Gayes, P. T., and Keigwin, L., 2007. New evidence for high discharge to the Chukchi Shelf since the Last Glacial Maximum. Quaternary Research, 68(2): 271-279. DOI:10.1016/j.yqres.2007.04.004 (  0) 0) |
Jakobsson, M., Polyak, L., Edwards, M., Kleman, J., and Coakley, B., 2008. Glacial geomorphology of the central Arctic Ocean: The Chukchi Borderland and the Lomonosov Ridge. Earth Surface Processes and Landforms, 33(4): 526-545. DOI:10.1002/esp.1667 (  0) 0) |
Kim, S., Polyak, L., Joe, Y., Niessen, F., Kim, H., Choi, Y., et al., 2020a. Combined high-resolution seismostratigraphic and morphobathymetric analysis reveals glacial history of the northwestern Chukchi margin, Arctic Ocean. ESS Open Archive, https://doi.org/10.1002/essoar.10505223.1.
(  0) 0) |
Kim, Y. G., Kim, S., Lee, D. H., Lee, Y. M., Kim, H. J., Kang, S. G., et al., 2020b. Occurrence of active gas hydrate mounds in the southwestern slope of the Chukchi Plateau, Arctic Ocean. Episodes, 43(2): 811-823. DOI:10.18814/epiiugs/2020/020053 (  0) 0) |
Kim, Y. J., Koo, N. H., Cheong, S. H., Kim, J. K., Kim, S. M., Seo, K. S., et al., 2016. A case study of pseudo 3D Chirp subbottom profiler survey at ancient wooden ship-wreck site in Korea. Near Surface Geoscience 2016–Second Applied Shallow Marine Geophysics Conference. Barcelona, 1-5, https://doi.org/10.3997/2214-4609.201602150.
(  0) 0) |
Kolesnik, A. N., Astakhov, A. S., and Kolesnik, O. N., 2017. Recent deposition environments in the Chukchi Sea and adjacent areas of the Arctic Ocean: Evidence from Q-cluster analysis of sediment compositions and grain sizes. Russian Geology and Geophysics, 58(12): 1468-1477. DOI:10.1016/j.rgg.2017.11.011 (  0) 0) |
LeBlanc, L. R., Mayer, L., Rufino, M., Schock, S. G., and King, J., 1992. Marine sediment classification using the chirp sonar. The Journal of the Acoustical Society of America, 91(1): 107-115. DOI:10.1121/1.402758 (  0) 0) |
Li, C. Z., Yang, Y., Wang, R., and Zheng, J., 2017. Inversion of river-bottom sediment parameters using mechanically sampled specimens and subbottom profiling data. Applied Geophys, 14(2): 225-235. DOI:10.1007/s11770-017-0621-1 (  0) 0) |
Li, S., Dou, T., and Xiao, C., 2021. A preliminary investigation of Arctic sea ice negative freeboard from in-situ observations and radar altimetry. Journal of Ocean University of China, 20(2): 307-314. DOI:10.1007/s11802-021-4380-5 (  0) 0) |
Lin, J. X., 1997. Adaptive iteration method for enhancing the stability of inverse algorithm. Acta Acustica, 22(3): 193-197 (in Chinese with English abstract). (  0) 0) |
Liu, Y., and Liu, X., 2015. Seafloor elastic parameters estimation based on AVO inversion. Marine Geophysical Research, 36(4): 335-342. DOI:10.1007/s11001-015-9260-1 (  0) 0) |
Liu, Y., and Liu, X., 2016. Application and performances of unconstrained optimization methods in seafloor AVO inversion. Arabian Journal of Geosciences, 9(15): 652-658. DOI:10.1007/s12517-016-2692-3 (  0) 0) |
Liu, Y., and Zhong, Y., 2021. Machine learning-based seafloor seismic prestack inversion. IEEE Transactions on Geoscience and Remote Sensing, 59: 4471-4480. DOI:10.1109/TGRS.2020.3019073 (  0) 0) |
Liu, Y., Liu, C., Xie, C., and Zhao, Q. X., 2021. A hybrid regularization operator and its application in seismic inversion. IEEE Access, 9: 117378-117387. DOI:10.1109/ACCESS.2021.3106912 (  0) 0) |
Liu, Y., Liu, X., and Ning, H., 2016. Analysis and improvement for a linearized seafloor elastic parameter inversion method. Journal of Applied Geophysics, 128: 110-114. DOI:10.1016/j.jappgeo.2016.03.015 (  0) 0) |
Liu, Y., Tinivella, U., and Liu, X., 2015. An inversion method for seafloor elastic parameters. Geophysics, 80(3): N11-N21. DOI:10.1190/geo2014-0028.1 (  0) 0) |
Liu, Y., Zhong, Y., Liu, K., and Hua, Q., 2020. Seafloor elastic-parameter estimation based on a regularized AVO inversion method. Marine Geophysical Research, 41(1): 5-15. DOI:10.1007/s11001-020-09405-x (  0) 0) |
Meng, X., Li, G., Han, G., and Kan, G., 2015. Sound velocity and related properties of seafloor sediments in the Bering Sea and Chukchi Sea. Acta Oceanologica Sinica, 34(5): 75-80. DOI:10.1007/s13131-015-0669-9 (  0) 0) |
Rahili, N. R., and Cahyono, B. K., 2019. 3D modeling and volume estimation of riverbed layers based on sub bottom profiler measurement data. Journal of Geospatial Information Science and Engineering, 2(1): 113-120. DOI:10.22146/jgise.39974 (  0) 0) |
Richardson, M. D., and Briggs, K. B., 2004. Empirical predictions of seafloor properties based on remotely measured sediment impedance. AIP Conference Proceedings, 728: 12-21. DOI:10.1063/1.1842992 (  0) 0) |
Schock, S. G., LeBlanc, L. R., and Mayer, L. A., 1989. Chirp subbottom profiler for quantitative sediment analysis. Geophysics, 54(4): 445-450. DOI:10.1190/1.1442670 (  0) 0) |
Stevenson, I. R., McCann, C., and Runciman, P. B., 2002. An attenuation-based sediment classification technique using Chirp sub-bottom profiler data and laboratory acoustic analysis. Marine Geophysical Researches, 23: 277-298. DOI:10.1023/A:1025708024518 (  0) 0) |
Tozer, B., Sandwell, D. T., Smith, W. H. F., Olson, C., Beale, J. R., and Wessel, P., 2019. Global bathymetry and topography at 15 Arc Sec: SRTM15+. Earth and Space Science, 6(10): 1847-1864. DOI:10.1029/2019EA000658 (  0) 0) |
Uchida, M., 2012. Multibeam bathymetric and sediment profiler evidences for ice grounding and crater on the Chukchi and Beaufort borderland, Arctic Ocean. Quaternary International, 279-280: 506-507. DOI:10.1016/j.quaint.2012.08.1741 (  0) 0) |
Vardy, M. E., 2015. Deriving shallow‐water sediment properties using post‐stack acoustic impedance inversion. Near Surface Geophysics, 13(2): 143-154. DOI:10.3997/1873-0604.2014045 (  0) 0) |
Wang, J., and Stewart, R., 2015. Inferring marine sediment type using chirp sonar data: Atlantis field, Gulf of Mexico. SEG Technical Program Expanded Abstracts 2015. Society of Exploration Geophysicists, New Orleans, 2385-2390, https://doi.org/10.1190/segam2015-5918190.1.
(  0) 0) |
Wang, S. C., 2014. Constrained sparse spike seismic inversion with regularizing and its application. Master thesis. University of Electronic Science and Technology of China.
(  0) 0) |
Wentworth, C. K., 1922. A scale of grade and class terms for clastic sediments. The Journal of Geology, 30(5): 377-392. DOI:10.1086/622910 (  0) 0) |
Wessel, P., Luis, J. F., Uieda, L., Scharroo, R., Wobbe, F., Smith, W. H. F., et al., 2019. The Generic Mapping Tools Version 6. Geochemistry, Geophysics, Geosystems, 201: 5556-5564. DOI:10.1029/2019GC008515 (  0) 0) |
Wood, W. T., and Lindwall, D. A., 1996. Full waveform inversion of field sonar returns for a visco-acoustic Earth; a comparison of linearized and fully nonlinear methods. IEEE Journal of Oceanic Engineering, 21(4): 423-431. DOI:10.1109/48.544053 (  0) 0) |
Zhao, F., Minshull, T. A., Crocker, A. J., Dowdeswell, J. A., Wu, S., and Soryal, S. M., 2017. Pleistocene iceberg dynamics on the west Svalbard margin: Evidence from bathymetric and subbottom profiler data. Quaternary Science Reviews, 161: 30-44. DOI:10.1016/j.quascirev.2017.01.019 (  0) 0) |
Zhao, J., Zhong, W., Diao, Y., and Cao, Y., 2019. The rapidly changing Arctic and its impact on global climate. Journal of Ocean University of China, 18(3): 537-541. DOI:10.1007/s11802-019-3890-x (  0) 0) |
Zhen, S., Xing, J., and Jiang, X., 2023. Seabed physical parameter research based on active-source OBS data in the Chukchi Sea Shelf of the Arctic. Journal of Ocean University of China, 22: 675-682. DOI:10.1007/s11802-023-5311-4 (  0) 0) |
Zheng, H. B., Lu, B., and Wang, Y., 2017. The overview of acoustic seabed sediment classification base on chirp sub-bottom profile sonar data. 2016 International Conference on Mechanics and Materials Science (MMS2016). Guangzhou, 885-892, https://doi.org/10.1142/9789813228177_0113.
(  0) 0) |
 2024, Vol. 23


