2) Zoological Survey of India, Fire-Proof Spirit Building, Indian Museum Complex, Kolkata 700016, West Bengal, India;
3) Noorul Islam Center for Higher Education, Kumaracoil, Thuckalay, Kanyakumari District 629180, Tamil Nadu, India
Marine biofouling is the settlement and subsequent growth of biological matter on artificial structures immersed in seawater (Anderson and Hunter, 2002; Fernando and Fernando, 2002; Minchin and Gollasch, 2003). Exposure of any marine surface leads to the colonization of microbial organisms along with various organic molecules (Rajpathak et al., 2018; Angelova et al., 2019). Animal larvae or plant spores get attached to such surfaces. It normally occurs as a result of a series of complex interactions among bacteria, protozoa, microalgae, macroalgae, and invertebrates (Prabhakar and Rao, 2000). Moreover, it is an irreversible process for the life of the individual surface, i.e., durability of the man-made structure (Rittschof, 1999).
In recent times, studying marine biofouling has become essential in view of increasing use of man-made structures and instruments placed in the sea. Marine biofouling not only results in an increase in roughness of ships' hulls, but also leads to an increase in hydrodynamic drag as the hull moves through the water, which in turn leads to an increase in fuel consumption. As a transfer mechanism, ships may act as a vector for undesirable translocation of these fouling species to the other ecosystem, which can also affect the new environment (Ruiz et al., 2000; Hewitt et al., 2004). In order to protect man-made structures from fouling organisms, particularly the macro foulers, knowledge of their ecology and seasonal abundance is necessary. Univariate and multivariate analyses are tools to validate the dataset, and can also be applied to further assess the variability of test materials and the similarity between the study sites/type of tests (Sawall et al., 2014; Wilson et al., 2017).
The present study was conducted at Pudhumadam coast near Mandapam in the Gulf of Mannar to understand the seasonal variation of fouling organisms, substrate preference of foulers using different types of test panels and their growth in terms of total biomass by using multivariate analyses and Permanova (Clarke and Gorley, 2015).
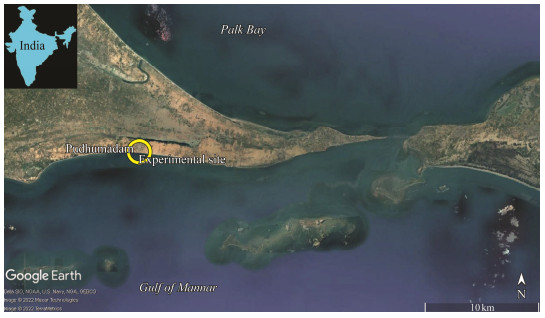
2 Materials and Methods 2.1 Study AreaPudhumadam coast (9˚16.246΄N, 78˚59.847΄E) near Mandapam in the Gulf of Mannar was selected (Fig.1) to study the abundance of dominant fouling community and diversity of foulers in the coastal waters. An Underwater Biofouling Panel (UWBFP) system erected at a depth of 4 m. The reasons for selecting this site and depth were: (a) various types of fishing vessels are operated in this region and (b) different types of artificial structures are present in this marine environment (like concrete boat jetties, wooden piers, a road bridge connecting the mainland and Rameswaram Island), and (c) the average depth of Gulf of Mannar is 5.8 m.
|
Fig. 1 Map showing the study site in the Gulf of Mannar (Source: Google Earth Pro). |
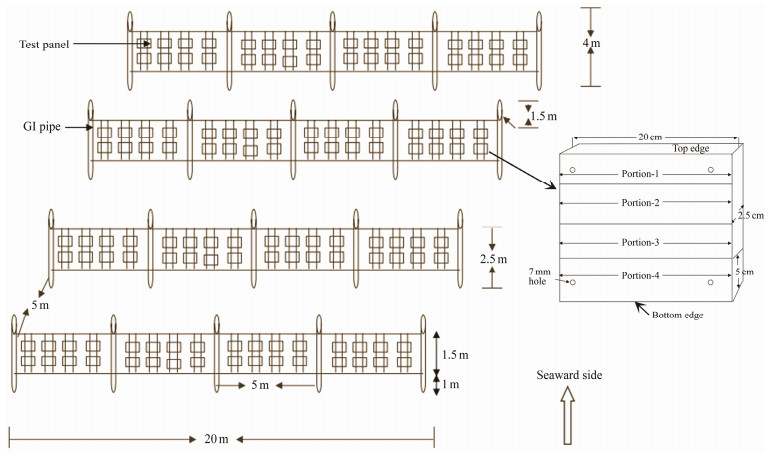
This study was carried out between December 2002 and November 2003 (further sub-classified into seasons viz., Monsoon 2002 – 2003, Post-monsoon 2003, Summer 2003 and Pre-monsoon 2003) and monitored regularly at fortnightly intervals (Fig.2). There were twenty numbers of steel pipes in four rows (5 pipes per row for four different types of test panels). All the pipes were erected at a depth of 4 m and joined with Garfil ropes that helped to hang the test panels vertically (Fig.2). Aini wood was specifically chosen for making test panels and also treated as control panels because the fishermen of the Gulf of Mannar are using this particular wood for boat construction. It is one of the most durable wood species and hence is used in boat building (Santhakumaran and Jain, 1981). It is supposed to have good resistance against marine borers and foulers (Balasubramanyan and Menon, 1963). Fiber and Tar materials were used for coating the wood panels to mimic the practice in boat building, which is supposed to safeguard the wood from fouling organisms. Concrete material was used in this study to find out the impact of macro fouling organisms on marine constructions like Jetties and Piers. In order to identify the substrate preference of fouling communities on the test panels, four different directions were considered including seaward (vertical panel area facing seaward side), shoreward, top and bottom (Fig.2).
|
Fig. 2 Schematic model of erected Underwater Biofouling Panel system. |
Three types of tests were conducted in this study. In Aseries (short-term), replicate test panels of each material were suspended at the beginning of each fortnight and replaced with a fresh set of panels at the end of every fortnight. The aim was to find out the type and quantity of organisms that may settle within a fortnight and their seasonal occurrence as biofouling organisms in the four types of test panels. In B-series (long-term), replicate test panels of each material were exposed at the beginning (November 2002) and new sets of panels were added every fortnight. At the end of 12 months period, all the test panels were collected simultaneously and then further analyzed. The aim was to find out how different exposure times and the chance/ choice of settlement of different organisms at different seasons played a role in biofouling and accumulation of biomass of biofoulers. But in C-series, 48 test panels of each material (including a replicate) were suspended at the beginning (November 2002) and 2 panels each were retrieved at fortnightly intervals. The aim was to study how different exposure times allowed the settlement of biofoulers and at the same time the seasonal variations which may influence the accumulation of biofoulers. Setting up, collection of the test panels and photography were done by SCUBA diving.
The variations in the intensity of biofoulers on either the seaward or shoreward side of test panels between the four types were analyzed using the statistical package, GRAPHPAD INSTAT V1.01. The Shannon-Wiener species diversity index was calculated to identify the substratum which had accumulated more biofoulers in this study. Multivariate analyses such as principal component analysis (PCA) was employed to identify the seasonal variability of the intensity of barnacle density and seasonal fouling biomas. Metric multidimensional scaling analysis (MDS) was employed to identify the similarity between different test series, and exposure direction of test panels. Shade plot and Canonical analysis of principal coordinates (CAP) were conducted through PRIMER version 7.0.5 to assess the variability of fouling intensity between the direction of test panels and type of test series based on different seasons (Clarke and Gorley, 2015).
3 Results 3.1 Seasonal Density of Fouling Organisms in the Biofouling CommunityForty-two macrofoulers and two microfoulers (algae) were identified from the test panels used in the UWBFP system. In this study, the observed fouling organisms were classified as proposed by Callow (1999). They were Hard and Soft Macrofoulers listed in Table 1.
|
|
Table 1 List of fouling organisms observed in the UWBFP system |
Among the hard foulers, Amphibalanus amphitrite and Amphibalanus reticulatus were the dominant forms in all the test panels. However, Amphibalanus variegatus was observed in January and December on Wood and Tar coated wood panels. They were also found on the fiber coated wood and concrete panels in December.
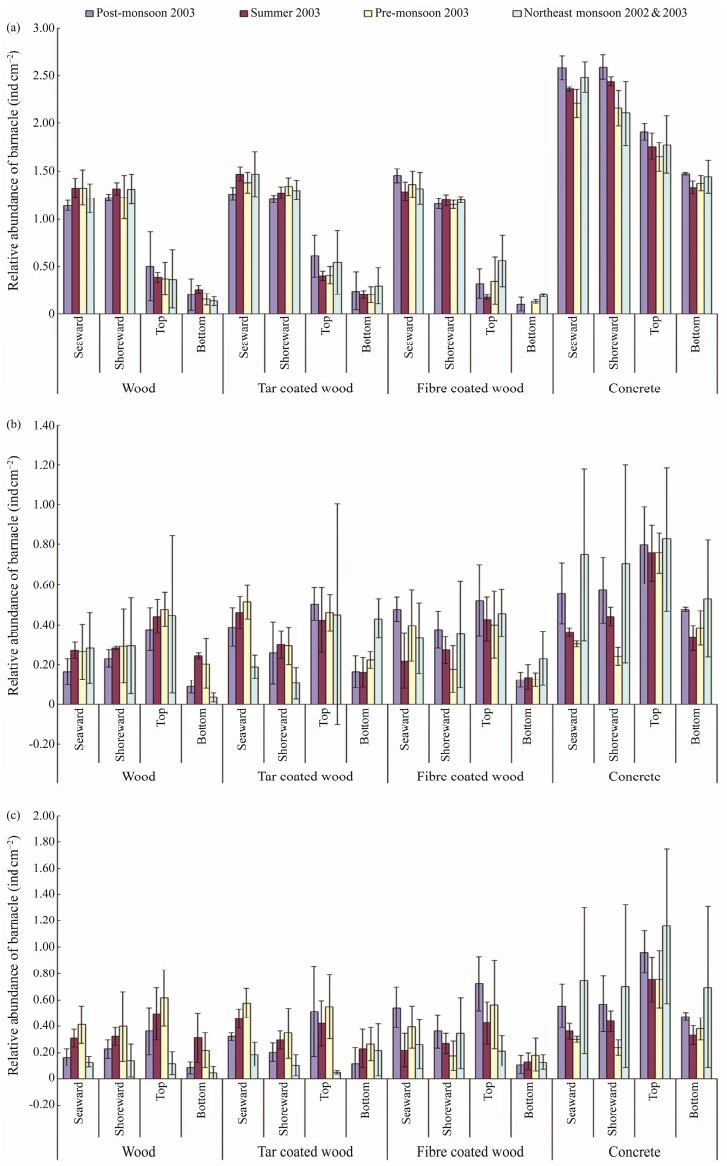
The study of barnacle density (ind cm−2) on different substrata was carried out to predict their substrate preference and seasonal abundance. The results of attachment of barnacles on different types of substrata in the three series of test panels, clearly indicated that the foulers preferred concrete substratum over the other materials, including wood, tar coated wood and fiber coated wood (Fig.3). In A-series, a comparison of barnacle attachment on all 4 types of test panels showed that the concrete panel had the highest barnacle density in all four portions, including seaward, shoreward, top and bottom edges of the test panels. Among the four portions, the shoreward portion of the concrete panel showed the highest barnacle density ((2.56 ± 0.06) ind cm−2) compared to the seaward side ((2.53 ± 0.07) ind cm−2). However, in the fiber coated wood panel, the seaward portion showed the highest barnacle density ((1.41 ± 0.05) ind cm−2). The plain wood panel showed higher barnacle density ((1.47 ± 0.09) ind cm−2) in the seaward side than that of the tar coated wood panel ((1.32 ± 0.06) ind cm−2). Principal component analysis (Fig.4a) also supported this finding and showed that there was a strong variability (PC1: 98.6% variance) between the direction of the panels. Post-monsoon season contributed more intensity of barnacle foulers irrespective of the side (seaward and shoreward) of the panels, particularly on the concrete panels. Hence, the concrete structure was found to be the most preferred substrate for the barnacle fouling in the A-series of test panels. Meanwhile, the top and bottom edge of the panels, except the concrete panel, segregated with 75% similarity in the intensity of barnacle foulers. This is due to the less preference and less space option for the foulers to settle. Moreover, the top and bottom edges of the panels were also segregated with 82% similarity. There is no graphical indication pertaining to higher barnacle density based on seasons in the other types of test panels, including wood, tar coated wood and fiber coated wood panels. However, in the case of a choice between top and bottom edges, all the test panels showed that the animals preferred the top edge rather than the bottom one. MDS (Fig.4b) showed the contribution of the intensity of barnacle settlement on the different directions of the test panels. There was no significant variation in the intensity between the seaward and shoreward sides of the panels, and only little variability was observed between the top and bottom edges of the panels. ANOVA results pertaining to variation between top and bottom edges were found to be significant (Wood-P < 0.001; F1, 6 = 43.604, 5.987, Tar-P < 0.01; F1, 6 = 20.415, 5.987, Fiber-P < 0.05; F1, 6 = 8.523, 5.987, and Concrete-P < 0.01; F1, 6 = 34.354, 5.987). In the case of different directions of the test panels, it was observed that highly significant variation was found in the A-Series (Seaward P < 0.001; F3, 44 = 2.81, 160.99 and Shoreward P < 0.001; F3, 44 = 2.81, 141.99).
|
Fig. 3 Density of barnacles (mean ± SD) in three series of test panels. (a), A-series; (b), B-series; (c), C-series. |

|
Fig. 4 Multivariate analyses on the barnacle density observed in the A-series test. PoM, Post-monsoon 200; SUM, Summer 2003; PrM, Pre-monsoon 2003; NEM, Northeast monsoon 2002 & 2003; W, wood panels; T, wood panels treated with Tar; F, wood panels treated with Fiber; C, concrete panels. |
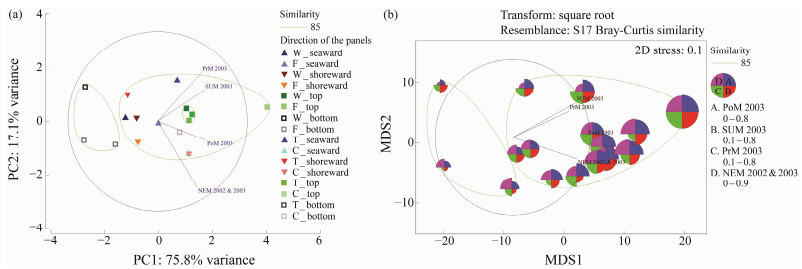
The overall variation in density of barnacles in the seaward and shoreward sides of the B-series was found to be significantly different from each other (Seaward-P < 0.05; F3, 44 = 2.81, 3.85 and Shoreward P < 0.01; F3, 44 = 2.71, 4.60). PCA also showed strong variability (PC1: 76.4% variance) between seaward and shoreward sides, while similar variability was also observed between the top and bottom edges of the panels (Fig.5a). MDS indicated that there were specific clusters on the top and bottom edges of the panels irrespective of the type of the panels except for concrete (Fig. 5b).
|
Fig. 5 Multivariate analyses on the barnacle density observed in the B-series test. PoM, Post-monsoon 2003; SUM, summer 2003; PrM, Pre-monsoon 2003; NEM, Northeast monsoon 2002 & 2003; W, wood panels; T, wood panels treated with Tar; F, wood panels treated with Fiber; C, concrete panels. |
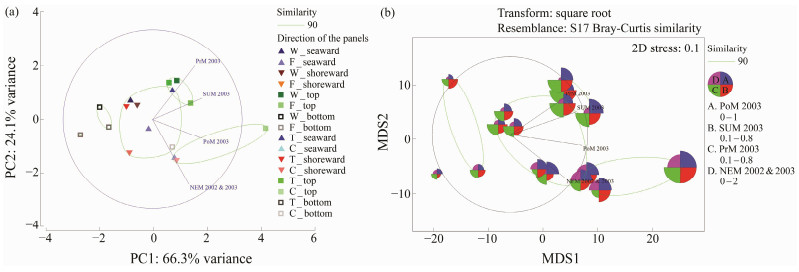
Similarly, the variation in the density of barnacle count in seaward and shoreward sides was found to be significantly different in the C-series of test panels (Seaward P < 0.05; F3, 44 = 2.71, 4.86 and Shoreward P < 0.05; F3, 44 = 2.71, 5.63). PCA also showed significant variability (PC1: 70.8% variance) between seaward and shoreward sides of the panels and only little variability (PC2: 22% variance) between the top and bottom edge of the test panels (Fig.6a). MDS showed that there were four different clusters formed with 90% similarity based on the intensity of barnacle foulers (Fig.6b). There were two clusters segregated on the top and bottom edge of the panels. The third cluster formed due to the barnacle intensity on the seaward and shoreward sides of the panels except for concrete type and the final one formed entirely on the concrete panels. This variation of barnacle count was due to the long exposure period of these panels in the marine environment and due to the exposure at different seasons.
|
Fig. 6 Multivariate analyses on the barnacle density observed in the C-series test. PoM, Post-monsoon 2003; SUM, summer 2003; PrM, Pre-monsoon 2003; NEM, Northeast monsoon 2002 & 2003; W, wood panels; T, wood panels treated with Tar; F, wood panels treated with Fiber; C, concrete panels. |
The overall variations in barnacle density in the seaward and shoreward sides between the four kinds of test panels showed significant differences. For A-series test, Seaward P < 0.001; F3, 44 = 2.81, 160.99 and Shoreward P < 0.001; F3, 44 = 2.81, 141.99. For B-series test, Seaward-P < 0.05; F3, 44 = 2.81, 3.85 and Shoreward P < 0.01; F3, 44 = 2.81, 4.60. For Cseries, Seaward P < 0.05; F3, 44 = 2.81, 4.86 and Shoreward P < 0.05; F3, 44 = 2.81, 5.63).
Thirteen different species of Polychaetes observed as biofoulers in the UWBFP system and are listed in supplementary Table 2. Eunice sp., Polyophthalmus sp., and Nereis sp., were the dominant forms in this study. These organisms were observed in almost all the fortnightly observations throughout the study period. The other Polychaetes observed in this study were Leodice antennata, Eunice tentaculata, Lepidonotus tenuisetosus, Lepidonotus cristatus, Loimia medusa, Platynereis dumerilii, Polyophthalmus pictus, Subadyte pellucida, Capitella capitata and Perinereis sp.
|
|
Table 2 Shannon-Wiener species diversity index of different test panels |
Pinctada sugillata was the dominant bivalve in this study. It was observed during the period from April 2003 to July 2003 (i.e., summer and Pre-monsoon period). P. sugillata was recorded in May 2003 (Fiber coated wood (C-series)), July (Wood and Concrete panels (C-series)) and in April 2003 (Fiber coated wood panels (B-series)). The other Bivalves observed in this study were Crassostrea sp., Pinctada imbricata fucata and Modiolus sp. These organisms were found on the shoreward side of the panels in this study. Among the other fouling forms in this study, oyster settlement was in concentrated biomass due to its abundance, surface coverage, volume and weight. Only one type of encrusting coral (Kumaraguru, 2005; Marimuthu et al., 2005) that belongs to the family Acroporidae, i.e., Montipora sp., and algal biofoulers (Marimuthu et al., 2004; Kumaraguru, 2005) was observed in the UWBFP system. Decapods and Gastropods observed in the test panels were categorized as soft foulers and listed in Table 1.
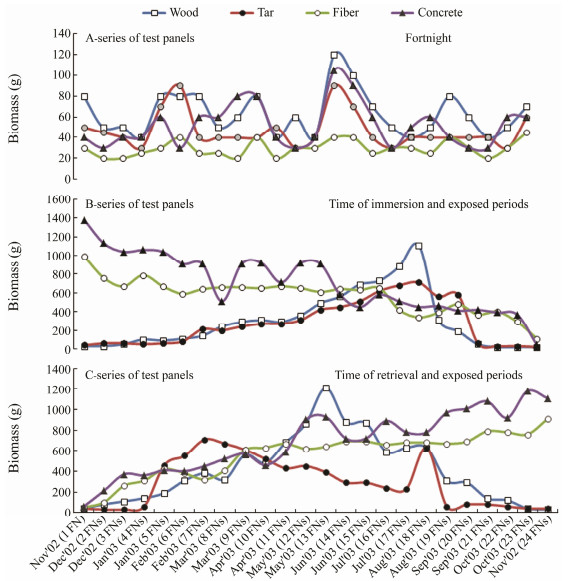
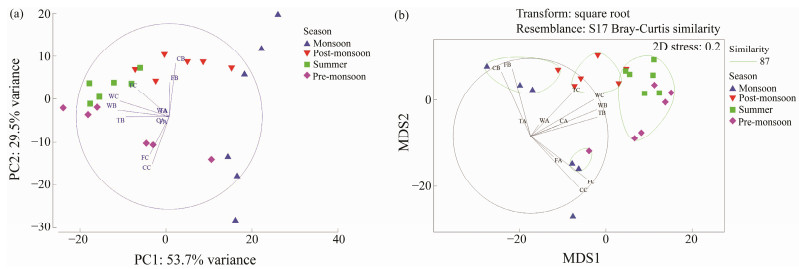
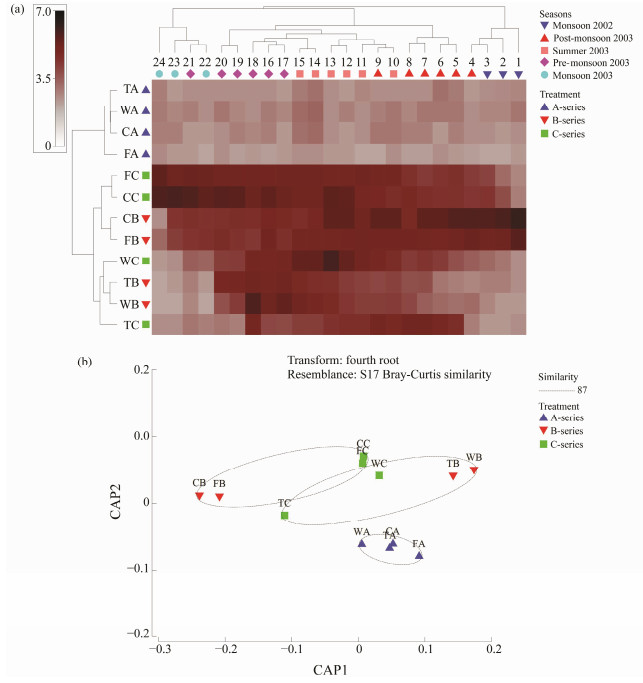
3.2 Growth of Biofoulers as Total Biomass of the Fouling CommunityThe Dry Biomass on the retrieved test panels of A-, Band C-series are given in Fig.7. The weight loss during the first 6 fortnights of wood and first 4 fortnights of tar coated wood panels of B-series, and the final four fortnights of wood and tar coated wood panels of C-series were due to the attack of marine borers and subsequent loss of the substratum itself due to decay. PCA showed strong variability (PC1: 53.7% variance) between the exposure time of panels based on the intensity of biomass observed during the study (Fig.8a). The biomass was observed more on concrete and fiber materials in Band C-series tests based on the exposure time. The trends of biomass hikes in concrete and fiber coated panels were also indicated in Fig.8a. Due to the less durability of wood and tar coated wood, their biomass studies were limited to 20 fortnights (10 months) in the Band C-series tests. Hence, plain aini wood panels were durable for a period of 17 fortnights (8.5 months) and tar coated aini wood panels were durable for 20 fortnights (10 months). MDS (Fig.8b) also supported this finding. The degradation of plain wood and tar coated wood panels in Band C-series was observed between the exposure time of 9th and 20th fortnights, and their corresponding biomass intensity was 87% similarity. On the other hand, the fiber coated wood panels were not damaged in this one-year exposure. Concrete panels showed high biomass accumulation in the first fortnight in B-series (1380 g (0.1 m2)−1) and the 23rd fortnight in C-series (1180 g (0.1 m2)−1). During this season, Bseries of fiber coated wood panels showed the good settlement of bivalves such as Pinctada sugillata, Pinctada fucata, Crassostrea gryphoides and Saccostrea cucullata. The shade plot and Canonical analysis of principal coordinates (CAP) were also supported these findings as shown in Fig.9. A-series test has been segregated as a separate cluster from the other two tests. The intensities of biomass during fortnights in Band C-series tests were also observed higher in the transformed data set (Fig.9a). Based on selected seasons, it was observed that there were eight different clusters formed. Two separate clusters formed during monsoon seasons in 2002 and 2003. One separate cluster formed during Postmonsoon season in 2003. Three clusters and two clusters were formed in summer and Pre-monsoon season of 2003, respectively. It was also observed that the nearest fortnight period got merged with the nearest seasons. Similar to MDS, there were three separate clusters with 87% similarity in CAP (Fig.9b). Due to exposure time, a separate cluster formed for the A-series test and two mixed clusters formed for the Band C-series test.
|
Fig. 7 Biomass (g) observed on three series of test panels. |
|
Fig. 8 Multivariate analyses on the biomass intensity observed in the A, B and C test series. W, wood panels; T, tar coated wood panels; F, fiber coated wood panels; C, concrete panels; A, B and C, tests conducted with different periods. |
|
Fig. 9 Shade plot and Canonical analysis of principal coordinates on intensity fouling biomass observed in three different tests. W, wood panels; T, tar coated wood panels; F, fiber coated wood panels; C, concrete panels; A, B and C, tests conducted with different periods. |
From the results of the A-series test, 11th and 12th fortnights were found to have higher biomass accumulation in all the panels (Fig.7). Lower biomass accumulation occurred in the 1st, 23rd and 24th fortnights in all the panels, which was during the Northeast monsoon period.
The Shannon-Wiener species diversity index was assessed to identify the substratum, which supports good diversity and accumulation of biofoulers in this study (Table 2). Among all the three series of tests, wood substratum showed a higher diversity index with greater accumulation of different types of fouling organisms. This was high in the longterm panels as in the Band C-series compared to the shortterm panels in the A-series.
4 DiscussionMarine biofouling by surface colonization (Anderson and Hunter, 2002; Minchin and Gollasch, 2003; Clare and Aldred, 2014) is a serious issue on the performance of ocean vessels (Ruiz et al., 2000; Hewitt et al., 2004; Munk et al., 2014). The observed fouling communities in the present study were classified into two categories as hard and soft foulers. Hard foulers are harmful organisms that secrete CaCO3 for their settlement. On the other hand, soft foulers are harmless. However, they increase the biomass of the substratum by accumulating over time. Among all the biofoulers observed in this study, Amphibalanus amphitrite was recorded as the dominant fouler. According to Callow (1999), these barnacles are classified in the category of 'Hard Macrofoulers'. The occurrence of cirripedes in the test panels throughout the study period indicated their ability to breed throughout the year. Amphibalanus variegatus was observed in January and December 2003, which indicates their availability in certain periods of the year only (Northeast monsoon period).
Oyster settlement in concentrated biomass showed its abundance, surface coverage, volume and weight. Hence, the bivalves recorded in this study are a good indicator for biomass determination. As a dominant bivalve, Pinctada sugillata was recorded in the summer and Pre-monsoon period (April to July 2003). This may be the reason for the increased biomass in the Band C-series of test panels. It could be inferred that the intensity of oyster spat settlement was common in the summer. Crassostrea gryphoides, Pinctada fucata and Modiolus philippinarum were observed as other bivalves in this study. Santhakumari and Nair (1984) have also reported Modiolus sp. as a fouler during the summer period on the west coast of India.
In the study of dry biomass estimation, the weight loss of wood in the first 6 fortnights and that of tar coated wood panels in the first 4 fortnights of B-series, and in the final 4 fortnights of wood and tar coated wood panels of C-series were due to the attack of marine borers and loss of substratum caused by decay. Hence, this study was also helpful to check the durability of the test panels in the marine environment. The high biomass accumulation up to 1.38 kg was observed on the concrete panels, coinciding with the Southwest monsoon and the consequent intense breeding season of many marine organisms and the greater settlement. During this season, B-series of fiber coated wood panels (April – November exposure) showed the good settlement of Bivalves such as Pinctada sugillata, Pinctada fucata, Crassostrea gryphoides and Saccostrea cucullata. Lower biomass accumulation occurred in the 1st, 23rd and 24th fortnights in all the panels, which was during the Northeast monsoon period. During this period, the wave action and current flow were low in the Gulf of Mannar. Consequently, the settlement was also low.
The study on barnacle density was helpful in the prediction of their substrate preference and seasonal accumulation. The densities of barnacles recorded in both Band Cseries tests were less than those found in A-series test. This indicates that the competition occurred between the barnacles and other foulers such as bivalves, algae, calcareous polychaetes and encrusting forms of corals etc., since these foulers were absent in the A-series (short-term panel). Moreover, the barnacle size was also larger (10 – 25 mm) than that in the A-series. In the short-term (15 days exposure time) panel (A-series), the size of the barnacles was small (1.5 – 2 mm).
The position of the test panels in the marine environment also played a significant role. The density of barnacle on the top edge was considerably higher than that at the bottom of the test panels in all three series throughout the year. The settlement pattern in the test panels of the UWBFP system showed that the occurrence and density of these barnacles were more in the intertidal regions such as the top portion of Galvanized iron pipes. Santhakumari and Nair (1984) also reported that the marine wood borers and foulers of India were recorded more in the intertidal regions of the west coast. Greater intensity of fouling organisms has also been reported in the intertidal regions of the tropical coastal areas (Dharmaraj and Chellam, 1983). Barnacle settlement was more in the intertidal region and their intensity of settlement decreased towards the bottom (Santhakumari and Nair, 1984).
Of all the fouling organisms recorded in the UWBFP system, barnacles were found to be the dominant ones followed by polychaetes and bivalves. The Shannon-Wiener species diversity index was calculated in this study for identifying the substratum which supports good diversity and accumulation of biofoulers. Among the three series of test panels, wood substratum showed a higher diversity index with greater accumulation of different types of fouling organisms. This index was high in the long-term panels, as in the Band C-series, compared to the short-term panels in the A-series. It was also observed that there was clear segregation of A-series of test panels with 87% similarity irrespective of type of panels by using CAP. This is possibly due to the longer exposure time of the test panels which was high in the long term panel than in the short term panel.
The present study uses statistical tools to understand the intensity of fouling communities on different types of panels in the different seasons. Multivariate analyses are practicing worldwide to understand the variability assessment on a spatial scale (Al-Sofyani et al., 2014; Sawall et al., 2014). MDS based assessment on biofouling community data associated with natural substratum and scientific instruments showed dissimilarity between the scientific instrument, ADCP and the rest of the artificial structures (Wanta et al., 2017). Watts et al. (2015) also characterised seasonal fouling communities on mussel farms based on percent cover from photo quadrat through principal coordinate analysis. In contrast, the present research studied different artificial structures (chosen test panels) with uniform size, which is helpful to compare the exact intensity of fouling communities involved. Moreover, PCA inferred the strong variabilities (PC1 between 70.8% and 98.6% variance) between the directions of the panels in connection with barnacle density. The shade plot and CAP helped to understand the segregation of the short-term series of test panels from the long-term series. It also helped in understanding the recruitment status of various faunal resources involved in biofouling. Authorities that protect coastal man-made structures against fouling communities should consider the settlement time and settlement rate. Furthermore, they may propose programs about the development of biomolecules that supports anti-settlement processes. Results from the present study may act as a reference point for future policy on controlling the biofouling communities.
5 ConclusionsThe baseline output on the intensity of fouling communities on different structures and exposure period was estimated, which involved about 42 faunas including hard and soft foulers. It would be helpful for the marine managers of the tropical environment on the settlement time and settlement rate of the individual faunal communities. It was also observed that the concrete substrate was prone to get more fouling diversity and wooden substrate without treatment got deteriorated more than the other substrates. These baseline datasets validated through multivariate analyses would also be helpful for researchers and managers to proceed further for antifouling assays against the resulting biofouling faunal components of the tropical environment.
AcknowledgementsThis research was supported by the government of India through DOD-OSTC program entitled 'Biofouling and Antifouling Organisms in the Gulf of Mannar, Southeast Coast of India' (No. DOD/11-MRDF/4/11/UNI/97/P-15). Thanks are due to funding by the Department of Ocean Development (Ministry of Earth Sciences, Government of India) through project (No. DOD/11-MRDF/4/11/UNI/97/P-15). We thank Dr. T. Balasubramanian, Former Director, CAS in Marine Biology, Annamalai University for providing facility to identify the fouling diversity. We acknowledge Drs. Antony Fernando and Olivia Fernando, CAS in Marine Biology, Annamalai University for their help in the identification of Cirriepedes and Polychaetes.
Al-Sofyani, A., Marimuthu, N., and Wilson, J. J., 2014. A rapid assessment of scleractinian and non-scleractinian coral growth forms along the Saudi Arabian Coast, Red Sea. Journal of Ocean University of China, 13(2): 243-248. DOI:10.1007/s11802-014-2308-z (  0) 0) |
Anderson, C. D., and Hunter, J. E., 2000. Whither antifouling paints after TBT? International Conference on Ship and Shipping Research (NAV 2000), 13th Congress. Paper 3. 7. Venice, Italy: 13-22. (  0) 0) |
Angelova, A. G., Ellis, G. A., Wijesekera, H. W., and Vora, G. J., 2019. Microbial composition and variability of natural marine planktonic and biofouling communities from the Bay of Bengal. Frontiers in Microbiology, 10: 2738. DOI:10.3389/fmicb.2019.02738 (  0) 0) |
Balasubramanyan, R., and Menon, T. R., 1963. Destruction of boat building timber by marine organisms in the port of Cochin, Part 1. Raft tests. Journal of Marine Biological Association of India, 5(2): 294-310. (  0) 0) |
Callow, M. E., 1999. The status and future of biocides in marine biofouling prevention. In: Recent Advances in Marine Biotechnology; Biofilms, Bioadhesion, Corrosion and Biofouling. Fingerman, M., et al., eds., Oxford and IBH Publishing Co., New Delhi, 109-126.
(  0) 0) |
Clare, A. S., and Aldred, N., 2009. Surface colonisation by marine organisms and its impact on antifouling research. In: Advances in Marine Antifouling Coatings and Technologies. Woodhead Publishing Series in Metals and Surface Engineering: 46-79. (  0) 0) |
Clarke, K. R., and Gorley, R. N., 2015. PRIMER v7. PRIMER-E, Plymouth: 296pp. (  0) 0) |
Dharmaraj, S., and Chellam, A., 1983. Settlement and growth of barnacle and associated fouling organisms in Pearl culture farm in the Gulf of Mannar. Proceedings of the Symposium on Coastal Aquaculture, 2: 608-613. (  0) 0) |
Fernando, S. A., and Fernando, O. J., 2002. A Field Guide to the Common Invertebrates of the East Coast of India. CAS in Marine Biology, Annamalai University, Parangipettai, 258pp.
(  0) 0) |
Hewitt, C. L., Campbell, M. L., Thresher, R. E., Martin, R. B., Boyd, S., Cohen, B. F., et al., 2004. Introduced and cryptogenic species in Port Phillip Bay, Victoria, Australia. Marine Biology, 144(1): 183-202. DOI:10.1007/s00227-003-1173-x (  0) 0) |
Kumaraguru, A. K., 2005. Biofouling and antifouling organisms in the Gulf of Mannar. Report submitted to Ocean Science and Technology Cell (DOD/11-MRDF/4/11/UNI/97/P-15), Department of Ocean Development, Government of India.
(  0) 0) |
Marimuthu, N., Wilson, J. J., and Kumaraguru, A. K., 2005. Encrusting form of corals as biofoulers in the marine environment of southeast coast of India. Journal of Marine Biological Association of India, 47(1): 88-91. (  0) 0) |
Marimuthu, N., Wilson, J. J., Muthuraman, B., Magesh, S., and Kumaraguru, A. K., 2004. Algae as biofoulers in Pudhumadam coastal waters in the Gulf of Mannar. Seaweed Research Utilisation Association, 26(1 & 2): 41-46. (  0) 0) |
Minchin, D., and Gollasch, S., 2003. Fouling and ships' hulls: How changing circumstances and spawning events may result in the spread of exotic species. Biofouling Supplement, 2003(Suppl): 111-122. DOI:10.1080/0892701021000057891 (  0) 0) |
Munk, T., Kane, D., and Yebra, D. M., 2014. The effects of corrosion and fouling on the performance of ocean-going vessels: A naval architectural perspective. In: Advances in Marine Antifouling Coatings and Technologies. Woodhead Publishing Series in Metals and Surface Engineering. Woodhead Publishing Limited, Boca Raton, FL, 148-176.
(  0) 0) |
Prabhakar, C. H. V., and Rao, L. M., 2000. Marine biofouling and its impact on navigational activities in relation to physicochemical characteristics of Visakhapatnam harbour waters. Pollution Research, 19(2): 271-277. (  0) 0) |
Rajpathak, S. N., Banerjee, R., Mishra, P. G., Khedkar, A. M., Patil, Y. M., Joshi, S. R., et al., 2018. An exploration of microbial and associated functional diversity in the OMZ and non-OMZ areas in the Bay of Bengal. Journal of Bioscience, 43(4): 635-648. DOI:10.1007/s12038-018-9781-2 (  0) 0) |
Santhakumaran, L. N., and Jain, J. C., 1981. Observations on the destruction of fishing craft in India by marine wood-borers with special reference to the west coast. The International Research Group on Wood Preservation, Stockholm, Document No. IRG/ WP/472: 1-30.
(  0) 0) |
Santhakumari, V., and Nair, N. B., 1984. Vertical distribution of marine wood boring and fouling organisms from the estuarine areas of the southwest coast of India. Fishery Technology, 21: 118-125. (  0) 0) |
Sawall, Y., Al-Sofyani, A., Kürten, B., Al-Aidaroos, A. M., Hoang, B. X., Marimuthu, N., et al., 2014. Coral communities, in contrast to fish communities, maintain a high assembly similarity along the large latitudinal gradient along the Saudi Red Sea Coast. Journal of Ecosystem and Ecography, 3: 4. DOI:10.4172/2157-7625.S4-003 (  0) 0) |
Wanta, A., Crawforda, R., Kakkonena, J., Kiddiea, G., Millera, S., Harrisa, R. E., et al., 2017. Biodiversity characterisation and hydrodynamic consequences of marine fouling communities on marine renewable energy infrastructure in the Orkney Islands Archipelago, Scotland, UK. Biofouling, 33(7/8): 567-579. DOI:10.1080/08927014.2017.1336229 (  0) 0) |
Watts, A. M., Goldstien, S. J., and Hopkins, G. A., 2015. Characterising biofouling communities on mussel farms along an environmental gradient: A step towards improved risk management. Aquaculture Environment Interactions, 8: 15-30. DOI:10.3354/aei00159 (  0) 0) |
Wilson, J. J., Al-Sofyani, A., and Marimuthu, N., 2017. Current biodiversity and ecological status of scleractinian corals of Sharm Obhur, Jeddah, Saudi Arabian coast of the Red Sea. Marine Biodiversity, 47: 1111-1121. DOI:10.1007/s12526-017-0784-2 (  0) 0) |
 2023, Vol. 22


