The globally renowned Yellow River Delta (YRD) is a weak tidal delta primarily shaped by terrestrial sediments, exhibiting distinctive geographical, morphological, and dynamic characteristics (Xu et al., 2016; Zhan et al., 2017; Wang et al., 2022). The coastline of the region is frequently altered due to the pronounced effects of erosion and deposition. These changes substantially influence the ecological environment of coastal zones as well as the survival and development of the local population (Hou et al., 2016; Wu et al., 2018; Lu et al., 2020). Consequently, understanding the coastline of the YRD and its erosional and depositional changes is essential for its ecological conservation and economic growth (Madeira et al., 2018; Sowman and Raemaekers, 2018; Cao et al., 2020).
Remote sensing-based imaging studies on the erosion and deposition changes in the YRD indicate notable fluctuations in these processes, resulting in a variable increase in the delta area (Kong et al., 2015; Niu and Wang, 2019). The shape and length of the YRD have been substantially altered since 1970 due to global climate change and human activity (Zhu et al., 2021). However, the selection of different remote sensing data and time intervals resulted in varying conclusions from these studies. For instance, Niu and Wang (2019) utilized the data at three-year intervals between 1986 and 2015 to determine whether the changes in YRD undergo continuous erosion, deposition, and stable erosion stages. Conversely, Kong et al. (2015) identified 1983 – 2000, 2000 – 2003, and 2003 – 2011 as the depositional, erosional, and relatively stable stages, respectively.
In addition to the overall changes, areas of notable alterations within the YRD, particularly the Qingshuigou, have also gained attention (Feng et al., 2021; Zhu et al., 2021). The Qingshuigou has also demonstrated noticeable seaward deposition (Liu et al., 2019). Zhu et al. (2021) identified a remarkable accretion zone in the Qingshuigou and Q8 courses using 10 remote sensing images from 1980 to 2020.
However, previous studies on spatial and temporal changes in the YRD had certain limitations (Niu and Wang, 2019; Feng et al., 2021). Most studies spanned several years, with relatively few focusing on interannual time scales. Several studies have also considered the YRD as a whole (Liu et al., 2019), thereby reducing the drastic changes in the current estuaries of the Qingshuigou. Some studies have examined the current estuaries of the Qingshuigou; however, their time series were relatively short and failed to reflect the long-term regional evolution of erosion and deposition.
Hence, in this study, interannual remote sensing images of the Qingshuigou in the YRD from 1984 to 2021 were utilized. A total of 38 temporal phases of the coastline, each separated by a one-year interval, were extracted. This approach enabled the monitoring of coastline dynamics in this area and the analysis of the spatial and temporal patterns of erosion and deposition.
This paper comprises six parts. Section 2 focuses on the study area and data sources. Section 3 presents the principles and methods. Section 4 shows the results of the analysis. Section 5 discusses the driving mechanisms and errors. Section 6 demonstrates the conclusions.
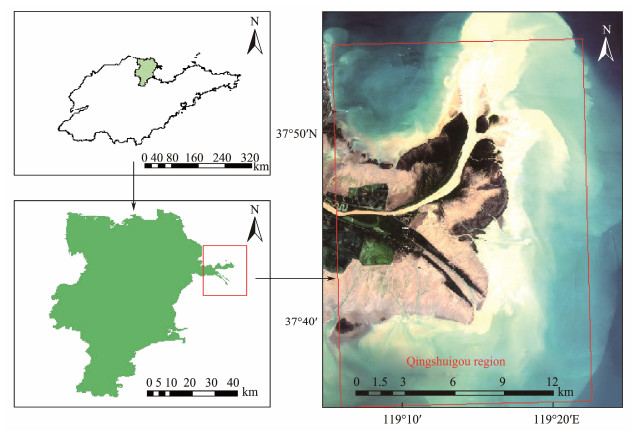
2 Study Area and Data Sources 2.1 Study AreaThe YRD, which is the youngest landmass in China, is characterized by a temperate monsoon climate with four distinct seasons, abundant sunlight, and concurrent rainfall and heat (Zhu et al., 2018; Shi et al., 2020). The average annual rainfall is 560 – 630 mm (Wei et al., 2023). The tidal regime primarily comprises irregular semidiurnal tides with an average tidal range of 0.6 to 0.8 m. The study area (Fig.1) is situated along the flow path of Qingshuigou in the contemporary YRD, spanning from 37˚35΄29΄΄ to 37˚54΄ 39΄΄N latitude and from 119˚5΄55΄΄ to 119˚22΄35΄΄E longitude. This area encompassed the Qing 8 and Qingshuigou courses.
|
Fig. 1 Schematic of the study area. |
In this study, Landsat TM/ETM+/OLI data are employed as the primary data source, encompassing 38 scenes (Table 1, 25 scenes of TM images, 4 scenes of ETM+ images, and 9 scenes of OLI images). The primary imaging period was from June to August each year. However, remote sensing data from September to October in 1989, 1994, 1995, 1997, 1998, 2004, and 2006 were selected due to limitations such as cloudiness and sensor constraints. The data set is provided by the Geospatial Data Cloud site, Computer Network Information Center, Chinese Academy of Sciences (http://www.gscloud.cn).
|
|
Table 1 Satellite remote sensing data details |
The Strip Repair tool was used for strip repair due to the failure of the Landsat-7 ETM+ sensor data after 2003. The image was preprocessed by radiometric calibration, FLAASH atmospheric correction, and cropping to mitigate noise.
2.3 Water and Sand DataThe Lijin Hydrological Station, an important hydrological station on China's major rivers, is situated in Liujiajiehe Village, Lijin Town, at coordinates 118˚18΄E and 37˚31΄N. As the final hydrological station on the Yellow River, the Lijin Hydrological Station regulates the volume of seawater and sediment entering the river (Li et al., 2022). The station collects hydrological data essential for managing the downstream Yellow River, utilizing its water and sediment resources, and fostering the development of the YRD. The annual runoff and sediment transport data used in this study were sourced from the Shandong Chorography Archive (https://shandong-chorography.org) and the Bulletin of China River Sediment (http://www.mwr.gov.cn/sj/tjgb/zghlnsgb/), respectively.
3 Methodology 3.1 Yellow River Delta Coastline ExtractionAt present, the primary methodologies for determining the location of the coastline include the same tide height for the same month method, the mean low-tide line method, and the general high-tide line method (Liu et al., 2022; Su et al., 2022). The remote sensing image acquisition period for this study was primarily from June to August and was thus less influenced by tidal action (Zhu et al., 2021); therefore, the coastline extraction method referred to and improved upon that of Liu et al. (2022).
In this study, the remote sensing images were preprocessed, and the corresponding bands were calculated using the normalized difference body index (NDWI) method. This process generates grayscale images that are sensitive to the water column. The equation for this process is as follows:
| $ NDWI = \frac{{Green - NIR}}{{Green + NIR}}, $ | (1) |
where Green and NIR represent the green and near-infrared bands, corresponding to bands 2 and 4 in Landsat TM/ETM+ and bands 3 and 5 in Landsat OLI, respectively.
The imaging environment of each scene image is distinct, and the spectra of the same feature exhibit variability even after pre-processing, necessitating the selection of distinct thresholds to binarize each scene image according to its NDWI index characteristics. The image is represented in black and white for pixels with values of 0 and 1, respectively. The processed image often lacks spatial continuity and demonstrates some small patches of interference. Therefore, the image must undergo morphological operations to increase the clarity of the boundary between water bodies and land.
The fundamental operations of morphological operations are erosion and dilation (Nogueira et al., 2021). Erosion is the process of eliminating the salient points of the image contour, thereby shrinking the boundary inward. By contrast, dilation is the act of extending the image contour, whereby the salient points of the periphery of the image are connected and extended outward, stitching and extracting the main body of the object. Additionally, dilation aims to eliminate small patches within the area of interest. In morphological operations, considering the size of the selected mathematical morphological operator kernel is also crucial. A large value will result in a pronounced effect but may also lead to the loss of details.
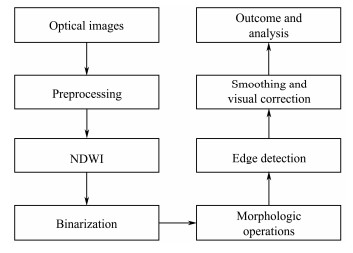
The Laplacian, Sobel, and Canny operators are commonly used in edge detection (Jing et al., 2022; Shaik et al., 2024). Compared to other operators, the Canny operator is less sensitive to noise and can yield more accurate and continuous edge lines. Therefore, the Canny operator is employed in this study to extract water edges. The coastline is extracted and processed through visual correction and vector smoothing. The processing flow is illustrated in Fig.2.
|
Fig. 2 Data processing flowchart. |
In this study, the temporal variation in erosion and deposition was examined in the designated study area at oneyear intervals. Wavelet analysis is a sophisticated signal analysis technique that simultaneously considers time and frequency domains. The capacity of this technique for multiscale signal refinement effectively compensates for the limitations of the Fourier transform, which struggles to handle local signal features (Dong et al., 2017). This comprehensive approach enables a nuanced understanding of the intricate dynamics in the alluvial deposition patterns of the YRD. This knowledge is crucial for the ecological conservation and economic development of the YRD.
The following integration of the function f(t) is called the wavelet transform of the function f(t):
| $ w(a, b) = {a^{ - 1/2}}\int_{ - \infty }^{ + \infty } f (t){\varphi^*}\left({\frac{{t - b}}{a}} \right){\text{d}}t, $ | (2) |
where φ(t) is the wavelet function, and a and b are the scale and translation parameters, respectively. Substitution of the parameters a and b yields the wavelet function family φa, b(t) = a−1/2φ[(t − b)/a].
Wavelet functions exhibit a broad range of diversity, with Morlet and DOG wavelets being among the most frequently utilized basis functions. The Morlet wavelet, a basis function in the realm of the continuous wavelet transform, is typically employed for the analysis of signal time-frequency characteristics. Owing to its localized properties within the time-frequency domain, this function is particularly adept at analyzing periodic variations because it can effectively capture the frequency components of the signal over time.
The Morlet wavelet is the product of a Gaussian function and a complex simple harmonic function. The mathematical expression is as follows:
| $ \varphi (t) = {{\mathtt{π}}^{ - 1/4}}{{\text{e}}^{ - {t^2}/2}}{{\text{e}}^{{\text{i}}ct}} . $ | (3) |
Ascertaining the relationship between scale parameter s and period T is imperative to effectively employ the Morlet wavelet for periodic analysis. The correlation between the scaling factor s and the period T of the Morlet wavelet is expressed as follows:
| $ T = \frac{{4{\mathtt{π}}a}}{{c + \sqrt {2 + {c^2}} }} . $ | (4) |
Using c = 6.2, T ≈ 1.001a. In this case, using the Morlet wavelet for the periodic analysis resulted in approximately equal wavelet transform scale and period.
3.3 Nonconsistency Analysis TestThe Mann-Kendall trend test was used for the trend analysis of time series; this method is widely used and remains unaffected in the presence of data outliers (Vani et al., 2023). Let the time series H = (h1, h2, ···, hN); thus, the standard normal distribution statistic Z is calculated as follows:
| $ Z=\left\{\begin{array}{cl} \frac{S+1}{\sigma}, & S<0 \\ 0, & S=0 \\ \frac{S-1}{\sigma}, & S>0 \end{array}\right., $ | (5) |
where
| $ S = \sum\limits_{n = 1}^{N - 1} {\sum\limits_{m = n + 1}^N {{\operatorname{sgn}} } } \left({{h_m} - {h_n}} \right), $ | (6) |
| $\operatorname{sgn}\left(h_m-h_n\right)=\left\{\begin{array}{cc} -1, & \left(h_m-h_n\right)<0 \\ 0, & \left(h_m-h_n\right)=0 \\ 1, & \left(h_m-h_n\right)>0 \end{array}\right., $ | (7) |
| $ \sigma=\operatorname{Var}(S), $ | (8) |
| $ \sigma = \frac{1}{{18}}\left[ {N(2N + 5)(N - 1) - \sum\limits_{k = 1}^t {{g_k}} \left({2{g_k} + 5} \right)\left({{g_k} - 1} \right)} \right], $ | (9) |
where hm and hn are the observed values of the hydrological series at the m and nth moments, respectively, N is the length of the series, σ is the variance of the statistic S, t is the number of groups with the same value, and gk is the number of groups with the same value as the kth group.
For a given significance level α, if the standard normal distribution statistic |Z| < Z1 − 1/α, then the series trend is insignificant, and vice versa. In this paper, the significance level is taken as 0.95, which corresponds to Z1 − 1/α = 1.96.
The Pettitt test is a mutability test with a solid theoretical foundation in analyzing time series (Xing et al., 2024). Let the time series H = (h1, h2, ···, hN) be given by
| $ {X_{i, N}} = {X_{i - 1}} + {Y_{i, N}}, {\text{ }}i = 2, {\text{ }}3, {\text{ }} \cdots, {\text{ }}N, $ | (10) |
| $ {Y_{i, N}} = \sum\limits_{j = 1}^N {{\operatorname{sgn}} } \left({{h_i} - {h_N}} \right), $ | (11) |
| $ \operatorname{sgn}\left(h_i-h_N\right)= \begin{cases}-1, & \left(h_i-h_N\right)<0 \\ 0, & \left(h_i-h_N\right)=0 \\ 1, & \left(h_i-h_N\right)>0\end{cases}, $ | (12) |
where hi and hN are the observed values of the time series at the i-th and N-th moments, respectively, and N is the length of the sequence.
The possible mutation point i satisfies the following equations:
| $ Z=\underset{1\le i\le N}{\mathrm{max}}\left|{X}_{i, N}\right|, $ | (13) |
| $ P \cong 2{{\text{e}}^{ - \frac{{6{K^2}}}{{{N^3} + {N^2}}}}}, $ | (14) |
where Z is the maximum statistic of Xi, N occurring at time i, and P is the significance test statistic.
For a given significance level α, if the significance test statistic P < α, then no significant mutation point exists in the sequence and vice versa, and a significant mutation point is observed.
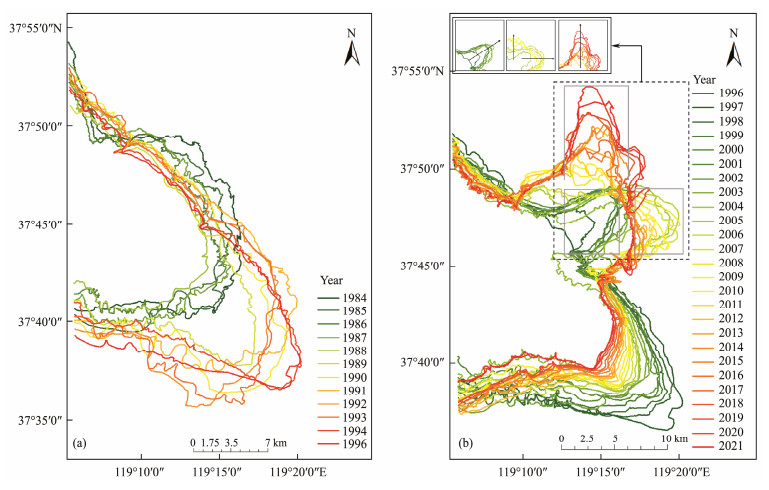
4 Results 4.1 Spatial and Temporal AnalysesThe coastline of the YRD transformed drastically from 1984 to 1996, as depicted in Fig.3(a). Such a transformation is primarily characterized by deposition and land formation. The Qingshuigou exhibited substantial oscillations that persistently developed toward the southeast. The average deposition rate in the deposition region was 426.65 m yr−1, whereas the average erosion rate in the erosion region was 245.11 m yr−1.
|
Fig. 3 Spatial distribution of the Yellow River Delta coastline in 1984 – 2021. (a), 1984 – 1996; (b), 1996 – 2021. |
The Yellow River transported a considerable volume of sediment from 1984 to 1990, leading to a dramatic expansion of the YRD and considerable changes in deposition. From 1990 to 1996, the implementation of soil and water conservation measures in the middle and upper reaches of the Yellow River reduced the amount of sediment in the lower reaches. Consequently, although land deposition remained the dominant process, the deposition area still decreased.
From 1996 to 2021, the banks of the YRD were silted toward the southeast. The coastline of the YRD in 2021 is shown in Fig.3(b). In 1996, the YRD altered its course to enter the sea from the Qing 8 Branch, thereby forming a new sea inlet. Diminished water and sand deposition and the impact of marine erosion led to a clear erosion status in the abandoned Yellow River Estuary in Qingshuigou. The coastline continually developed landward, and the area of the abandoned Yellow River estuary in Qingshuigou decreased consistently. The coastline of the Qing 8 Branch estuary continually developed seaward due to water-sand deposition, revealing substantial deposition. The coastline extended to the sea in three primary directions: northeast, east, and north.
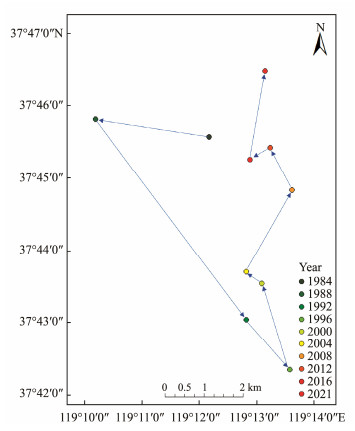
In a two-dimensional plane, the center of gravity represents the geometric center of mass. Subsequently, the center of gravity displacement trajectory denotes the direction of the spatial displacement of the center of gravity of the YRD. The location of the center of gravity in Qingshuigou is shown in Fig.4. The results reveal that the 1984 – 2021 center of gravity trajectory presents itself as follows: northwest (1984 – 1988) – southeast (1988 – 1996) – northwest (1996 – 2004) – northeast (2004 – 2008) – northwest (2008 – 2012) – southwest (2012 – 2016) – northeast (2016 – 2021). The change in the center of gravity is related to the location of the sea inlet.
|
Fig. 4 Center of gravity and displacement trajectory of Qingshuigou from 1984 to 2021. |
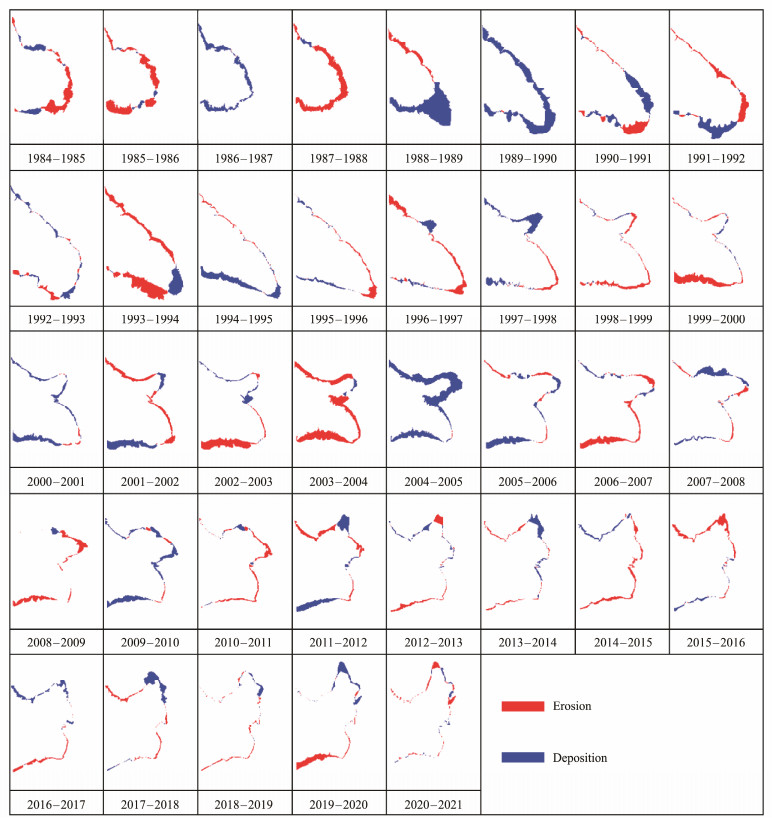
From 1984 to 2021, the annual changes in the erosion and deposition areas are presented in Fig.5. As shown in the figure, deposition was predominantly observed in the river estuary and was primarily driven by river runoff and sedimentation. Deposition and erosion occurred in alternating patterns in other regions.
|
Fig. 5 Spatial distribution of erosion and deposition in the Yellow River Delta. |
The intensity of change was greater between 1984 and 1996. This period exhibited the simultaneous occurrence of erosion and deposition over a large area, revealing an average of 28.88 km2 yr−1 of deposition, 22.53 km2 yr−1 of erosion, and rapid growth in land area, with an average increase of 6.3 km2 yr−1. Conversely, the intensity of sedimentation and erosion exhibited a gradual decline between 1996 and 2021, with an average annual deposition of 15.23 km2 and an average annual erosion of 16.18 km2. Additionally, this period demonstrated slow erosion, with an average annual decrease of 0.95 km2. This trend can be attributed to human activity and climate change. Meanwhile, erosion and deposition areas began to exhibit fragmentation.
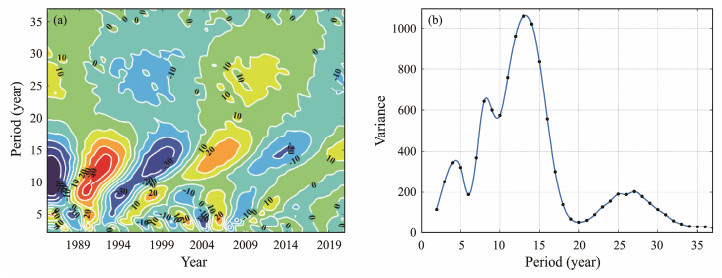
4.2 Period Analysis of Changes in the Yellow River Delta AreaThe deposition and erosion areas within the study region were scrutinized using a wavelet transform, as depicted in Fig.6. Fig.6(a) shows that the wavelet transform coefficients of the deposition area exhibited three distinct transformation cycles: 4 – 5 yr, 8 – 9 yr, and 13 – 14 yr. Notably, the 4 – 5 yr transformation cycle became more pronounced after 1990, whereas the other two cycles consistently showed stronger signals.
|
Fig. 6 Wavelet analysis of the deposition rate of Qingshuigou in the Yellow River Delta. |
In Fig.6(b), further analysis of the wavelet variance plot of the deposition area revealed three distinct peaks. The most prominent peak corresponded to the 13 yr transformation cycle, indicating that 13 yr was the primary cycle in the silt area. The second peak corresponded to the 8 yr transformation cycle, implying that 8 yr was the secondary cycle of the silt area. Considering the signal change intensity in Fig.6(a), all transformation cycles exhibited a signal weakening trend, indicating a decrease in the intensity of deposition over time.
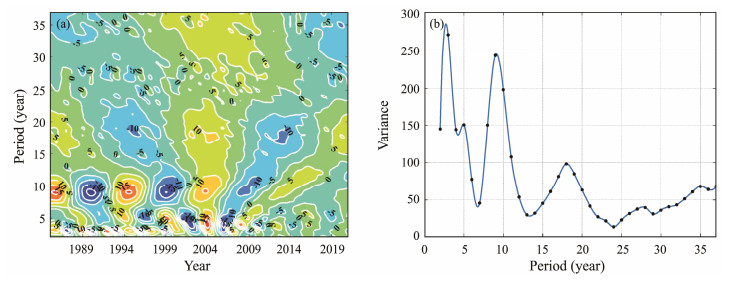
As illustrated in Fig.7(a), the erosion area exhibited transformation cycles of 2 – 3 yr, 5 – 6 yr, 9 – 10 yr, and 18 – 19 yr. Notably, the 2 – 3 yr transformation cycle terminated in 1999, potentially due to the lag effect of the YRD diversion. The 5 – 6 yr transformation cycle became more pronounced post-1994, while the 9 – 10 yr and 18 – 19 yr transformation cycles remained consistent.
|
Fig. 7 Wavelet analysis of the erosion rate of Qingshuigou in the Yellow River Delta. |
In Fig.7(b), the wavelet variance plot revealed four distinct peaks. The most prominent peak corresponded to a timescale of 3 yr, whereas the secondary peak corresponded to a timescale of 9 yr. Thus, the primary cycle of the wavelet transform coefficients of the eroded area was 3 yr, and 9 yr served as the secondary cycle. Considering the signal change intensity in Fig.7(a), the transformation cycles of 2 – 3 yr, 5 – 6 yr, and 9 – 10 yr progressively weakened, whereas the 18 – 19 yr transformation cycle remained relatively stable.
Erosion is primarily influenced by ocean dynamic factors, which inherently have a long period; thus, the 18 – 19 yr transformation cycle is reasonable. However, the existence of transformation cycles with long timescales may be attributed to time-series constraints. This finding indicates the potential for further exploration and analysis in future studies.
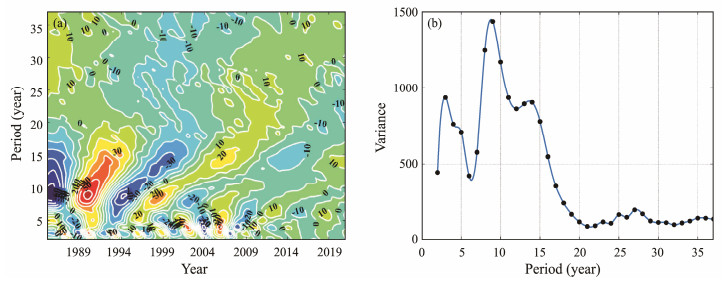
Considering the combined effects of deposition and erosion, the erosion and deposition rates exhibited transformation cycles of 3 – 4 yr, 8 – 9 yr, and 13 – 14 yr, as shown in Fig.8(a). The transformation cycles 8 – 9 yr and 13–14 yr emerged from the dispersion of the main cycle after 1994. The transformation cycles of 3 – 4 yr and 13 – 14 yr were also consistently observed. The signal intensity of the 3 – 4 yr transformation cycle initially strengthened but subsequently weakened. Conversely, the signal intensity of the 13 – 14 yr transformation cycle showed a weakening trend. The 8 – 9 yr transformation cycle disappeared after 2004.
|
Fig. 8 Wavelet analysis of the erosion and deposition rate of Qingshuigou in the Yellow River Delta. |
In Fig.8(b), further analysis of the wavelet variance plots reveals three distinct peaks with wavelet transform coefficients. The primary cycle was 9 yr and secondary cycle was 3 yr, which corresponds to the wavelet transformation cycle of the eroded area, but the order of their signal strength is different.
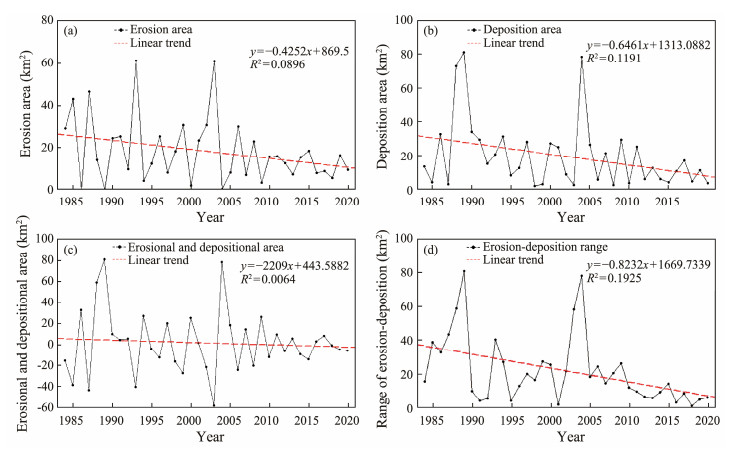
4.3 Nonconsistency AnalysisThe time series and linear regression plots for erosion area, deposition area, erosional and depositional area, and erosion-deposition range are presented in Fig.9. The range of erosion-deposition is the absolute value of erosional and depositional area and represents the yearly intensity of change. Visual inspection of the linear regression plots does not reveal any discernible trends in the time series. The nonparametric Mann-Kendall (MK) test for monotonic trends and the Pettitt test for abrupt changes were employed to further scrutinize these datasets, and the results are tabulated in Tables 2 and 3, respectively.
|
Fig. 9 Time series of erosional and depositional changes in the Yellow River Delta. (a), erosion area; (b), deposition area; (c), erosional and depositional area; and (d), erosion-deposition range. |
|
|
Table 2 Mann-Kendall trend test |
|
|
Table 3 Pettitt mutation test |
At the 5% significance level, the critical value for the MK test statistic |Z1 − α/2| is 1.96. The MK test statistic |ZMK| values for the deposition area and erosion-deposition range exceed this threshold, indicating the presence of statistically significant monotonic trends in these variables. Conversely, the |ZMK| values for the erosion area and washout volume are below the critical value, revealing an absence of discernible trends.
The Pettitt test is used to evaluate the null hypothesis of no change point within a time series. Only the washout magnitude series exhibited a P-value smaller than the significance level α, thereby rejecting the null hypothesis and confirming an abrupt shift in the data. The P-values for erosion area, deposition area, and washout volume failed to achieve statistical significance, implying the absence of detectable change points.
Synthesizing the results from both tests reveals a non-consistency in the deposition area and washout magnitude series, which exhibit notable monotonic trends and/or abrupt changes. Conversely, the erosion area and washout volume datasets demonstrate consistency, lacking evidence for either monotonic trends or change points over the studied period.
5 Discussion 5.1 Effects of Channel Evolution on Erosion and Deposition Changes in QingshuigouSection 4.1 delineates the changes in erosion and deposition within the study area from 1984 to 2021. This section examines the impact of channel evolution on erosion and deposition change in the context of river channel information to investigate the factors influencing the change in erosion and deposition.
From 1984 to 1987, deposition and erosion were highly dispersed due to the numerous streams of the Yellow River entering the sea, with no concentrated areas for either process. In 1988, the blockage of the Beichahe River was completed on June 24, and all streams were redirected to their original channels and subsequently entered the sea. In July 1989, the river diverged from a branch of the Qing 10 section, resulting in substantial deposition in the estuary and a southeastern swing of the mainstream into the sea. From 1990 to 1991, the Yellow River remained relatively stable, demonstrating minimal estuary shifting. In 1992, the estuary was cut off for 142 days, starting on February 27, thereby weakening the sediment deposition effect of the river and strengthening the tidal current effect. The Qingshuigou area was affected by tidal currents, resulting in serious fragmentation in the erosion and deposition areas from 1992 to 1993. The river remained stable from 1993 to 1995, revealing the main occurrence of deposition in the estuary, whereas other areas were predominantly characterized by erosion. The river consistently swung to the right. On July 18, 1996, the Yellow River was diverted to the Qing 8 branches. From 1996 to 1998, the original estuary exhibited an erosion state due to a reduction in sediment input, but the new estuary showed remarkable sedimentation.
The Yellow River sand input and runoff were low from 1998 to 1999, and the overall coastline showed erosion. From 1999 to 2002, the water and sand inputs of the Yellow River remained stable and mainly showed deposition in the estuary, with the estuary extending outward. In 2003, the first half of the year saw small water and sand inputs, and the coastline showed overall erosion from 2002 to 2003, with some areas demonstrating sedimentation. In 2004, the river swung outward. After the third water and sand transfer in 2004, the estuary downstream of branch 3 exited to the east, and the Yellow River then entered the sea in the east and northeast directions. The inlet branch near branch 3, as well as the overall performance of the deposition, continued to develop from 2004 to 2006. From 2007 to 2008, the inlet branch downstream of branch 3 became the main branch of the Yellow River entering the sea, and the direction of the sea was northward. The new branch remained in the initial stage of formation; therefore, the Yellow River was mainly silted in the new branch. From 2008 to 2012, the Yellow River downstream of branch 3 entered the sea as a single branch, and the estuary developed to the northeast, showing deposition. By contrast, other areas still showed alternating deposition and erosion.
From 2012 to 2013, the Yellow River was divided into two branches from a single branch, and the area outside the sand spit showed erosion due to oceanic dynamics. Since 2013, the total amount of water and sand in the Yellow River has stabilized, the area of the Qingshuigou has slightly increased, the area of the Wasted Yellow River Mouth has slightly eroded, and the overall area of the delta has stabilized. Thus, the evolution of the Yellow River channel has a certain influence on the location and degree of erosion and deposition.
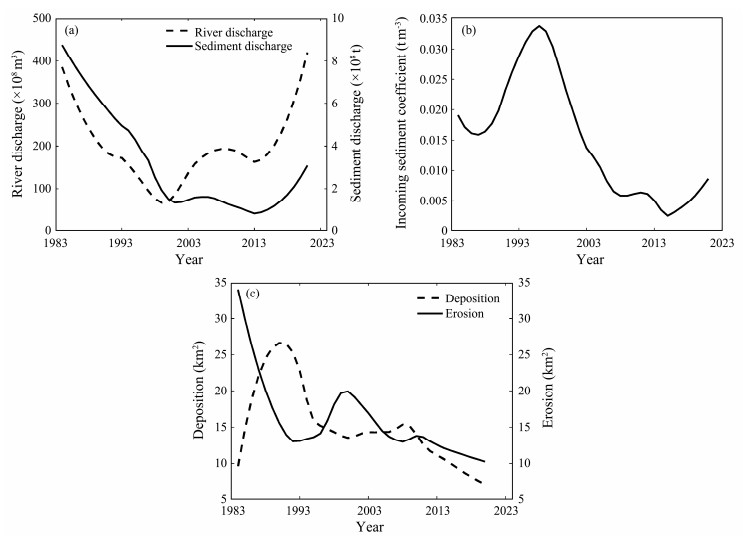
5.2 Influence of Water and Sand Volume on Deposition Changes in the Yellow River DeltaThe water and sand fluxes in the YRD have a discernible lag effect on the changes in delta flushing and deposition, with considerable interannual variations. Consequently, the annual runoff, sand transport, incoming sediment coefficient, and flushing and deposition areas were processed using LOESS smoothing and fitting. The resulting post-smoothing map using the LOESS smoothing method is presented in Fig.10.
|
Fig. 10 LOESS smoothing (a) annual runoff and sediment discharge, (b) incoming sediment coefficient, and (c) erosion and deposition rates. |
As shown in Fig.10(a), the water-sand flux at the Lijin Hydrological Station exhibited a decreasing trend from 1984 to 2001 due to the influence of the Yellow River cutoff, the conversion of farmland to forest and grassland, and the Xiaolangdi Water Conservancy Hub. This trend remained unchanged until 2002, which can be attributed to the initiation of water and sand transfers.
From 1984 to 1996, compared with the natural flow regime, inflow runoff, and sand transport decreased slightly during the early period of human activity intervention. The deposition and erosion areas showed increasing and decreasing trends, respectively. The study area reached a maximum in 1993, which was 337.8 km2, demonstrating consistent results with previous studies (Li et al., 2021).
A study of the relationship between the erosion and deposition of the YRD and the incoming sediment coefficient revealed that the delta erosion and deposition reached a critical equilibrium when the incoming sediment coefficient stabilized at 0.0157 t m−3 (Huang and Zhao, 2021). As shown in Figs.10(b) and 10(c), the incoming sediment coefficient of the YRD during 1987 – 1988 was close to 0.0157 t m−3, and the erosion and deposition areas were identical. At this time, the study area did not demonstrate notable changes, which is consistent with the conclusions made by Huang and Zhao (2021).
The deposition was generally stronger than the erosion from 1988 to 1996, and the study area expanded rapidly. Although the incoming sediment coefficient was substantially higher than 0.0157 t m−3 in 1996 – 1997, Fig.10(c) indicates that the flushing and deposition in the study area remained in a critical equilibrium state due to human factors, such as the diversion of the Yellow River. From 1997 to 2004, the incoming sediment coefficient gradually decreased, and erosion was stronger than deposition, placing the study area in a rapid erosion stage. From 2004 to 2006, the deposition area remained relatively stable, with an incoming sediment coefficient of 0.0157 t m−3. This ratio hovered around 0.0157 t m−3, and the land formation process remained in critical equilibrium. Since 2006, the incoming sediment coefficient of the Yellow River was generally small and stable, and the incoming water and sand from the Yellow River were also minimal. Until 2018, the sand content of the Yellow River substantially increased due to rainfall, water transfer, and sand transfer; however, the study area generally showed slow erosion. Thus, the appropriate incoming sediment coefficient has a certain influence on the dynamic stability of the YRD.
5.3 Error AnalysisThe YRD is only slightly affected by tides during the primary imaging timeframe of remote sensing images. However, tidal and topographic changes still exert some influence on coastline monitoring. Consequently, analyzing the errors inherent in the coastline extraction process is necessary.
Assuming that the coastline remains parallel under varying tidal conditions, the maximum error potentially induced by the tidal effect can be regarded as the area formed by the maximum distance of the tidal change in the seaward buffer of the coastline. This finding corresponded to the area of the coastal zone between the lowest and highest tidal levels.
The buffer function was used to compute the area of the coastal zone between the lowest and highest tidal levels. The previously calculated maximum distance of the seaward buffer of coastal tidal flats in the YRD on the same day is less than 172 m (Liu et al., 2012).
The relative error for each year was calculated based on the aforementioned method (Table 4). The results demonstrated that the relative error did not exceed 4.7% for the total study area. This analysis provides a comprehensive understanding of the error margins in coastline monitoring in the YRD. The results of the analysis also highlight the importance of considering tidal and topographic changes in such studies.
|
|
Table 4 Coastlines relative error analysis |
Leveraging 38 years of Landsat satellite remote sensing data facilitated the successful acquisition of the annual coastline data and the analysis of the deposition changes in the Qingshuigou channels of the YRD. The findings revealed that the coastline of the YRD primarily developed in the southeast direction from 1984 to 1996. However, the coastline of the new estuary primarily developed toward the east, northeast, and north from 1996 to 2021. The Qingshuigou area showed an increasing trend during 1984 – 2021, with the total area increasing by 52.39 km2.
The evolution of the river channel was found to influence the changes in deposition in the study area. The spatial distribution of the deposition and erosion areas was relatively dispersed, with the entrance of multiple branches to the sea. Conversely, a centralized deposition is formed, with the entrance of a single stream to the river. In recent years, under the influence of artificial water, sand transfer, and other factors, erosion and deposition areas have become relatively dispersed, forming a small deposition and erosion area in the estuary.
This study also identified a transformation cycle of the deposition and erosion areas of Qingshuigou in the YRD. However, this cycle is becoming increasingly weak, which could be attributed to the increasing influence of human activity in the YRD. The findings of this study can serve as a valuable reference for future research and policy making in terms of the management and conservation of the YRD. This comprehensive analysis provides a detailed understanding of the dynamic processes that shaped the YRD over time. The analysis also emphasizes the importance of considering various factors, such as tidal and topographic changes.
Subsequently, the Yellow River Delta region is substantially impacted by climate change. This paper presents a preliminary, non-consistent analysis of its time series. Furthermore, detailed, non-consistent analyses can be conducted in the future.
AcknowledgementThe study was supported by the National Key Research and Development Program of China (No. 2022YFC3204301).
Cao, W. T., Zhou, Y. Y., Li, R., and Li, X. C., 2020. Mapping changes in coastlines and tidal flats in developing islands using the full time series of Landsat images. Remote Sensing of Environment, 239: 111665. DOI:10.1016/j.rse.2020.111665 (  0) 0) |
Dong, S., Huang, W. N., Li, X., and Tao, S. S., 2017. Study on temporal and spatial characteristics of cold waves in Shandong Province of China. Natural Hazards, 88: 191-219. DOI:10.1007/s11069-017-2862-y (  0) 0) |
Feng, J. G., Liang, J. F., Li, Q. W., Zhang, X. Y., Yue, Y., and Gao, J. Q., 2021. Effect of hydrological connectivity on soil carbon storage in the Yellow River Delta wetlands of China. Chinese Geographical Science, 31(2): 197-208. DOI:10.1007/s11769-021-1185-9 (  0) 0) |
Hou, X. Y., Wu, T., Hou, W., Chen, Q., Wang, Y. D., and Yu, L. J., 2016. Characteristics of coastline changes in mainland China since the early 1940s. Science China Earth Sciences, 59(9): 1791-1802. DOI:10.1007/s11430-016-5317-5 (  0) 0) |
Huang, J., and Zhao, G. X., 2021. Spatiotemporal change of sediment siltation and erosion dynamics and its influences on water and sediment budgets of the Yellow River Mouth in the past 20 years based on remote sensing and GIS data. Marine Geology Frontiers, 37(3): 16-21 (in Chinese with English abstract). DOI:10.16028/j.1009-2722.2020.120 (  0) 0) |
Jing, J. F., Liu, S. J., Wang, G., Zhang, W. C., and Sun, C. M., 2022. Recent advances on image edge detection: A comprehensive review. Neurocomputing, 503: 259-271. DOI:10.1016/j.neucom.2022.06.083 (  0) 0) |
Kong, D. X., Miao, C. Y., Borthwick, A. G. L., Duan, Q. Y., Liu, H., Sun, Q. H., et al., 2015. Evolution of the Yellow River Delta and its relationship with runoff and sediment load from 1983 to 2011. Journal of Hydrology, 520: 157-167. DOI:10.1016/j.jhydrol.2014.09.038 (  0) 0) |
Li, C., Wang, Z. L., Liu, H. X., Zuo, L. Q., Lu, Y., Wu, P., et al., 2022. Impact of a water-sediment regulation scheme on nutrient variations at the Lijin station of the Yellow River. Frontiers in Environmental Science, 10: 900508. DOI:10.3389/fenvs.2022.900508 (  0) 0) |
Li, C. M., Zhu, L. N., Dai, Z. X., and Wu, Z., 2021. Study on spatiotemporal evolution of the Yellow River Delta coastline from 1976 to 2020. Remote Sensing, 13(23): 4789. DOI:10.3390/rs13234789 (  0) 0) |
Liu, X. X., Chen, S. L., Li, P., Fu, Y. T., and Zhang, C. Y., 2022. Dynamic evolution and influencing factors of the shoreline of the Huanghe River Estuary from 1996 to 2020. Marine Science Bulletin, 41(4): 436-450 (in Chinese with English abstract). DOI:10.11840/j.issn.1001-6392.2022.04.009 (  0) 0) |
Liu, Y. B., Li, X. W., and Hou, X. Y., 2019. Spatiotemporal changes to the river channel and shoreline of the Yellow River Delta during a 40-year period (1976 – 2017). Journal of Coastal Research, 36(1): 128-138. DOI:10.2112/JCOASTRES-D-19-00012.1 (  0) 0) |
Liu, Y. X., Huang, H. J., Qiu, Z. F., Chen, J. T., and Yang, X. G., 2012. Monitoring change and position of coastlines from satellite images using slope correction in a tidal flat: A case study in the Yellow River Delta. Acta Geographica Sinica, 67(3): 377-387 (in Chinese with English abstract). (  0) 0) |
Lu, J. B., Wang, H., Qin, S. H., Cao, L., Pu, R. L., Li, G. L., et al., 2020. Estimation of aboveground biomass of Robinia pseudoacacia forest in the Yellow River Delta based on UAV and Backpack LiDAR point clouds. International Journal of Applied Earth Observation and Geoinformation, 86: 102014. DOI:10.1016/j.jag.2019.102014 (  0) 0) |
Madeira, C., Mendonça, V., Leal, M. C., Flores, A. A. V., Cabral, H. N., Diniz, M. S., et al., 2018. Environmental health assessment of warming coastal ecosystems in the tropics-application of integrative physiological indices. Science of the Total Environment, 643: 28-39. DOI:10.1016/j.scitotenv.2018.06.152 (  0) 0) |
Niu, M. X., and Wang, J., 2019. Analysis of coastline change in Dongying section of Yellow River Delta based on Landsat remote sensing image. Water Resources Protection, 36(4): 26-33 (in Chinese with English abstract). DOI:10.3880/j.issn.1004-6933.2020.04.005 (  0) 0) |
Nogueira, K., Chanussot, J., Dalla Mura, M., and Dos Santos, J. A., 2021. An introduction to deep morphological networks. IEEE Access, 9: 114308-114324. DOI:10.1109/ACCESS.2021.3104405 (  0) 0) |
Shaik, I., Suhail, M., and Nagamani, P. V., 2024. Shoreline delineation and change analysis in response to sea level rise and coastal bathymetry along the coast of Visakhapatnam, India using high-resolution optical imagery. Acta Geophysica, 72: 1-20. DOI:10.1007/s11600-024-01341-3 (  0) 0) |
Shi, H. Y., Li, Q. J., Sun, J. C., Gao, G. D., Sui, Y., Qiao, S. W., et al., 2020. Variation of Yellow River runoff and its influence on salinity in Laizhou Bay. Journal of Ocean University of China, 19: 1235-1244. DOI:10.1007/s11802-020-4413-5 (  0) 0) |
Sowman, M., and Raemaekers, S., 2018. Socio-ecological vulnerability assessment in coastal communities in the BCLME region. Journal of Marine Systems, 188: 160-171. DOI:10.1016/j.jmarsys.2018.01.008 (  0) 0) |
Su, Z. M., Sun, Y. F., Song, Y. P., Liao, D. J., Song, B. H., and Du, X., 2022. Multiscale time series analysis of Yellow River Delta area based on GEE and GIS. Advances in Marine Science, 40(1): 90-101 (in Chinese with English abstract). DOI:10.12362/j.issn.1671-6647.2022.01.008 (  0) 0) |
Vani, P. C., Sahoo, B. C., Paul, J. C., Sahu, A. P., and Mohapatra, A. K. B., 2023. Trend analysis in gridded rainfall data using Mann-Kendall and Spearman's Rho Tests in Kesinga Catchment of Mahanadi River Basin, India. Pure and Applied Geophysics, 180(12): 4339-4353. DOI:10.1007/s00024-023-03379-8 (  0) 0) |
Wang, S. X., Fan, Y. Y., Liu, M., Wu, X., Wang, H. J., and Bi, N. C., 2022. Temporal and spatial variations of erosion and accumulation off the Qingshuigou Mouth of the Yellow River. Marine Geology Frontiers, 38(5): 1-11 (in Chinese with English abstract). DOI:10.16028/j.1009-2722.2021.082 (  0) 0) |
Wei, S. F., Dong, Y., Qiu, Y. X., Li, B. H., Li, S. Y., and Dong, C., 2023. Temporal and spatial analysis of vegetation cover change in the Yellow River Delta based on Landsat and MODIS time series data. Environmental Monitoring and Assessment, 195: 1057. DOI:10.1007/s10661-023-11652-5 (  0) 0) |
Wu, C. S., Liu, G. H., Huang, C., Liu, Q. S., and Guan, X. D., 2018. Ecological vulnerability assessment based on fuzzy analytical method and analytic hierarchy process in Yellow River Delta. International Journal of Environmental Research and Public Health, 15(5): 855. DOI:10.3390/ijerph15050855 (  0) 0) |
Xing, L. S., Zhao, R. X., Sun, H. Q., Li, M., and Tan, Z. Y., 2024. Analysis of drought characteristics and comparison of historical typical years with 2022 drought in the Yangtze River Basin. Natural Hazards, 120(4): 3699-3718. DOI:10.1007/s11069-023-06344-9 (  0) 0) |
Xu, N., Gao, Z. Q., and Ning, J. C., 2016. Analysis of the characteristics and causes of coastline variation in the Bohai Rim (1980 – 2010). Environmental Earth Sciences, 75(8): 719. DOI:10.1007/s12665-016-5452-5 (  0) 0) |
Zhan, C., Yu, J. B., Wang, Q., Li, Y. Z., Zhou, D., Xing, Q. H., et al., 2017. Remote sensing retrieval of surface suspended sediment concentration in the Yellow River Estuary. Chinese Geographical Science, 27(6): 934-947. DOI:10.1007/s11769-017-0921-7 (  0) 0) |
Zhu, C. M., Zhang, X., and Huang, Q. H., 2018. Four decades of estuarine wetland changes in the Yellow River Delta based on landsat observations between 1973 and 2013. Water, 10: 933. DOI:10.3390/w10070933 (  0) 0) |
Zhu, Q. T., Li, P., Li, Z. H., Pu, S. X., Wu, X., Bi, N. S., et al., 2021. Spatiotemporal changes of coastline over the Yellow River Delta in the previous 40 years with optical and SAR remote sensing. Remote Sensing, 13(10): 1940. DOI:10.3390/rs13101940 (  0) 0) |
 2024, Vol. 23


