2) Southern Marine Science and Engineering Guangdong Laboratory (Zhuhai), Zhuhai 519082, China;
3) Key Laboratory of Marine Science and Numerical Modeling, Ministry of Natural Resources, Qingdao 266061, China;
4) Qingdao Leice Transient Technology Co., Ltd., Qingdao 266100, China;
5) Qingdao Innovation and Development Base of Harbin Engineering University, Qingdao 266404, China
Low-level jets (LLJs) are horizontally concentrated, highvelocity air currents in the low troposphere and are observed across multiple regions worldwide (Stensrud, 1996). Numerous studies have examined LLJs on land, particularly in urban areas. However, only a few studies focused on LLJs over the ocean region due to sparse observation (Miao et al., 2018; Jiménez-Sánchez et al., 2020; Wu et al., 2020a; Yan et al., 2021). The northern Indian Ocean, which is located at low latitudes of the subtropics, is a crucial monsoon climate zone. Previous research mainly focused on the low trans-equatorial flow in the western Indian Ocean during the summer season. Moreover, previous studies have examined the connection between the monsoon intensity in South Asia and LLJs in the Arabian Sea and landbased observations in peninsular India (Bunker, 1965; Joseph and Raman, 1966; Findlater, 1977; Hart, 1977; Tao, 1989; Webster and Hoyos, 2004; Ruchith et al., 2014; Jalihal et al., 2022). Joseph and Sijikumar (2004) discovered that active convection over the Bay of Bengal accelerates LLJs, inducing an active phase in the monsoon.
Various instruments and equipment, including scatterometers, microwave radiometers, anemometers, moored buoys, and coherent Doppler lidar (CDL), have been employed to observe the in-situ wind field over the ocean. Each of these instruments has its advantages and limitations. For instance, the operating frequency bands of the star-carried microwave scatterometer are mainly Ku and C bands. The traditional view is that the C-band scatterometer's working wavelength is larger than the diameter of raindrops, and the influence of rainfall scattering attenuation is remarkably small. Therefore, the influence of rainfall on the wind measurement of the C-band scatterometer is often ignored. However, under a certain rainfall rate and incidence angle, the accuracy of the wind measurement of the C-band scatterometer is markedly affected by rainfall. In addition, noise, rainfall, and sensitivity of the wind field model to the training dataset affect the accuracy of the Ku-band scatterometer wind field inversion (Draper and Long, 2002; Nie and Long, 2007; Kerns and Chen, 2018; Shi and Wang, 2022). Rainfall and low wind speeds for microwave radiometers also affect the accuracy of wind field inversion (Yamamoto et al., 2017). The new International Comprehensive Ocean-Atmosphere Data Set incorporates wind data from various sources, including ships, moored and drifting buoys, and fixed platforms. However, errors and biases may emerge during the observation and transmission processes, particularly in ship observations. Despite a gradual increase in the number of ship observations, the monthly number of in-situ reports from ships remains substantially lower than that from drifting and mooring buoys (Liu et al., 2022). Buoy observations are limited to the near-surface (Santos et al., 2021; Majumder et al., 2022). While reanalysis data provide global wind field information at different altitude layers, their spatial and temporal resolutions are limited, and their accuracy is relatively low in open-ocean regions with scarce measurement data (Weissmann et al., 2005; Bhagavathiammal et al., 2020).
In recent years, CDL has emerged as a powerful tool to measure the refined wind field in the lower troposphere atmosphere due to its high accuracy and spatial and temporal resolutions under varying weather conditions. Carrying CDL on dynamic platforms, such as buoys, aircraft, and ships, is easy due to its small size, facilitating the detection of atmospheric wind profiles even in remote and open-ocean regions. However, buoys can only carry a small CDL, providing measurements of offshore wind within 0 – 100 m observations due to space constraints (Hsuan et al., 2014; Gaudet et al., 2022). Melfi et al. (1985) initially studied airborne CDL systems on the boundary layer, with similar work conducted in various locations (Atlas et al., 1986; Cosma-Averseng et al., 2003; Pu et al., 2010). Airborne observations are expensive and cannot be used for long-term continuous observation. Thus, the shipborne CDL was developed by collaborators from the Air-Sea Interactions Group of the Environmental Technology Laboratory of the National Oceanic and Atmospheric Administration and the Woods Hole Oceanographic Institution in 1996 to provide a reasonable CDL measurement system for installation on ships (Fairall et al., 1996). Shipborne CDL measurements of in-situ wind profile fields have been used in the research on the Pacific and Atlantic Oceans (Wulfmeyer and Janjić, 2005; Pichugina et al., 2017), while fewer experiments have been conducted in the Indian Ocean.
This paper aims to analyze the characteristics of LLJs in the eastern tropical Indian Ocean region using CDL observation and evaluate ERA5 reanalysis data. The paper is structured as follows. Section 2 provides a detailed description of the data and methodology used in the study. Section 3 presents the results and discussions. Finally, Section 4 summarizes the findings.
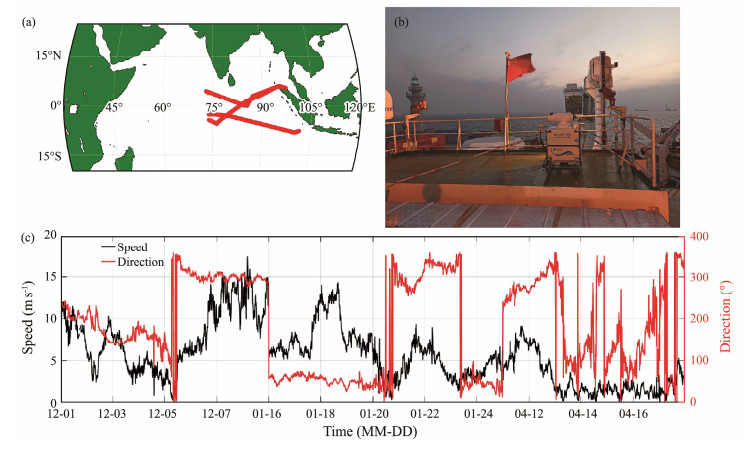
2 Data and Methodology 2.1 Equipment IntroductionIn the winter of 2021, the First Institute of Oceanography, Ministry of Natural Resources, conducted a comprehensive survey in the tropical Indian Ocean using the research vessel Xiangyanghong 01. Fig.1a shows the cruise track. The vessel is equipped with a Wind3D 10K 3D scanning Doppler wind lidar (CDL) (Fig.1b), which is jointly developed by the Ocean University of China and Qingdao Leice Transient Technology Co. Ltd.. Fig.1c shows the wind speed and direction at an altitude of 600 m observed by CDL along the cruise track of the research vessel. The CDL observes the wind parameters during the cruise over the open-ocean region. Table 1 provides the technical parameters of the CDL.
|
Fig. 1 Cruise track of the research vessel (a). CDL on board (b) and the wind speeds and directions at 600 m along the cruise track (c). |
|
|
Table 1 Technical parameters of Wind3D 10K (CDL) |
The research vessel is a nonstable platform, inducing the deviation of the laser beam pointing from the set direction during LIDAR measurement. Moreover, the motion speed of the research vessel will be superimposed onto the measured radial speed, resulting in an actual wind measurement error. Therefore, the impact of the sailing altitude of the research vessel cannot be overlooked, and raw data require altitude correction. The GPS records the position information of the research vessel, including longitude, latitude, and altitude, as well as its speed of movement. The inertial navigation system captures the research vessel's altitude, and the altitude angle of the vehicle platform includes roll, pitch, and heading. The servo system of the LIDAR records the pitch and azimuth of the lidar system. Real-time calculations can eliminate the radial component caused by the moving platform from the measured radial wind speed, obtaining corrected radial wind speed and then inverting the horizontal wind speed and direction.
2.2 Criterion of Judging LLJsLIDAR has used the wind profile observation mode (Doppler Beam Swinging or multibeam scanning) during the observation period to obtain high-altitude wind field information continuously and stably. The laser transmitting system sends beams in five directions (east, south, west, north, and vertical) into the atmosphere. These beams collect radial wind speed and direction data in the five directions, which are then inverted to obtain horizontal wind speed and direction information at different heights. This study adopts the definition of LLJs used by Bonner (1968) and Wei et al. (2013). The first criterion is the maximum wind speed (Vmax), which establishes the threshold value. The second criterion is the maximum difference (ΔV) between Vmax and either the minimum wind speed (Vmin) or the wind speed at 3 km height (V3km), regardless of wind direction. Based on these criteria, LLJs are classified into four categories: LLJ-1 (Vmax ≥ 6 m s−1 and ΔV ≥ 3 m s−1), LLJ-2 (Vmax ≥ 10 m s−1 and ΔV ≥ 5 m s−1), LLJ-3 (Vmax ≥ 14 m s−1 and ΔV ≥ 7 m s−1), and LLJ-4 (Vmax ≥ 20 m s−1 and ΔV ≥ 10 m s−1).
2.3 Radiosonde DataThe radiosonde data were recorded up to three times per day (05, 11, and 23 UTC) and covered the periods December 1 – 8, 2021, January 16 – 24, 2022, and April 11 – 17, 2022. Radiosondes were deployed during the cruise to verify the CDL measurements. CDL captures wind profiles at all height layers with a temporal resolution of approximately 6 s, while radiosondes are measured at different times and locations. Radiosondes take approximately 10 min to rise to 3 km and drift several kilometers away from the original site. Wind measurements between CDL and radiosondes can reveal significant discrepancies due to these differences, particularly in situations where the atmosphere is nonuniform, and the ship is not sailing steadily. Radiosonde measurements are used in this study as the standard to validate CDL monitoring and obtain the systematic deviation of wind measurements.
2.4 ERA5 DataThe fifth-generation global atmospheric reanalysis dataset produced by the European Center for Medium-Range Weather Forecasts, ERA5, is one of the most extensively used reanalysis datasets globally. ERA5 is a state-of-the-art global climate and weather reanalysis product employing the integrated 4D-VAR data assimilation system. The system offers additional product parameters and drastically improved horizontal and vertical resolutions (Dee et al., 2011). Zonal and meridional wind data from the ERA5 dataset are used in this study. The hourly data on pressure levels from 1959 to the present with a spatial resolution of 0.25˚ × 0.25˚, a height of 12 layers (1000 – 700 hPa), and the voyage time of the research vessel in the Eastern Indian Ocean (December 1 – 8, 2021, January 16 – 24, 2022, and April 11 – 17, 2022) are utilized to facilitate comparison with CDL observations. The zonal and meridional wind data are interpolated to the height of the CDL prior to comparisons with the CDL data. The nearest wind profile close to the research vessel is then selected based on the latitude and longitude locations. NCEP data are also utilized to examine the wind field in the study area, which presents similar results compared with ERA5. Only ERA5 data are used in this study for further analysis.
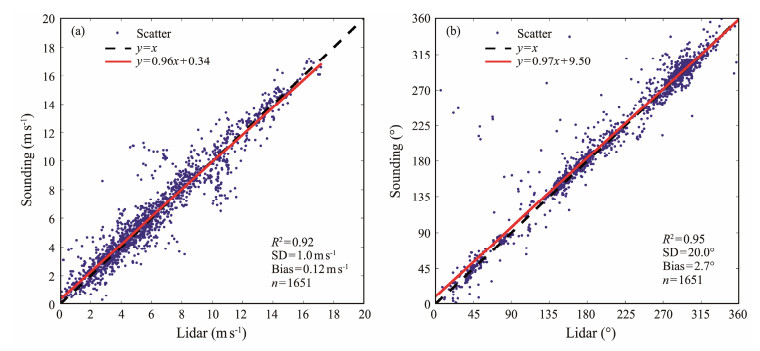
3 Results 3.1 Validation of CDL MeasurementsFigs.2a and 2b demonstrate the scatter plots of wind speed and direction measurements obtained from CDL and radiosonde, respectively, during the cruise. The statistical evaluations of bias, SD, and R2 are employed to assess the accuracy of wind speed and direction. The majority of samples are near the diagonal, indicating a strong correlation between radiosonde and CDL measurements. The results show that the R2, SD, and bias for wind speed are 0.92, 1.0 m s−1, and 0.12 m s−1, respectively, indicating reasonable consistency between CDL and radiosonde data. The wind direction obtained from CDL is also similar to that of radiosonde, with R2, SD, and bias values of 0.95, 20.0˚, and 2.7˚, respectively. Despite the discrepancies, wind data from both methods are highly consistent, confirming the reliability of CDL wind profiles in explaining the features of LLJs.
|
Fig. 2 Scatter plots between CDL observations and radiosonde measurements for wind speed (a) and wind direction (b) in the eastern Indian Ocean. The sounding measurements are interpolated to the detected heights of wind profiles. Linear regression and 1:1 ratio lines are indicated as red and black dashed lines, respectively. The plots provide the determination coefficient (R2), standard deviation (SD), and bias. |
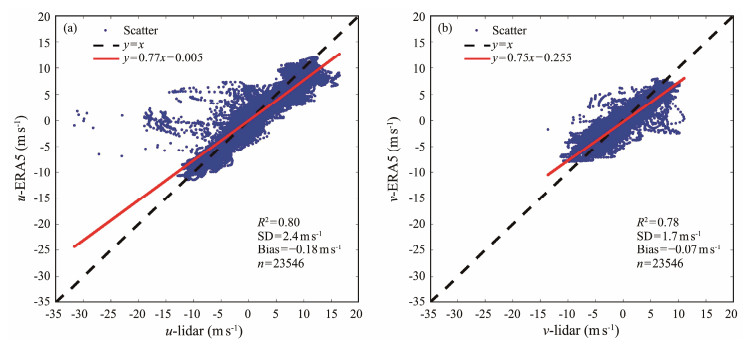
ERA5 data from the observation period, which are consistent with the effective observation altitude of the lidar below 3 km, are selected for comparison with CDL measurements. Fig.3 shows the comparison between ERA5 and CDL observations for zonal and meridional wind, which analyzed 23546 samples. The results of zonal wind show R2 of 0.80, SD of 2.4 m s−1, and bias of −0.18 m s−1, while the results of meridional wind show R2 of 0.78, SD of 1.7 m s−1, and bias of −0.07 m s−1. The discrepancy between ERA5 and CDL is substantial in terms of the zonal wind, revealing the bias of ERA5 toward reproducing easterly winds. Particularly, CDL observations show easterly winds, while ERA5 indicates westerly winds. Though still questionable, the performance of ERA5 is better for the meridional wind compared to CDL data.
|
Fig. 3 Similar to Fig. 2 but with the variables from ERA5 and CDL measurements for zonal wind (a) and meridional wind (b). |
In this study, the wind field data from CDL include 10-minute average wind profiles from the sea surface to 3 km, where LLJs are typically located. Table 2 provides the statistical results for the number of wind profiles corresponding to the four types of LLJs based on observations from December 1 – 8, 2021, January 16 – 24, 2022, and April 11 – 17, 2022. A total of 3444 wind profiles, including 2583 without LLJs, 566 with LLJ-1, 219 with LLJ-2, and 76 with LLJ-3, are observed. However, LLJ-4 is not examined during the study period.
|
|
Table 2 Criteria and occurrence of LLJs |
The LLJ characteristics include strength, height, and direction; these parameters refer to the layer where maximum wind speed is observed. Statistical analysis is performed separately for wind profiles and compared to ERA5 to examine structural features.
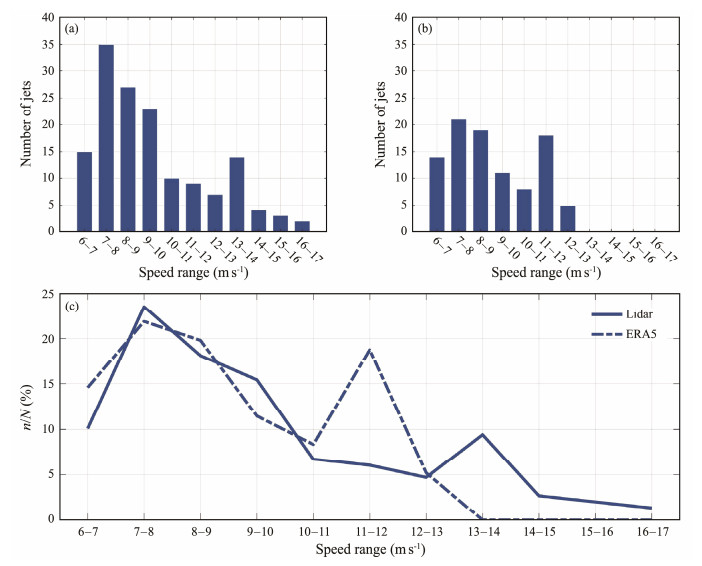
Fig.4 presents the distribution of the number and probability of LLJs at different wind speeds for CDL observations and ERA5 data. The CDL results indicate that the strength of LLJs is primarily within the range of 6 – 10 m s−1, in which the highest number of LLJs is observed in the 7 – 8 and 8 – 9 m s−1 sections, accounting for 41.6% and 62 signals, respectively. The number of LLJs in the 6 – 7 m s−1 and 9 – 10 m s−1 sections reached 25.5% and 38 signals, respectively. However, the number of LLJs per group rapidly decreases to 10 and below when their strength exceeds 10 m s−1. By contrast, the strength of LLJs in ERA5 exhibits a different and complex pattern. These jets share the same variation characteristics in the low speed range. However, the maximum number of LLJs is found within the 7 – 8 m s−1 range, which is lower than the CDL observation with 22 signals but approximately consistent. The number of LLJs generally decreases as the wind speed range increases from 9 m s−1 to 13 m s−1. However, a rapid increase is observed from 11 m s−1 to 12 m s−1, reaching 18.8%. Surprisingly, no LLJs are observed when the maximum wind speed exceeds 13 m s−1 in ERA5. CDL observations identify three types of LLJs based on their strength: LLJ-1, LLJ-2, and LLJ-3, with LLJ-1 being widely observed, followed by LLJ-2 and LLJ-3. By contrast, ERA5 data only identify LLJ-1 and LLJ-2 without LLJ-3. These observations suggest that ERA5 can accurately reproduce LLJs under low wind speed conditions but struggle to depict the features of LLJs at high wind speed stations. Hence, ERA5 generally underestimates the strength of LLJs during this study.
|
Fig. 4 Occurrence number of LLJs during the cruise ((a), CDL; (b), ERA5) and the distribution of the probability for different wind speeds between CDL observations and ERA5 data (c). |
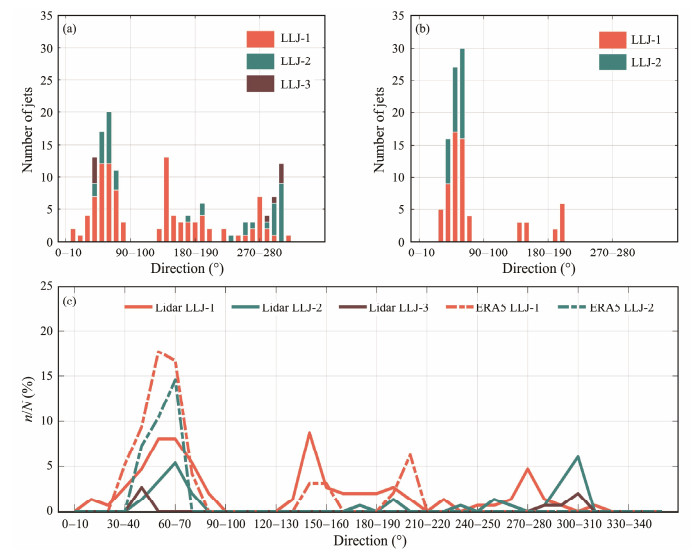
Fig.5 shows the wind direction distribution of CDL and ERA5, demonstrating a combined probability of 47.7% and 85.4% in the northeast direction, respectively. CDL data reveal a wide range of wind directions, demonstrating the main concentration of LLJs in the 40˚ – 80˚ direction. Meanwhile, the number of LLJs in other directions, such as east – southeast and northwest, is particularly low. LLJ-2 demonstrates the highest number of LLJs in the northeast direction, and LLJ-3 is only distributed in the northeast and northwest directions with a combined probability of 6.0%. By contrast, the LLJs in ERA5 are distributed in the 30˚ – 80˚, 140˚ – 160˚, and 190˚ – 210˚ directions, revealing a high concentration in the 40˚ – 70˚ direction. Examination results of wind speed and direction revealed that the wind speed calculated by ERA5 is markedly lower than that measured by CDL, displaying significantly underestimated wind speed in the northwest direction.
|
Fig. 5 Occurrence number of LLJs for wind direction ((a), CDL; (b), ERA5) and the distribution of the probability for different wind directions between CDL observations and ERA5 data (c). |
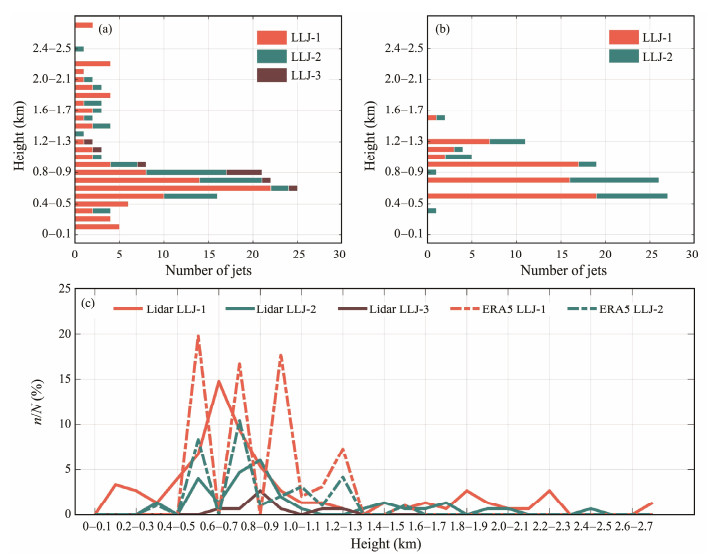
CDL observations in Fig.6 revealed that the majority of LLJs are concentrated between altitudes of 0.5 – 1 km, accounting for 61.7% of all LLJs. This value is the highest number observed at 0.6 – 0.7 km, accounting for 16.8%. LLJ-2 and LLJ-3 also have higher concentrations within this altitude range compared with other altitudes, and the number of LLJs below 0.6 km is slightly larger than those above 1 km. The highest recorded height of LLJs is 2.7 km, accounting for 1.3% of all LLJs. However, ERA5 data fail to obtain LLJ signals below 0.3 km and beyond 1.6 km, and the majority of LLJs is distributed between altitudes of 0.5 – 0.6, 0.7 – 0.8, and 0.9 – 1 km, accounting for 28.1%, 27.1%, and 19.8% of all LLJs, respectively. By contrast, the number of LLJs at a height of 1.2 – 1.3 km rapidly increases in ERA5 data, which differs from CDL observations.
|
Fig. 6 Occurrence number of LLJs in height ((a), CDL; (b), ERA5) and the distribution of the probability between CDL observations and ERA5 data (c). |
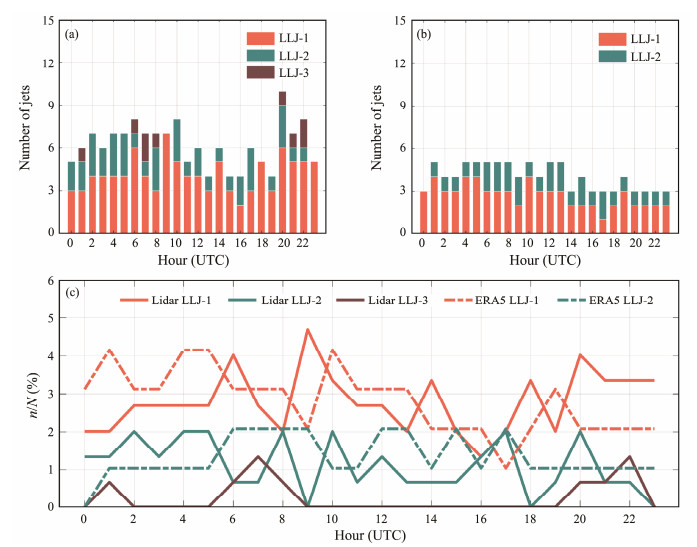
CDL observations in Fig.7 revealed that LLJs are observed throughout the day, with the highest and lowest numbers occurring around 2000 and 1600 UTC, respectively. This observation is different from the single-peak feature of LLJs detected in land or offshore areas. Moreover, LLJs exhibit large fluctuations within the 24-hour period, revealing the absence of LLJ-3 from 10 to 19 UTC. However, ERA5 data show a descending trend for the number of LLJ-1, with the largest number occurring in the morning. In comparison to CDL observations, ERA5 underestimates the number and strength of LLJs throughout the day.
|
Fig. 7 Diurnal variation of different categories of LLJ occurrences ((a), CDL; (b), ERA5) and the distribution of the probability between CDL observations and ERA5 data (c). |
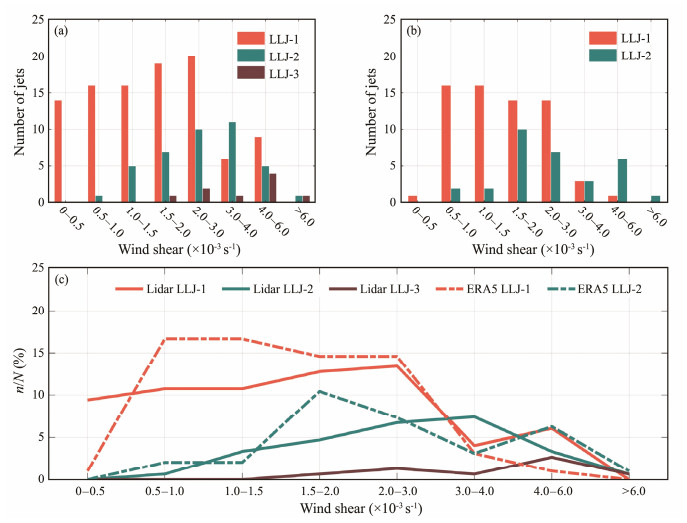
The wind shear (the difference in wind speed between the recorded height of the first CDL measurement and the LLJ altitude) of LLJs demonstrates a variation range of approximately 0 to 0.006 s−1 in Fig.8, while that near Shanghai, China, is mostly between 0.014 and 0.019 s−1 (Wei et al., 2013), which is substantially higher than the shear in the open ocean. This finding suggests that the vertical variation of wind in open-ocean areas is slightly pronounced compared with that of inland or offshore areas due to the low frictional drag on the ocean surface. The wind shear of LLJ-1 based on CDL is the largest, demonstrating concentrations within the range of 0 – 0.003 s−1. The number of LLJs decreases as the wind shear value increases. The number of LLJs corresponding to LLJ-2 is roughly Gaussian-like distributed: the maximum number of LLJs corresponds to a wind shear range of 0.002 – 0.003 s−1, and the lowest number of LLJs occurs where wind shear is below 0.001 s−1. The number for LLJ-3 corresponds to a wind shear range larger than 0.001 s−1, with the highest number of LLJs corresponding to a wind shear range of 0.004 – 0.006 s−1. Notably, LLJs with high strength may display strong wind shear. By contrast, the wind shear of LLJ-1 in ERA5 is mainly concentrated between 0.0005 and 0.003 s−1, demonstrating a rapid decrease in the number of LLJs greater than 0.003 s−1. Different from CDL observations, the wind shear range of 0 – 0.0005 s−1 corresponds to a substantially low number of LLJs, which may be attributed to the underestimated wind speed by ERA5.
|
Fig. 8 Occurrence number of LLJs in terms of wind shear ((a), CDL; (b), ERA5) and the distribution of the probability between CDL observations and ERA5 data (c). |
The wind field in the open ocean in the tropical Indian Ocean is underestimated by ERA5 reanalysis data, particularly in terms of its vertical distribution. This unrealistic wind in reanalysis data may introduce uncertainties in air-sea flux estimation and air-sea interaction studies. Previous research has shown that the climatological latent heat flux can be affected by latent heat flux-related variables (Wu et al., 2016; Wu et al., 2020b). Wu et al. (2020b) found that sea surface wind is crucial in the estimation of climatological latent heat flux in the tropical Indian Ocean and western Pacific regions. Yan et al. (2022) also demonstrated that high-frequency winds positively contribute to the annual climatology of latent heat flux. Thus, they suggested that an improvement in the performance of sub-daily wind variability is necessary to increase the accuracy of reanalysis products.
At the interannual time scale, the Indian Ocean Dipole (IOD) is a significant air-sea coupling event that plays a dominant role in local marine environments and climate systems. One of the notable features of the IOD is the phase-locking phenomenon, where these events rapidly develop in boreal summer and reach the mature phase in boreal fall. Previous studies have shown that positive and negative dynamical and thermodynamic feedback mechanisms, including the Bjerknes feedback, are responsible for the evolution of IOD events (Li et al., 2003). The Bjerknes feedback refers to a decrease in the zonal SST gradient (caused, for instance, by a relaxation of the thermocline tilt), indicating that a reduction in the zonal wind stress will amplify the initial perturbation. Wind is a crucial index for the estimation of the Bjerknes feedback. Liu et al. (2011, 2014) performed a comprehensive assessment of the simulated Bjerknes feedback during IOD events based on CMIP models. However, the uncertainties attributed to reanalysis data were ignored. In this study, the observation from CDL reveals the disadvantage of reanalysis data over the eastern Indian Ocean, which may introduce uncertainties into studies related to the IOD and its remote influence.
5 ConclusionsA three-dimensional wind field analysis is conducted in this study during an eastern Indian Ocean cruise using shipboard CDL and ERA5 reanalysis data. The determination coefficients for wind speed and direction from CDL on the moving platform and radiosonde are highly consistent, demonstrating values of 0.92 and 0.95, respectively. This finding indicates the credibility of detection results measured from the moving platform. However, significant deviations are observed between the horizontal wind in the ERA5 reanalysis data and the CDL. In particular, the zonal wind is significantly underestimated in the open-ocean regions in ERA5 data.
The features of LLJs in the eastern Indian Ocean are analyzed using CDL measurements. The CDL observations reveal numerous LLJs in the study region during the boreal winter season, demonstrating a peak occurrence in January. Among the three types of analyzed LLJs, LLJ-1, which is the weakest type, occurs most frequently. The wind direction of LLJs is mainly concentrated between 40˚ and 80˚, while the height of LLJs is focused on the 0.6 km range. The wind shear of LLJs is concentrated in the low-value range of 0 – 0.006 s−1. Diurnal variations of LLJs are observed, revealing peaks at 0600 and 2000. This daily variation is notably different from the single-peak variation characteristic of LLJs in ERA5.
Compared with CDL measurements, ERA5 substantially underestimates the occurrence of LLJs in the tropical eastern Indian Ocean region, which may generate system bias for research relying on ERA5 data. However, the duration of observations using CDL in this study is limited to the cruise track. Thus, whether the obtained results in this study are representative of the entire region or applicable only for that particular year remains unclear. Therefore, further in-situ observations are necessary to identify the general characteristics of LLJs in the tropical Indian Ocean region.
AcknowledgementsThis work was supported by the Taishan Scholars Programs of Shandong Province (No. tsqn201909165), the Global Change and Air-Sea Interaction Program (Nos. GASI-04-QYQH-03, GASI-01-WIND-STwin), and the National Natural Science Foundation of China (Nos. 41876028, 42349910).
Atlas, D., Walter, B., Chou, S. H., and Sheu, P. J., 1986. The structure of the unstable marine boundary layer viewed by lidar and aircraft observations. Journal of the Atmospheric Sciences, 43(13): 1301-1318. DOI:10.1175/1520-0469(1986)043<1301:TSOTUM>2.0.CO;2 (  0) 0) |
Bhagavathiammal, G. J., Manohar, L., and Emperumal, K., 2020. Observational evidence of equatorial ionospheric response to severe cyclonic storms 'AILA' and 'WARD' observed over the North Indian Ocean. Journal of Atmospheric and Solar-Terrestrial Physics, 211: 105462. DOI:10.1016/j.jastp.2020.105462 (  0) 0) |
Bonner, W. D., 1968. Climatology of the low-level jet. Monthly Weather Review, 96: 833-850. DOI:10.1175/1520-0493(1968)096<0833:COTLLJ>2.0.CO;2 (  0) 0) |
Bunker, A. F., 1965. Interaction of the summer monsoon air with the Arabian Sea, '(Preliminary analysis)'. Proceedings of the Symposium on Meteorological Results of the International Indian Ocean Expedition. Bombay, 22-26.
(  0) 0) |
Cosma-Averseng, S., Flamant, C., and Pelon, J., 2003. The cloudy atmospheric boundary layer over the subtropical South Atlantic Ocean: Airborne-spaceborne lidar observations and numerical simulations. Journal of Geophysical Research, 108(D7): 4220. (  0) 0) |
Dee, D. P., Uppala, S. M., Simmons, A. J., Berrisford, P., Kobayashi, S., Andrae, U., et al., 2011. The ERA-interim reanalysis: Configuration and performance of the data assimilation system. Quarterly Journal of the Royal Meteorological Society, 137(656): 553-597. DOI:10.1002/qj.828 (  0) 0) |
Draper, D. W., and Long, D. G., 2002. An assessment of SeaWinds on QuikSCAT wind retrieval. Journal of Geophysical Research, 107(C12): 3212. DOI:10.1029/2002JC001330 (  0) 0) |
Fairall, C. W., White, A. B., Edson, J. B., and Hare, J. E., 1996. Integrated shipboard measurements of the marine boundary layer. Journal of Atmospheric and Oceanic Technology, 14: 338-359. (  0) 0) |
Findlater, J., 1977. Observational aspects of the low-level cross-equatorial jet stream of the western Indian Ocean. Pageoph, 115: 1251-1262. DOI:10.1007/BF00874408 (  0) 0) |
Gaudet, B. J., Medina, G. G., Krishnamurthy, R., Shaw, W. J., Sheridan, L. M., Yang, Z., et al., 2022. Evaluation of coupled wind-wave model simulations of offshore winds in the mid-Atlantic bight using lidar-equipped buoys. Monthly Weather Review, 150: 1377-1395. (  0) 0) |
Hart, J. E., 1977. On the theory of the East African low level jet stream. Pageoph, 115: 1263-1282. DOI:10.1007/BF00874409 (  0) 0) |
Hsuan, C. Y., Tasi, Y. S., Ke, J. H., Prahmana, R. A., Chen, K. J., and Lin, T. H., 2014. Validation and measurements of floating LiDAR for nearshore wind resource assessment application. Energy Procedia, 61: 1699-1702. DOI:10.1016/j.egypro.2014.12.195 (  0) 0) |
Jalihal, C., Srinivasan, J., and Chakraborty, A., 2022. Response of the low-level jet to precession and its implications for proxies of the Indian monsoon. Geophysical Research Letters, 49: e2021GL094760. DOI:10.1029/2021GL094760 (  0) 0) |
Jiménez-Sánchez, G., Markowski, P. M., Young, G. S., and Stensrud, D. J., 2020. The Orinoco low-level jet: Aninvestigation of its mechanisms offormation using the WRF model. Journal of Geophysical Research: Atmospheres, 125: e2020JD03281. (  0) 0) |
Joseph, P. V., and Sijikumar, S., 2004. Intraseasonal variability of the low-level jet stream of the Asian summer monsoon. Journal of Climate, 17: 1449-1458. DOI:10.1175/1520-0442(2004)017<1449:IVOTLJ>2.0.CO;2 (  0) 0) |
Joseph, P. V., and Raman, P. L., 1966. Existence of low level westerly jet-stream over peninsular India during July. Indian Journal of Meteorology and Geophysics, 17: 407-410. (  0) 0) |
Kerns, B. W., and Chen, S. S., 2018. Evaluation of satellite surface winds in relation to weather regimes over the Indian Ocean using DYNAMO observations. Journal of Geophysical Research: Atmospheres, 123: 8561-8580. DOI:10.1029/2018JD028292 (  0) 0) |
Li, T., Wang, B., Chang, C. P., and Zhang, Y., 2003. A theory for the Indian Ocean dipole-zonal mode. Journal of the Atmospheric Sciences, 60: 2119-2135. DOI:10.1175/1520-0469(2003)060<2119:ATFTIO>2.0.CO;2 (  0) 0) |
Liu, C. Y., Freeman, E., Kent, E. C., Berry, D. I., Worley, S. J., Smith, S. R., et al., 2022. Blending TAC and BUFR marine in situ data for ICOADS Near-Real-Time Release 3. 0. 2. Journal of Atmospheric and Oceanic Technology, 39: 1943-1959. DOI:10.1175/JTECH-D-21-0182.1 (  0) 0) |
Liu, L., Yu, W. D., and Li, T., 2011. Dynamic and thermodynamic air-sea coupling associated with the Indian Ocean Dipole diagnosed from 23 WCRP CMIP3 models. Journal of Climate, 24: 4941-4958. DOI:10.1175/2011JCLI4041.1 (  0) 0) |
Liu, L., Xie, S. P., Zheng, X. T., Li, T., Du, Y., Huang, G., et al., 2014. Indian Ocean variability in the CMIP5 multi-model ensemble: The zonal dipole mode. Climate Dynamics, 43: 1715-1730. DOI:10.1007/s00382-013-2000-9 (  0) 0) |
Majumder, S., Remya, P. G., Balakrishnan Nair, T. M., and Sirisha, P., 2022. Analysis of meteorological and oceanic conditions during freak wave events in the Indian Ocean. Ocean Engineering, 259: 111920. DOI:10.1016/j.oceaneng.2022.111920 (  0) 0) |
Melfi, S. H., Spinhirne, J. D., Chou, S. H., and Palm, S. P., 1985. Lidar observations of vertically organized convection in the planetary boundary layer over the ocean. Journal of Climate and Applied Meteorology, 24: 806-821. DOI:10.1175/1520-0450(1985)024<0806:LOOVOC>2.0.CO;2 (  0) 0) |
Miao, Y. C., Guo, J. P., Liu, S. H., Wei, W., Zhang, G., Lin, Y. L., et al., 2018. The climatology of low-level jet in Beijing and Guangzhou, China. Journal of Geophysical Research: Atmospheres, 123: 2816-2830. DOI:10.1002/2017JD027321 (  0) 0) |
Nie, C., and Long, D. G., 2007. A C-band wind/rain backscatter model. IEEE Transactions on Geoscience and Remote Sensing, 45(3): 621-631. DOI:10.1109/TGRS.2006.888457 (  0) 0) |
Pichugina, Y. L., Banta, R. M., Olson, J. B., Carley, J. R., Marquis, M. C., Brewer, W. A., et al., 2017. Assessment of NWP forecast models in simulating offshore winds through the lower boundary layer by measurements from a ship-based scanning Doppler lidar. Monthly Weather Review, 145: 4277-4301. DOI:10.1175/MWR-D-16-0442.1 (  0) 0) |
Pu, Z. X., Zhang, L., and Emmitt, G. D., 2010. Impact of airborne Doppler wind lidar profiles on numerical simulations of a tropical cyclone. Geophysical Research Letters, 37: L05801. (  0) 0) |
Ruchith, R. D., Raj, P. E., Kalapureddy, M. C. R., Deshpande, S. M., and Dani, K. K., 2014. Time evolution of monsoon low-level jet observed over an Indian tropical station during the peak monsoon period from high-resolution Doppler wind lidar measurements. Journal of Geophysical Research: Atmospheres, 119: 1786-1795. DOI:10.1002/2013JD020752 (  0) 0) |
Santos, J. V. C., Perini, N. B., Moret, M. A., Nascimento, E. G. S., and Moreira, D. M., 2021. Scaling behavior of wind speed in the coast of Brazil and the South Atlantic Ocean: The crossover phenomenon. Energy, 217: 119413. DOI:10.1016/j.energy.2020.119413 (  0) 0) |
Shi, Q., and Wang, G. H., 2022. Satellite observed quick shift events of the wind jet over the South China Sea in summer and its impacts on the ocean circulation. Remote Sensing of Environment, 276: 113039. DOI:10.1016/j.rse.2022.113039 (  0) 0) |
Stensrud, D., 1996. Importance of low-level jets to climate: A review. Journal of Climate, 9(8): 1698-1711. DOI:10.1175/1520-0442(1996)009<1698:IOLLJT>2.0.CO;2 (  0) 0) |
Tao, Z. Y., 1989. Analysis of Indian monsoon and associated low-level circulation in 1980 and 1981. Advances in Atmospheric Sciences, 6(1): 113-119. DOI:10.1007/BF02656922 (  0) 0) |
Wei, W., Wu, B. G., Ye, X. X., Wang, H. X., and Zhang, H. S., 2013. Characteristics and mechanisms of low-level jets in the Yangtze River Delta of China. Boundary-Layer Meteorology, 149: 403-424. DOI:10.1007/s10546-013-9852-8 (  0) 0) |
Weissmann, M., Busen, R., Dörnbrack, A., Rahm, S., and Reitebuch, O., 2005. Targeted observations with an airborne wind lidar. Journal of Atmospheric and Oceanic Technology, 22: 1706-1719. DOI:10.1175/JTECH1801.1 (  0) 0) |
Webster, P. J., and Hoyos, C., 2004. Prediction of monsoon rainfall and river discharge on 1530 day time scales. Bulletin of the American Meteorological Society, 85(11): 1745-1765. DOI:10.1175/BAMS-85-11-1745 (  0) 0) |
Wu, B. G., Li, Z. F., Ju, T. T., and Zhang, H. S., 2020a. Characteristics of low-level jets during 2015 – 2016 and the effect on fog in Tianjin. Atmospheric Research, 245: 105102. DOI:10.1016/j.atmosres.2020.105102 (  0) 0) |
Wu, R., Wang, Y., and Jiao, Y., 2020b. High frequency wind-related seasonal mean latent heat flux changes. Climate Dynamics, 55: 3269-3287. DOI:10.1007/s00382-020-05445-6 (  0) 0) |
Wu, Y., Zhai, X. M., and Wang, Z. M., 2016. Impact of synoptic atmospheric forcing on the mean ocean circulation. Journal of Climate, 29(16): 5709-5724. DOI:10.1175/JCLI-D-15-0819.1 (  0) 0) |
Wulfmeyer, V., and Janjić, T., 2005. Twenty-four-hour observations of the marine boundary layer using shipborne NOAA high-resolution Doppler lidar. Journal of Applied Meteorology, 44: 1723-1744. DOI:10.1175/JAM2296.1 (  0) 0) |
Yamamoto, M. K., Tanaka, I., and Shige, S., 2017. Improvement of the rain/no-rain classification method for microwave radiometers over the Tibetan Plateau. IEEE Geoscience and Remote Sensing Letters, 14(5): 626-630. DOI:10.1109/LGRS.2017.2666814 (  0) 0) |
Yan, Y., Cai, X. H., Wang, X. S., Miao, Y. C., and Song, Y., 2021. Low-level jet climatology of China derived from longterm radiosonde observations. Journal of Geophysical Research: Atmospheres, 126: e2021JD035323. DOI:10.1029/2021JD035323 (  0) 0) |
Yan, Y. W., Song, X. Z., Wang, G. H., and Chen, C. L., 2022. Importance of high-frequency (≤ 30-day) wind variability to the annual climatology of the surface latent heat flux inferred from the global tropical moored buoy array. Journal of Geophysical Research: Oceans, 127: e2021JC018094. DOI:10.1029/2021JC018094 (  0) 0) |
 2024, Vol. 23


