2) University of Chinese Academy of Sciences, Beijing 100049, China;
3) College of Geophysics, Chengdu University of Technology, Chengdu 610059, China;
4) CNOOC China Limited, Zhanjiang Branch, Zhanjiang 524057, China;
5) State Key Laboratory of Natural Gas Hydrate, CNOOC Research Institute Company Limited, Beijing 100028, China
With the considerable advancement in marine geophysical techniques in recent years, several submarine landslides have been identified in petroliferous basins in the northern part of the South China Sea (Ma et al., 2012; Terry et al., 2017). Thus, the development of these resources requires in-depth study of potential geological hazards.
Tectonic activity is one of the major driving forces shaping the earth. It causes earthquakes and possibly slope instability either in subaerial or submarine environments. For example, slope instability on continental slopes is accompanied by mass movement and potential disasters, such as tsunamis (Watts and Grilli, 2003; Nadim and Kvalstad, 2007; Jeong et al., 2013), which damage marine facilities (e.g., submarine cables, pipelines, cables, and drilling platforms) and nearshore personnel and properties. Therefore, the stability analysis of submarine slopes has become increasingly important for the risk assessment of coastal cities and marine engineering as well as marine resource exploration, which is currently one of the focuses of marine science (Abrams, 2017; Wu et al., 2018b).
The present seabed topography has been detailed, imaged, and displayed by advanced geophysical methods over decades. Therefore, topographic data of the present seabed have been extensively used for studies on submarine landslides considering geomorphological characteristics (Horozal et al., 2017), calculation of landslide volume (Hance, 2003), evaluation of slope stability (Hance, 2003; Biscontin et al., 2004; Leynaud et al., 2004; Sultan et al., 2004; Masson et al., 2006; He et al., 2014), and tsunami generation (Heller et al., 2016; Pampell-Manis et al., 2016). At present, the analysis of submarine slope stability is mainly based on a 2D model or a simplified 3D model using various methods, such as the limit equilibrium method, the strength reduction method (Duncan, 2000), the probability method (Rahman and Jaber, 1991; Strupler et al., 2017), and the numerical simulation method (Grilli et al., 2009; Rasyif et al., 2016). However, as one of the main controls of slope stability, seabed topography has been underestimated, and only a few studies have been conducted on the relationship between the morphological characteristics of seabed topography and slope stability.
The Qiongdongnan Basin is rich in oil and natural gas hydrate, and therefore is an important exploration matter. This basin is characterized by a steep continental slope comprising low-strength sediments and is prone to instability, which may damage marine engineering and even cause major disasters, such as platform overturns.
Submarine canyons (Wonham et al., 2000; Harris et al., 2013; Liu et al., 2015) have a complex topography. Many submarine disasters occur in the submarine cannon area. When an offshore oil and gas development project is located in the area, studying the geological safety of the subject is necessary.
Based on 3D seabed topography created by high-resolution 3D seismic data, a topographic model is established by Python programming, and thick soft seabed sediment is used for multiple iterations of stress balance, contrast static, and dynamic instability to calculate the position and size of the potential area to analyze the slope stability of an oil well site and locate potential instability areas. A potential relationship between the morphological characteristics of seabed topography and slope stability is also explored.
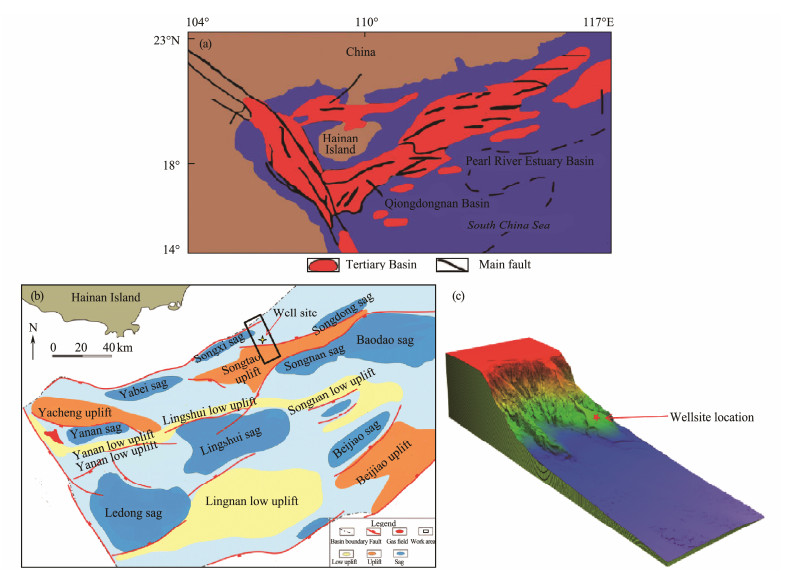
2 Geological and Physiographical Background of the Slope in the Qiongdongnan BasinThe northern waters of the South China Sea are affected by the interaction of the Eurasian, Pacific, and Indian Plates. Moreover, tectonic activities are complex, the ravines are vertical and horizontal, and the topography is undulating. The location and the physiographic research target area are located on the Qiongdongnan continental shelf extending to the north of the Xisha Trough, with a length of 31 km and a width of 10 km. The water depths in the western and southeast regions are the shallowest and deepest, respectively. At 18˚03΄N, 110˚57΄E, the water depth ranges from 178 m to 1760 m, and the slope is approximately 0˚ – 45˚. The main geomorphic units are two submarine uplifts and ten sea channel gullies (Fig. 1).
|
Fig. 1 Tectonic division of the Qiongdongnan Basin and geomorphology of the location of the study area. (a), structural map of the northern part of the South China Sea, including major faults and basin locations; (b), uplift and depression topography and geomorphology of the Qiongdongnan Basin and location of the study area (Wu et al., 2018a); (c), three-dimensional geological model of the study area and location of the well site. |
The northern continental shelf of the South China Sea, except that of the southeastern Hainan Island, is relatively narrow, whereas other parts are wide. The edge slope of the continental shelf varies in water depth; the edge slope at southeastern Hainan Island has a water depth of 200 m, whereas the water depth of the continental shelf edge from Leizhou Bay to the upper and lower Chuan Island gradually decreases, that is, only 140–160m.
The northern marginal basin of the South China Sea is a part of the marginal trench-arc-basin system of the western Pacific Ocean. In the late Paleozoic to the early Mesozoic, the Indo-Sunda land region and the northern margin of the South China Sea were connected to the ancient Tethys Sea. In the early Jurassic and the early Cretaceous, the Tethys closed and contracted west to the north of the Pacific Plate drive, prompting subduction demise in the East Asian continent of Anji, uplifting and resulting in the development of giant magma-volcanic belts in the mainland on the edge southeast of the East Asia and the formation of the Andean type on the edge of the southeast Asia region (Li, 2011).
Since then, the movement speed of the northern Pacific Plate has decreased, the tectonic environment has changed from compression to extension, and the expansion of the South China Sea Basin in the Cretaceous and the South China block has occurred in the late Mesozoic. At the end of the Eocene, the entire continental slope area, including the area east of the Dongsha Islands, was generally uplifted and denuded, thus ending the early tectonic foundation laying stage. From the late Oligocene to the early Miocene, the eastern part of the South China Sea expanded again along the east-west direction, ending the period of continental shelf rifting in the northern part of the South China Sea. During this period, the rift valley gradually subsided from east to west from the Pearl River Estuary to the Qiongdongnan Basin, and the continental facies and sealand transition sedimentary sequence during the fault depression was formed accordingly (Zhan et al., 2001).
After the Miocene, the continental margin in the northern part of the South China Sea entered the stage of tectonic subsidence, forming regional deposits dominated by marine sediments.
The northern part of the South China Sea can be divided into the Yingqiong continental slope section, the Shenhu continental slope section, the Pearl River marine valley continental slope section, the Dongsha continental slope section, and the Taiwan shoal continental slope section from the west to the east in accordance with the trend of continental slopes, the geomorphic change from shallow to deep, and the variation trend of topographic contour lines.
3 Data and Methods 3.1 DataData included shallow seismic profiles, high-resolution multibeam bathymetry, and CPT collected by the CNOOC (China) Co., Ltd. The water well site investigation project report of the Zhanjiang Branch of the Songtao oil well site was provided by the Engineering Survey Operations Company of the Geophysical Prospecting Division of the CNOOC Oilfield Services Co., Ltd. The multibeam survey and JPC survey data were obtained for sampling, and AUV carries a water depth instrument, namely landform and stratigraphic profile survey instrument, to complete the original data collection. The AUV shallow profile survey uses an EdgeTech 2200-M shallow profile instrument with a frequency of 2 – 16 Hz. The side-scan sonar uses an EdgeTech 2200-M system for acquisition, EdgeTech Discover 2200 acquisition software records, and SonaWiz software; it has a single-sided scanning width of 200 m and an operating height of 40 m. The collected data can demonstrate the seabed topography.
3.2 Method 3.2.1 Model buildingNumerical calculations in this study provided some assumptions. Landslides mainly occur in shallow sediments within 50 m of seabed sediments, followed by isotropic rock and soil characteristics in the same strata. Rock and soil sediments conforming to the constitutive relationship are simple geotechnical slopes, such as the Mohr-Coulomb quasi-side.
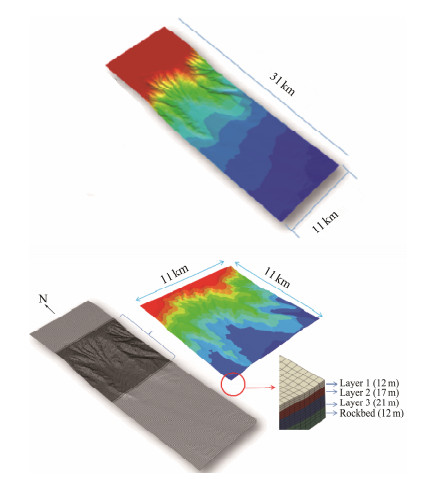
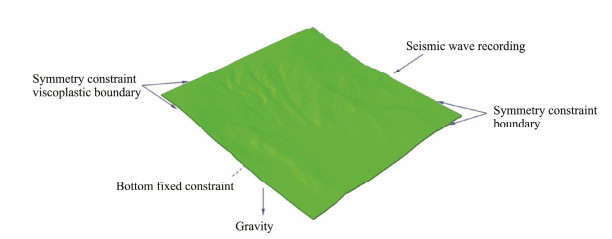
Seabed elevation data were obtained in accordance with 3D seismic data interpretation. A 3D geological model with a slope aspect length of 31 km, a slope strike of 11 km, and a sediment thickness of 50 m (Fig. 2) was established in accordance with the physical mechanics and hydrological parameters of the samples obtained from the AUV exploration and drilling site. The oil well is in the continental slope area, which is prone to slope instability. Thus, the stability calculation model intercepted the continental slope area with a length, width, and thickness of 11 m, 11 m, and 50 m, respectively. The boundary conditions are set as shown in the Fig. 3. Geotechnical parameters are set in the Table 1.
|
Fig. 2 Schematic of the structural model. |
|
Fig. 3 Constraints on the model. The lateral boundary of the model adopted a viscoplastic wave-absorbing symmetrical boundary, and the bottom adopted a fixed boundary; seismic waves were loaded on the element nodes. |
|
|
Table 1 Geotechnical parameters |
On the basis of the collected data, elevation data of the study area were used to establish an elevation map, and the elevation data points were densely planted through data interpolation to establish a numerical calculation model. To improve the efficiency and accuracy of calculation and analysis, the stability analysis area was a land slope area with undulating topography and a length and width of approximately 11 km × 11 km. On the basis of the exploration results, a 50 m thick surface sediment was selected as the calculation depth.
3.2.2 Geostress balanceNumerical models are a collection of computational constraints and criteria, such as the geometric dimensions, material properties, boundary conditions, constitutive relations, strength criteria, and failure quasitest of the research object. The model is the representation of the cognition of the research object and the basis and carrier of computational analysis. A numerical model is the real and natural existence state of the research object before calculation.
Geostress is the natural stress existing in the geological environment without disturbance and is also known as the initial stress of rock and soil mass; absolute stress is the original/main force-causing rock and soil mass deformation and failure. In the numerical simulation analysis of the geotechnical discipline, the balancing process of in situ stress involves solving the initial stress field of soil in the research area, and it is one of the basic steps of reducing the actual situation of soil in this area and obtaining a solution conforming to the actual situation through subsequent numerical simulations. In particular, the strength of seabed sediments is low, the overlying water is thick, and the water pressure is high. If ground stress is unbalanced, then considerable subsidence occurs under the action of gravity without an external load. The initial stress state of the model, that is, ground stress (namely natural and absolute stress), which is the foundation of rock and soil mass stress, deformation, and failure, should first be restored after establishing the model. The equilibrium process of in situ stress is solved to ensure that the calculation is similar to or as close as possible to the original seabed stress.
3.2.3 Load parameter setting1) Using strength reduction to analyze stability under a static load
Under the action of gravity alone, the plastic strain no longer increase, or the sudden change of displacement is the end of the physical calculation. The strength reduction factor at that time is the safety factor of the slope.
2) Seismic force
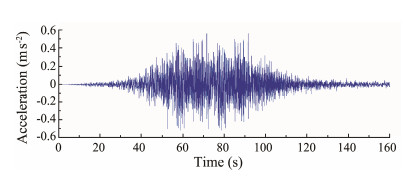
Many studies on active faults in the South China Sea are available, and numerous large-magnitude earthquakes (Zhan et al., 1995; Huang et al., 2019; Sun et al., 2019) with high intensity have occurred. However, due to the filtering effect of thick sediments on the slope and the influence of multifrequency seismic waves on slope stability, this paper selects the actual recorded seismic time history of the Wenchuan earthquake with large earthquake magnitude and high energy as the input for the study of load. Loading the Wenchuan earthquake recorded (Fig. 4) in the Wenxian bedrock, east-west seismic wave is 249 km away, peak ground acceleration (PGA) is 0.56 m s−2, duration is 150 s, The filtered seismic wave frequency is 0.1 – 10 Hz. The stability evolution of the slope under the action of seismic waves, followed by the partial absorption of high frequency by the loose sediments on the seabed and the remaining short period seismic waves, is observed for a long time.
|
Fig. 4 Seismic acceleration time history. The seismic record is the earthquake acceleration in the east-west direction of the Wenchuan earthquake on May 12, 2008, recorded at the bedrock station in Wenxian County, Gansu Province, 249 km away from Wenchuan (PGA: 0.56 m s−2; duration: 150 s). |
The seismic force conditions are as follows. The conditions of the numerical simulation were designed on the basis of the seismic intensity of Ⅵ, Ⅶ, and Ⅷ and the corresponding seismic wave PGA was 0.56 m s−2, which is 2, 3, and 5 times that of 1.12, 1.68, and 2.8 m s−2, respectively. The PGA was calculated to analyze stability under different seismic forces.
3) Instability criteria of strength reduction failure
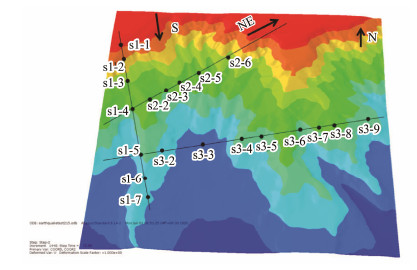
Slope instability generally has three bases. First, the calculation is completed, and slope instability is not converged in the numerical simulation (mainly the failure of the calculation unit). Second, in the plastic zone, the connection from the foot of the slope to the top of the slope is used as a sign of slope failure. Third, the acceleration or sudden change of a certain part of the slope is used as the basis for slope failure. This study was based on displacement changes. Twenty feature points of three sections (Fig. 5) and the seismic dynamic parameters of different topography feature points were analyzed.
|
Fig. 5 Section positions on the model. s1 along the slope direction of the land slope, s2 obliquely crossing the slope, and s3 perpendicular to the slope direction were selected. Different characteristic points in each section were selected to analyze the results. |
The three sections, namely sections 1, 2 and 3, are selected for the profile because they represent the emergence of unstable areas after static load strength reduction, the appearance of unstable areas under dynamic loads, and the analysis areas for stability analysis of different topography on the slope, respectively.
3.2.4 Topographic feature analysisMany types of topographic factors are used to describe the structural features of the topography. Different geomorphic factors reflect topographic features from different angles.
Ground curvature is the degree of distortion of the topography surface quantitative measurement factor, and the vertical and horizontal components of ground curvature are called plane and profile curvatures, respectively. Planar and profile curvatures are also called horizontal and vertical convexity, respectively.
The profile curvature is a measure of the change rate of ground elevation along the direction of the maximum slope. The mathematical expression is
| $ {K_v} = - \frac{{{p^2}r + 2pqs + {q^2}t}}{{({p^2} + {q^2})\sqrt {1 + {p^2} + {q^2}} }}. $ | (1) |
Plane curvature refers to the curvature value of the curve at any point p on the topography surface; it is used to cut the topography surface in the horizontal direction. Planar curvature describes the curvature and change of the surface along the horizontal direction, that is, the curvature degree of the surface contour where the point is located. From another perspective, the plane curvature of a point on the topography surface is also a measure of the degree of slope change within a small range of that point. The mathematical expression is
| $ {K_h} = - \frac{{{q^2}r - 2pqs + {p^2}t}}{{({p^2} + {q^2})\sqrt {1 + {p^2} + {q^2}} }}. $ | (2) |
The topography surface functions are as follows:
| $ Z = f(x, y), $ | (3) |
| $ p = \frac{{\partial f}}{{\partial x}}, $ | (4) |
| $ q = \frac{{\partial f}}{{\partial y}}, $ | (5) |
| $ r = \frac{{{\partial ^2}f}}{{\partial {x^2}}}, $ | (6) |
| $ t = \frac{{{\partial ^2}f}}{{\partial {y^2}}}, $ | (7) |
| $ s = \frac{{{\partial ^2}f}}{{\partial x\partial y}}, $ | (8) |
where x, y is the plane coordinate value of the ground point, and f (x, y) is the ground elevation value. p and q are the change rates of elevation value in the x and y directions, respectively; r is the change rate in the same direction for the change rate of the elevation value in the x direction, that is, the change rate of the elevation rate of change in the x direction; t is the change rate of the elevation value in the y direction; and s is the change rate of the elevation value in the x direction calculated in the y direction, that is, the change rate of the elevation in the x direction is the change rate in the y direction.
For the discrete elevation numerical simulation of numerical simulation as a continuous surface, each point on the surface is considered a vertical and parallel curve based on the principle of differentiation, and the calculation formula of each curvature factor is derived using the calculation method of curvature. The calculation formula is then obtained. The calculation process of the curvature value of each point is shown in Fig. 6 below.

|
Fig. 6 Flowchart of the steps for extracting the ground curvature of discrete elevation. a, b, c, d, e, f, g, h and i are the elevation values of each node (Tang et al., 2010). |
In the figure, a, b, c, d, e, f, g, h, and i represent the elevation value for each unit node.
| $ p = \frac{{\partial f}}{{\partial x}} = \frac{{(a + 2d + g) - (c + 2f + i)}}{{8 \times {\text{Cellsize}}}}, $ | (9) |
| $ q = \frac{{\partial f}}{{\partial y}} = \frac{{(a + 2b + c) - (g + 2h + i)}}{{8 \times {\text{Cellsize}}}}, $ | (10) |
where Cellsize is the cell grid spacing.
The data matrix (p- and q-value matrices) can be formed after the p and q values have been calculated. On this basis, the difference operation is performed on the solving process of the p and q values, and the results can then be obtained as the second derivative r, s, t of the surface function Z = f (x, y).
| $ r = \frac{{{\partial ^2}f}}{{\partial {x^2}}} = \frac{{({a_x} + 2{d_x} + {g_x}) - ({c_x} + 2{f_x} + {i_x})}}{{8 \times {\text{Cellsize}}}}, $ | (11) |
| $ s = \frac{{{\partial ^2}f}}{{\partial x\partial y}} = \frac{{({a_x} + 2{b_x} + {c_x}) - ({g_x} + 2{h_x} + {i_x})}}{{8 \times {\text{Cellsize}}}}, $ | (12) |
| $ t = \frac{{{\partial ^2}f}}{{\partial {y^2}}} = \frac{{({a_y} + 2{b_y} + {c_y}) - ({g_y} + 2{h_y} + {i_y})}}{{8 \times {\text{Cellsize}}}}. $ | (13) |
The section curvature Kv and the plane curvature Kh can then be obtained.
The topography slope is represented as a slope angle Sτ considering the topography modeling literature.
| $ {S_\tau } \approx \frac{{360}}{{2{\rm{ \mathsf{ π} }}}} \cdot \arctan \left[ {\sqrt {{{\left({\frac{{{Z_E} - {Z_w}}}{{2\Delta x}}} \right)}^2} + {{\left({\frac{{{Z_N} - {Z_S}}}{{2\Delta y}}} \right)}^2}} } \right] . $ | (14) |
First, the model is analyzed for the ground stress balance. After the stress balance is reached, the slope stability analysis only under the gravity load is started, and the strength reduction method is used to obtain the safety factor of the submarine slope under the natural state.
On this basis, the slope stability analysis under different external loads and seismic forces is conducted. The topography characteristic parameters of the location of the feature points of the regional site are then calculated. Afterward, the location and size characteristics of the slope instability area under the static load and different dynamic loads. The influence of different loads and topographic features on slope instability was analyzed.
4.1 Geostress Balance and DisplacementGround stress is the natural stress that exists in the earth's crust and is undisturbed by engineering. This stress is also called initial rock mass, absolute stress, or original rock stress. Balancing the initial ground stress obtains a state where the initial stress exists, but the initial strain is absent. If the weight of the soil is considered the main factor, then the weight and initial stress fields are balanced to obtain an accurate initial ground stress state. In the simulation calculation, the deformation of the soil layer under its weight is small so as not to affect the subsequent calculation. In the numerical analysis of geotechnical engineering stability, in situ stress balance is the first step in the simulation calculation and must be emphasized. This approach is mainly based on the following reasons.
The characteristics of geotechnical engineering determine that analysis methods are mostly incremental analysis. In incremental analysis, the stress in the analysis domain is always obtained by adding the stress increment to the initial stress; that is, the initial ground stress is the necessary initial condition for incremental analysis.
The characteristics of rock and soil materials are closely related to their stress state.
The method for importing result files is adopted in this study. First, a stress result is calculated, and the result is taken as the initial stress of the secondary calculation. The displacement and strain are then analyzed. When the displacement and strain meet certain tolerance, the in situ stress is considered to be balanced; that is, the settlement balance is realized by self-weight.
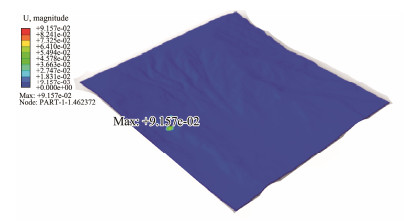
The in situ stress balance under the action of internal gravity in the analysis and calculation area is obtained through several equilibrium iterations. The displacement field is 4.411 × 10⁻⁵ m, which is close to 0 (Fig. 7). The internal stress field is balanced with the external load gravity. The strength reduction stability analysis revealed that the safety factor of slope stability is 3.3. Only two areas in the entire model are unstable (Fig. 8).

|
Fig. 7 Displacement and stress cloud after geostress equilibrium. (a) The maximum value after the ground stress is balanced is 4.41 × 10⁻⁵ m; when the ground stress is unbalanced, the displacement settlement reaches 13.4 m. (b) Stress reaches a small value of 174 N m−2 when water pressure reaches equilibrium. |
|
Fig. 8 Regional displacement cloud image obtained by strength reduction analysis. The reduction factor of instability is the safety factor, which is calculated to be 3.3. The slope in a natural state is stable. Instability occurred in two large slope areas on the west side of the area. |
The Young's modulus of materials such as rock and soil is small, and large deformations often occur before failure. Geotechnical problems generally have less stringent requirements for displacement and deformation. Stability is the control function. Stress and deformation must be analyzed on the basis of the constitutive relationship of the soil. Displacement mutation is the sign of slope instability selected in this study. The location of the instability area distribution from the displacement cloud map of the entire area and the cause of slope instability are examined through section selection and feature point extraction, respectively.
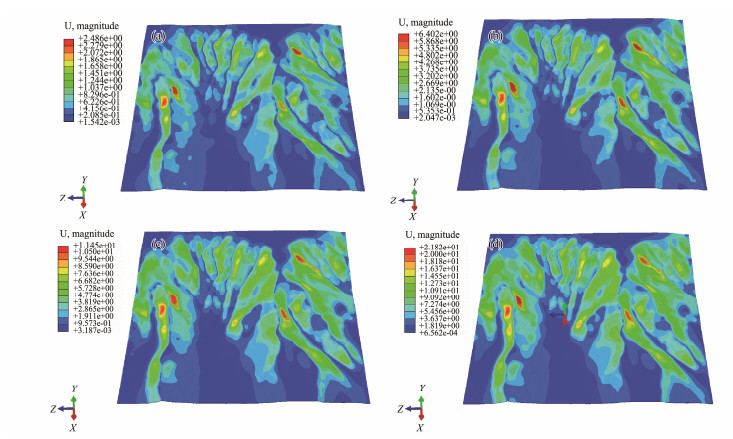
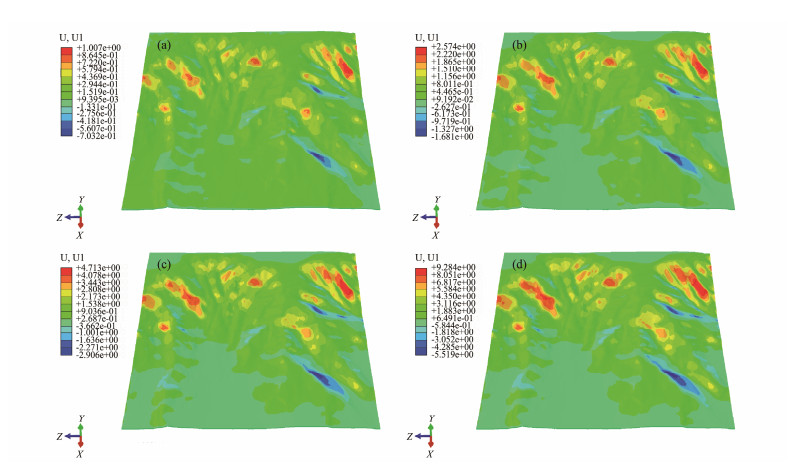
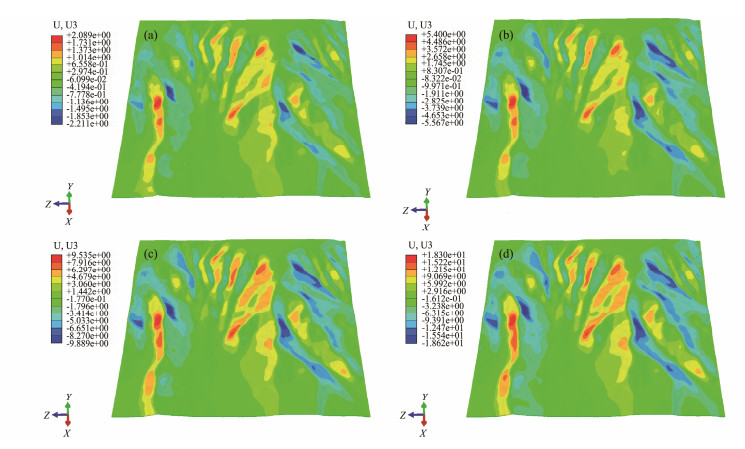
Fig. 9 shows that with the increase in seismic force, the locations of several large displacement areas remain unchanged, the amplitude increases, and the area expands. Figs. 10 and 11 show the component distribution diagrams of displacement in the X and Z directions, respectively. The position with a large amount of displacement is the position with a large slope in that direction.
|
Fig. 9 Displacement magnitude clouds under different seismic forces. (a), (b), (c), and (d) respectively represent the displacement magnitude cloud diagrams under 1, 2, 3, and 5 times the amplitude of the loaded ground motion, that is, the displacement cloud diagrams under the action of seismic intensity Ⅵ, Ⅶ, and Ⅷ. |
|
Fig. 10 Displacement X direction cloud under different seismic forces. With the increase in seismic force, the displacement of the north-south direction of the slope and the instability area both increase. The increased area is located in an area with a steep slope. |
|
Fig. 11 Displacement Z direction cloud under different seismic forces. As the earthquake load increases, the slope displacement in the east-west direction and the area of instability both increase. The increased area is located in the steeply sloped area or the east-west abrupt place. |
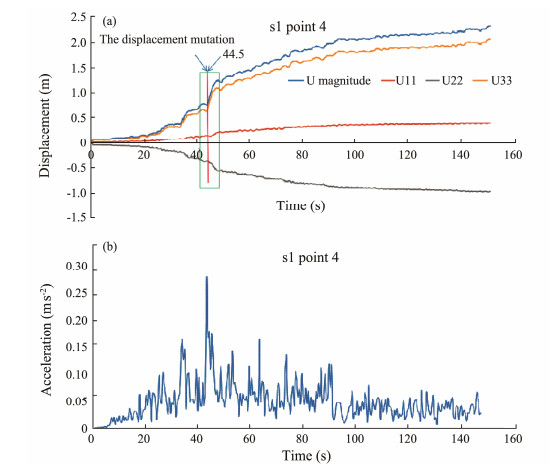
The sudden change of displacement occurs at the time of maximum acceleration, that is, 44.5 s (Fig. 12). By combining the 3D topographic map (Fig. 5) and 3D data (Fig. 12), the displacement direction was west and vertical downward, which coincided with the location of the point on the west side of the ridge.
|
Fig. 12 Point 4 of section 1 is taken as an example. Point 4 starts to accelerate and becomes flowery at 44.5 s, and signs of instability appear. In 44.5 s, seismic acceleration reaches a maximum of 0.27931 m s−2. The maximum displacement is 2.301 m, and the final development is 917 m long. An unstable area had a width of 230 m. |
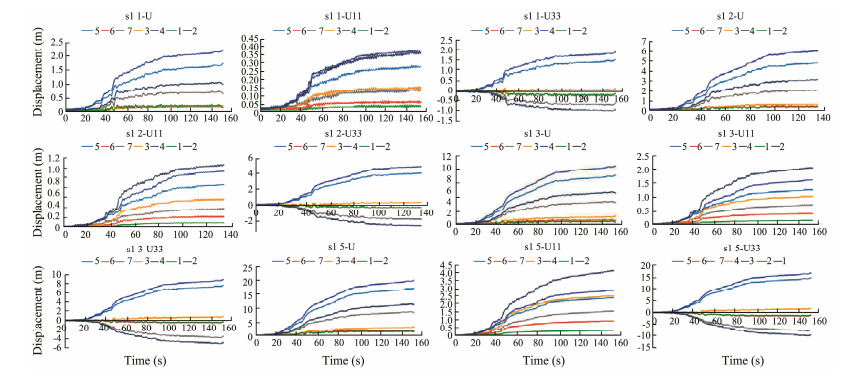
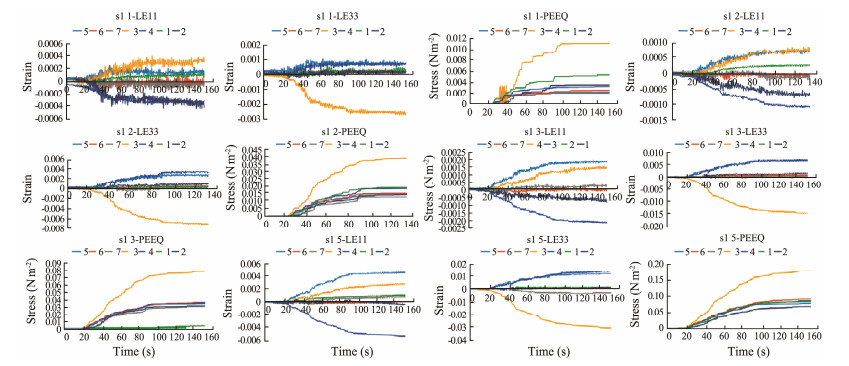
The sections and feature points are marked and illustrated in this paper. For example, s1 2-U11 represents the s1 section; 2 in 2-U11 represents the multiple of the seismic force, that is, twice the PGA 0.56 m s−2; and U11 represents the displacement in the north-south direction, where the south and north are positive and negative, respectively. LE33 is the east-west strain; the east and west are negative and positive, respectively.
The slope angle, section curvature, and plane curvature of the topography characteristic parameters are calculated in accordance with the element coordinate data of the numerical analysis model and Eqs. (1), (2) and (14). The results of numerical calculations (displacement and component, equivalent plastic strain, and strain component) are compared and analyzed.
The section and plane curvature (Table 2) of the 7 feature points on the profile (Fig. 13) are calculated in accordance with the element grid node elevation of the numerical model.
|
|
Table 2 Feature point value of the section and plane curvature |

|
Fig. 13 Feature point position in profile 1. |
Section S1 (Figs. 14 and 4 and Table 2) shows that the slope of point 4 in the extension direction (X direction) is small, and the topography slope is large. The slope in the Z direction is large according to Eq. (15). The displacement magnitudes are points 4, 5, 2 and 7, and the topography slope magnitudes are 4, 5, 7 and 2. However, the plane curvature of point 2 and the slope change rate are both large, and the topography is prominent.
|
Fig. 14 Displacement from large to small at points 4, 5, 2, 7 and 3 in the X direction (slope dip direction: south); displacement is at points 2, 4, 5, 7 and 3 in the Z direction (perpendicular to the slope dip). The east side of the landslide is at points 2, 7, and the west side of the landslide is at points 4, 5. |
The displacement U11, U33, magnitude, PEEQ (equivalent plastic strain, which is the accumulation of equivalent plastic strain and describes the plastic strain at a certain moment in the deformation process regardless of the loading history), LE11, and LE33 (LE is the abbreviation of strain, and LE11 stands for strain in the X direction) of seven points are obtained by analyzing the characteristic points in section 1.
At the 2D profile, such as points 4 and 5 (Fig. 15), the topography features do not match the calculated displacement and equivalent plastic strains. Thus, these features can not explain the occurrence of abnormal points in the displacement and energy accumulation at the dangerous and steep feature points on the profile. The slope and the displacement along the slope are both small; however, the equivalent plastic strain is large.
|
Fig. 15 Time-history diagram of the displacement of topographic feature points under different earthquake intensities. The direction of strain is south for points 5, 3, and 1, north for points 2 and 4, west for points 4 and 5, and east for point 3. Point 3 is located at the front end of a relatively gentle slope and the accumulation of plastic strain is large, indicating that this area is subject to high stress. |
The section and plane curvatures (Table 3) of the six feature points (Fig. 16) are calculated in accordance with the element grid node elevation of the numerical model.
|
|
Table 3 Feature point value of section curvature and plane curvatures |

|
Fig. 16 Feature point position on profile 2 |
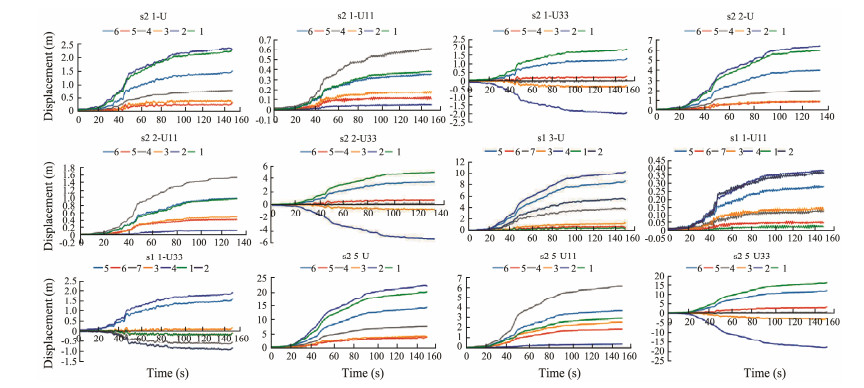
The displacement in Fig. 17 from large to small is points 2, 1, 6 and 4 and that in the X direction (slope dip direction) is points 4, 6, 1 and 3. In the Z direction (perpendicular to the slope dip direction), the landslide to the east is at points 2, 1 and 6 on the west side of the landslide.
|
Fig. 17 Time-history diagram of the displacement of topographic feature points under different earthquake intensities. |
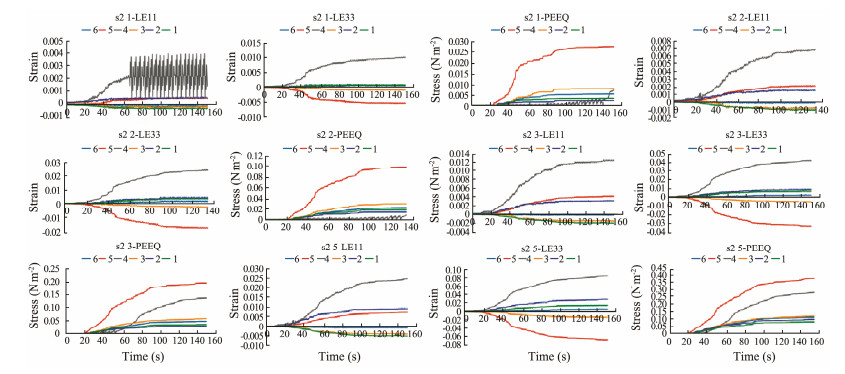
The displacement (in Fig. 17) and strain (in Fig. 18) of point 4 are large, followed by points 5 and 2. Combined with the 3D topographic map of Fig. 5, the strain at point 4 is south and west; that is, the strain is generated along the ridge to the south and west along the slope. When the PGA is 0.56 m s−2, its strain value oscillates violently, indicating that the stress value direction in this area rapidly changes. As the seismic force increases, the oscillation weakens, and the equivalent plastic strain also fluctuates, indicating that seismic waves are refracted and superimposed on the foot of the ridge (Fig. 5), which results in resonance (Fig. 18). In the gully on the east side of the ridge at point 5, the gully extends in the southeast direction, and the strain direction is east and south; points 4 and 5 are located in ridges and gullies, with large topography slopes and relatively large accumulated plastic strains.
|
Fig. 18 Time-history diagram of the strain and PEEQ of topographic feature points under different earthquake intensities in section 3. |
The section and plane curvatures (Table 4) of the nine feature points (Fig. 19) are calculated in accordance with the element grid node elevation of the numerical model.
|
|
Table 4 Feature point value of section curvature and plane curvature |

|
Fig. 19 Feature point position on profile 3. Among them, points 3, 5 and 8 are located at the bottom or flat part of the valley; points 1, 4, and 7 are located on the west side of the ridge; points 2, 6 and 9 are on the east side of the ridge slope; points 6, 1, 4, 7, and 8 have large elevations. |
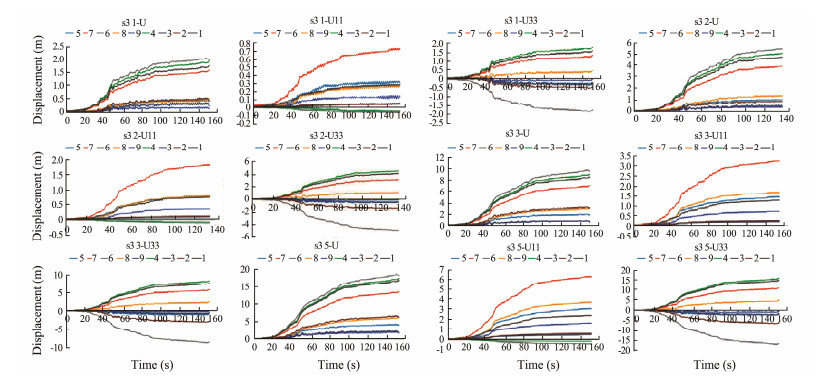
In Fig. 20, large displacements are generated at the high points of the four topography mutations 6, 4, 1 and 7, and the displacement of the point 7 ridge are wide (Fig. 5). At the narrowing mutation and turning points of the slope on both sides of the ridge, the displacement is south and west, and the six-point displacement is to the east.
|
Fig. 20 Displacement and displacement component time-history diagrams of the characteristic points on profile 3 under different earthquake intensities. |
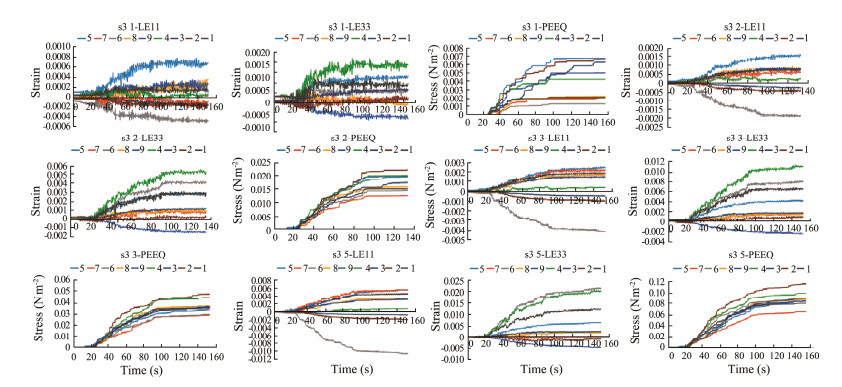
This section is located at the bottom of the land slope, and the elevation difference in topography is small (visual error caused by different vertical and horizontal scales). Point 6 is located in the gully, and the strain direction of it is north and east. In Fig. 21, the strains of points 5 and 9 mainly appear in the east and south unidirectional, respectively, and that of point 4 is on the west side, indicating that the force in the slope direction is large, and the vertical direction is small.
|
Fig. 21 Time-history diagram parameters of topographic feature points under different earthquake intensities in section 3. |
The submarine sediment has a small bulk density and low strength. The thickness of 50 m causes the geological model to suffer from substantial ground stress, and the settlement under its weight is large. The initial ground stress is balanced through multiple iterations (Fig. 6).
In the static analysis, which used the strength reduction finite element analysis method, results show two instability areas in the entire area (Fig. 7), with a safety factor of 3.3. Moreover, the analyzed well site area is safe and stable under natural conditions. Vibrations caused by oil well drilling or active fault movement in the area affect the slope stability of the area. Owing to different dynamic loads in the natural earthquake time history, slope instability occurs in three areas (Fig. 8), and the two positions are the same. This phenomenon is due to the failure of the unit in the presence of an unstable slope in the static analysis. The instability area that has just appeared has certain limitations. Considering the safety of oil well engineering, the three instability areas are far away from the well site, and instability does not directly affect the safety of the well site.
Under different dynamic loads, the location of the slope instability area is consistent (Fig. 8), but the displacement and the instability area are both large (Figs. 9 and 10). The instability time (i.e., displacement mutation time) is determined by comparing the displacement. That is, as the earthquake intensity increases, the energy acting on the soil becomes large, and the soil is destroyed.
5 Discussion 5.1 Limitations of Numerical Simulation SettingSeveral limitations of submarine landslide numerical simulations affect the validity of the detailed simulated architectures.
Soil liquefaction, which is also called earthquake liquefaction, ground failure, or loss of strength, causes solid soil to behave temporarily as a viscous liquid. The phenomenon occurs in water-saturated unconsolidated soils affected by seismic S waves (secondary waves), which cause ground vibrations during earthquakes. The stability of many slopes on land has been found that saturated sands produce excessive pore water pressure under the action of seismic forces, thus reducing slope stability, which is an important factor for slope instability.
In this simulation, the saturated and weak seabed sediments can have a large self-sustaining force because the soil particles of the seabed sediments are immersed in the water, and the particles are balanced by gravity and buoyancy. The ground stress balance method is used in this paper to solve the problem of water pressure and the balance of gravity and buoyancy. Consequently, observing whether excess pore pressure or even liquefaction slope instability occurs under reciprocating vibration loads, such as earthquakes, becomes impossible.
The stratum is set up in equally thick layers, undulating parallel to the ground, similar to an ideal stratum model waiting for the sedimentary layer to produce folds without denudation. An accurate stratum description and the assignment of geotechnical anisotropy parameters are needed. In the dynamic analysis, the different boundaries and characteristics of the stratum along the way are inconsistent with the impedance of seismic waves and have a reforming effect on the energy propagation of seismic waves. By establishing a 2D loess valley-shaped site model and through dynamic analysis, Ma et al. (2016) found that the interaction between topographical undulations and strata controls the surface PGA changes of the site, thus increasing their complexity. The presence or absence of the overlying soil layer on the bedrock layer affects the seismic wave frequency spectrum and amplitude. Moreover, the value remarkably changes. The proximity of the fundamental frequency of the site to the frequency spectrum of the seismic wave that has been modified by topography and strata induces resonance; that is, it increases in amplitude and causes damage. Wang et al. (2018) studied ground motion acceleration and spectrum characteristics through a loess valley earthquake site. They found that under the effect of topography and soil, common GPA magnification is roughly equal to separation under the action of the PGA amplification factor of the product. Simultaneously, by analyzing the Fourier spectrum and the spectrum of peaks and valleys, they found that topography amplification effects under the action of the topography and soil are equal to the product of their individual topography amplification effects.
5.2 Complementarity of the Strength Reduction Finite Element Method and Dynamic AnalysisStatic analysis of the stress (Matsui and Sam, 1992; Duncan, 1996; Talling et al., 2014), strain, and displacement of the structure in the equilibrium state revealed that strength reduction continuously weakens the soil. When the slope is marked by instability, the unit fails, and the calculation is terminated. This method can analyze the instability area that appears first but not the area that appears later. This phenomenon is the most vulnerable indicator of the entire area and is also regarded as the factor of safety; that is, landslides occur in the entire area beyond this value. However, this method has limitations for different external loads. The method cannot identify all potential danger zones in an area or other instability zones after the initial instability.
Dynamic analysis is used to analyze the stress-strain response of the structure under the condition that the load changes with time and further attention is provided to the analysis of the motion and instability process of the simulated structure. The stress and external load of the slope and the balance of the inertial force caused by the acceleration are analyzed in the entire calculation time history. The stability analysis can traverse the entire model to find all possible instability regions and make a global consideration for the stability of the entire region (Fig. 22). The environmental medium of a submarine landslide contains seawater; thus, it can be used as a carrier medium to transport the landslide block for a long distance, expanding the hazard range of the submarine landslide. Therefore, all potentially dangerous areas in a particular location must be eliminated. Dynamic analysis can compensate for the lack of static strength reduction analysis.

|
Fig. 22 Distribution of potential hazard areas under static and dynamic analyses. |
A topography profile is a vertical profile along a certain direction of an area of interest. This profile can show the undulations of the ground and thus is a means to learn about the changing laws of topography along a certain path. The topography profile can reveal the relative positions of points in the profile relationship.
The topography profile is also an analysis method to examine the results of numerical calculations and study the relationship between calculation results and topographic feature parameters. Many calculations of stability directly select a certain section as the representative of the stability calculation of the entire area, analyzing the relationship between rock and soil characteristics and slope instability and slope stability under seismic force (Masson et al., 2011; Xu et al., 2011); the direction of instability is single and fixed.
When displaying the results of large-sized models, considering the detailed features in all directions is often impossible. Visual errors occur when the slope, undulation, and roughness are displayed in the profile because of the small vertical thickness, the large length and width, and the inconsistency of scales in the two horizontal directions. The introduction of topography parameters can become an intuitive and accurate numerical expression, which can eliminate this kind of error caused by the overall display of the results.
Three sections with different orientations and 20 feature points at different positions are selected (Fig. 5). The displacement and displacement components, strain, and equivalent plastic properties of the given points are then analyzed. The results of the numerical simulation must be combined with topography parameters and 3D models (Ouyang et al., 2020) to explain the area. The stability results only from the 2D profile (Shi et al., 2019) or the ideal model (Feng et al., 2018; Song et al., 2019) are insufficient for the explanation. For example, the points in the gully (s2-3, s2-5) have small displacement, but the plastic strain accumulation is large; the displacement in the points (s2-1, s2-6, s3-1, s3-4, s3-6, s3-8) on the slopes on both sides of the ridge is divided into two directions: downhill along the ridge and slope.
The large displacement belongs to the empty surface or the top. The displacement on both sides of the groove is generally small, while that along the groove direction is large. However, the accumulated strain is large.
At the sudden change or pinch points of the topography, such as (s2-4), when the load is small, the strain and displacement along the slope direction oscillate violently and with a small amplitude, respectively. This event is a resonance phenomenon. Refraction in a special topography produces resonance.
5.4 Control of Seabed Topography on Slope InstabilityMany studies have shown that topographical bumps have an amplifying effect on seismic waves (Liu et al., 2015; Ba and Yin, 2016).
This study illustrated that the scattering characteristics strongly depend on the incident frequency and angle, soil porosity, boundary drainage condition, and canyon shape. Compared with the incidence of P waves, the amplification effect is slightly small for critical porosity, but additional amplification features can be found for incident SV waves at the critical angle. These analyses mainly used a 2D model to reveal the seismic wave propagation on a cross-section of a certain trend; however, this model is affected by topographical relief and thus cannot reflect the true and complex seismic wave propagation.
3D site effects were also studied, but stability was not considered (Wang et al., 2018). The present study establishes a 3D terrain model considering topographic factors and conducts static and dynamic analyzes, terrain parameter extraction, and dynamic response analyses. The 3D simulation results can explain unexplainable 2D phenomena through 3D analysis and cross-section comparison. When the load is small but the topography is modified, large seismic responses occur in some locations, resulting in abnormal stress and instability. This kind of phenomenon is called the topographical effect. The key factors for the occurrence of the topographical effect include characteristic parameters, such as the shape and size of the topography. When the seismic wave is incident on this type of topography, it passes through the scattering and diffraction of the topography boundary, and the resonance effect occurs. The seismic wave energy is strengthened and acts on the rock and soil. The force is increased sharply and thus may cause damage. For example, s3-1 in this study is located at the top of the ridge (Fig. 5), forming a bumpy body, and the strain flips and oscillates sharply.
6 ConclusionsThrough the establishment of a 3D numerical model of the seabed in the study area and calculations based on static and dynamic conditions, this study reveals that the slope of the oil well site is stable and safe in its natural state. However, under acting earthquakes, the slope produces a local slip zone and slope stability-related features. Some conclusions are as follows.
1) Static and dynamic analyses reveal that the instability area in static analysis is also the instability area under the dynamic load. Under natural conditions, the safety factor of this area is 3.3, and the slope is stable. Under the dynamic load, the instability area increases on the previous basis, but the instability time is increased by the seismic force; that is, the energy increases by 44.5 s (Fig. 11), the displacement of some locations increases sharply, and instability occurs.
2) The 3D feature parameters of the topography can explain the results of the 3D numerical simulation. Three sections in different directions and 20 characteristic points of the section are selected to analyze the displacement, velocity, acceleration, stress, strain, and strength. Many characteristic points are difficult to explain only in the 2D section; thus, the topography is analyzed through 3D topography or 3D topography parameters. The direction and size of the unevenness and steepness can be reasonably explained. This study analyzes the overall stability of the area and the instability-prone areas based on the comparison of static and dynamic load results. The dynamic load can search for all potential instability areas in the entire area under different vibrations. The introduction of topography parameters reduces the misjudgments caused by visual errors.
3) Stability analysis can be used for disaster prediction in a certain area. Topography has 3D attributes; thus, 3D analysis is required in areas with complex topography. 2D analysis cannot reflect the true regional stability. Marine geological hazards are problems in a region. A section or a point is insufficient to represent and explain geological safety problems in a region, especially in areas with complex topography. A large-scale calculation of the 3D topography model can reduce the misjudgment of stability to a certain extent. The parameterized description of the topography is an important step in studying the laws of topography. The application of topography parameters is mostly used in cartography and less in geological analysis, especially in numerical calculation analysis. The steepness of the topography and the law of change with the extension of direction can be understood through the analysis of the slope and topography curvature. Such analysis is an important part of the identification of the topography structure and a crucial factor in the discovery of the law of slope instability.
AcknowledgementsThis study was supported by the National Key Research and Development Program of China (No. 2019YFC0312 301), and the Nation Natural Science Foundation of China (No. U1701245).
Abrams, A. M., 2017. Evaluation of near-surface gases in marine sediments to assess subsurface petroleum gas generation and entrapment. Geosciences, 35(7): 1-29. (  0) 0) |
Ba, Z., and Yin, X., 2016. Wave scattering of complex local sites in a layered half-space by using a multidomain IBEM: Incident plane SH waves. Geophysical Journal International, 205(3): 1382-1405. DOI:10.1093/gji/ggw090 (  0) 0) |
Biscontin, G., Pestana, J. M., and Nadim, F., 2004. Seismic triggering of submarine slides in soft cohesive soil deposits. Marine Geology, 203: 341-354. DOI:10.1016/S0025-3227(03)00314-1 (  0) 0) |
Duncan, M. J., 1996. State of the art: Limit equilibrium and finite element analysis of slope. Journal of Geotechnical Engineering, 122(7): 577-595. DOI:10.1061/(ASCE)0733-9410(1996)122:7(577) (  0) 0) |
Duncan, M. J., 2000. Factors of safety and reliability in geotechnical engineering. Journal of Geotechnical and Geoenvironmental Engineering, 126: 307-316. DOI:10.1061/(ASCE)1090-0241(2000)126:4(307) (  0) 0) |
Feng, S., Chen, Z., Chen, H., Zheng, Q. T., and Liu, R., 2018. Slope stability of landfills considering leachate recirculation using vertical wells. Engineering Geology, 241: 76-85. DOI:10.1016/j.enggeo.2018.05.013 (  0) 0) |
Grilli, S. T., Taylo, O. D., Baxter, C. D. P., and Maretzki, S., 2009. A probabilistic approach for determining submarine landslide tsunami hazard along the upper east coast of the United States. Marine Geology, 264: 74-97. DOI:10.1016/j.margeo.2009.02.010 (  0) 0) |
Hance, J. J., 2003. Development of a database and assessment of seafloor slope stability based on published literature. Master thesis. University of Texas at Austin.
(  0) 0) |
Harris, P. T., Barrie, J. V., Conway, K. W., and Greene, H. G., 2013. Hanging canyons of Haida Gwaii, British Columbia, Canada: Fault control on submarine canyon geomorphology along active continental margins. Deep Sea Research Part Ⅱ: Topical Studies in Oceanography, 104: 83-92. (  0) 0) |
He, Y., Zhong, G., Wang, L., and Kuang, Z., 2014. Characteristics and occurrence of submarine canyon-associated landslides in the middle of the northern continental slope, South China Sea. Marine and Petroleum Geology, 57: 546-560. DOI:10.1016/j.marpetgeo.2014.07.003 (  0) 0) |
Heller, V., Bruggemann, M., Spinneken, J., and Rogers, B. D., 2016. Composite modelling of subaerial landslide-tsunamis in different water body geometries and novel insight into slide and wave kinematics. Coastal Engineering, 109: 20-41. DOI:10.1016/j.coastaleng.2015.12.004 (  0) 0) |
Horozal, S., Bahk, J. J., Urgeles, R., Kim, G. Y., Cukur, D., Kim, S. P., et al., 2017. Mapping gas hydrate and fluid flow indicators and modeling gas hydrate stability zone (GHSZ) in the Ulleung Basin, East (Japan) Sea: Potential linkage between the occurrence of mass failures and gas hydrate dissociation. Marine and Petroleum Geology, 80: 171-191. DOI:10.1016/j.marpetgeo.2016.12.001 (  0) 0) |
Huang, C. Y., Wang, P. X., Yu, M. M., You, C. F., Liu, C. S., Zhao, X. X., et al., 2019. Potential role of strike-slip faults in opening up the South China Sea. National Science Review, 6(5): 891-901. DOI:10.1093/nsr/nwz119 (  0) 0) |
Jeong, S. W., Locat, J., Leroueil, S., and Robert, J. L., 2013. Fluidization process in submarine landslides: Physical and numerical considerations. Marine Georesources & Geotechnology, 31: 190-207. (  0) 0) |
Leynaud, D., Mienert, J., and Nadim, F., 2004. Slope stability assessment of the Helland Hansen area offshore the mid-Norwegian margin. Marine Geology, 213: 457-480. DOI:10.1016/j.margeo.2004.10.019 (  0) 0) |
Li, J. B., 2011. Dynamics of the continental margins of South China Sea: Scientific experiments and research progresses. Journal of Geophysics, 54(12): 2993-3003 (in Chinese with English abstract). (  0) 0) |
Liu, Z., Liang, J., and Huang, Y., 2015. The IBIEM solution to the scattering of plane SV waves around a canyon in saturated poroelastic half-space. Journal of Earthquake Engineering, 19(6): 956-977. DOI:10.1080/13632469.2015.1023473 (  0) 0) |
Ma, L., Lu, Y., Wang, L., and Sun, Y., 2016. Study on ground motion characteristics in loess Hill Valley sites. China Earthquake Engineering Journal, 38(3): 373-381 (in Chinese with English abstract). DOI:10.3969/j.issn.1000-0844.2016.03.007 (  0) 0) |
Ma, Y., Li, S. Z., Liang, J., Suo, Y., Dai, L., Wang, X., et al., 2012. Characteristics and mechanism of submarine landslides in the Qiongdongnan Basin, northern South China Sea. Journal of Jilin University (Earth Science Edition), 42(s3): 196-205 (in Chinese with English abstract). (  0) 0) |
Masson, D. G., Arzola, R. G., Wynn, R. B., Hunt, J. E., and Weave, P. P. E., 2011. Seismic triggering of landslides and turbidity currents offshore Portugal. Geochemistry Geophysics Geosystems, 12: Q12011. (  0) 0) |
Masson, D. G., Harbitz, C. B., Wynn, R. B., Pedersen, G., and Lovholt, F., 2006. Submarine landslides: Processes, triggers and hazard prediction. Philosophical Transactions of the Royal Society A –Mathematical Physical and Engineering Sciences, 364: 2009-2039. DOI:10.1098/rsta.2006.1810 (  0) 0) |
Matsui, T., and San, K. C., 1992. Finite element slope stability analysis by shear strength reduction technique. Soils and Foundations, 32(1): 59-70. DOI:10.3208/sandf1972.32.59 (  0) 0) |
Nadim, F., and Kvalstad, T. J., 2007. Risk assessment and management for offshore geohazards. First International Symposium on Geotechnical Safety & Risk. Shanghai: 159-173. (  0) 0) |
Ouyang, M. T., Wu, T., Li, L., Qiu, Y., and Zhu, Q., 2020. Seabed stability evalution of deep water well site with complex topography in Qiongdongnan continental slope area. China Offshore Oil and Gas, 32(4): 179-189 (in Chinese with English abstract). (  0) 0) |
Pampell-Manis, A., Horrillo, J., Shigihara, Y., and Parambath, L., 2016. Probabilistic assessment of landslide tsunami hazard for the northern Gulf of Mexico. Journal of Geophysical Research, 121: 1009-1027. (  0) 0) |
Rahman, M. S., and Jaber, W. Y., 1991. Submarine landslides: Elements of analysis. Marine Georesources & Geotechnology, 10: 97-124. (  0) 0) |
Rasyif, T. M., Syamside, Al'ala, M., and Fahmi, M., 2016. Numerical simulation of the impacts of reflected tsunami waves on Pulo Raya Island during the 2004 Indian Ocean tsunami. Journal of Coastal Conservation, 20(6): 489-499. DOI:10.1007/s11852-016-0464-6 (  0) 0) |
Shi, Y. H., Liang, Q. Y., Yang, J. P., Yuan, Q. M., Wu, X. M., and Kong, L., 2019. Stability analysis of submarine slopes in the area of the test production of gas hydrate in the South China Sea. China Geology, 2: 276-286. (  0) 0) |
Song, B., Cheng, Y., Yan, C., Lyu, Y., Wei, J., Ding, J., et al., 2019. Seafloor subsidence response and submarine slope stability evaluation in response to hydrate dissociation. Journal of Natural Gas Science and Engineering, 65: 197-211. DOI:10.1016/j.jngse.2019.02.009 (  0) 0) |
Strupler, M., Hilbe, M., Anselmetti, F. S., Kopf, A. J., Fleischmann, T., and Strasser, M., 2017. Probabilistic stability evaluation and seismic triggering scenarios of submerged slopes in Lake Zurich (Switzerland). Geo-Marine Letters, 37: 241-258. DOI:10.1007/s00367-017-0492-8 (  0) 0) |
Sultan, N., Cochonat, P., Foucher, J. P., Mienert, J., 2004. Effect of gas hydrates melting on seafloor slope instability. Marine Geology, 213: 379-401. DOI:10.1016/j.margeo.2004.10.015 (  0) 0) |
Sun, Z., Lin, J., Qiu, N., Jian, Z. M., Wang, P. X., Pang, X., et al., 2019. The role of magmatism in the thinning and breakup of the South China Sea continental margin. National Science Review, 6(5): 871-876. DOI:10.1093/nsr/nwz116 (  0) 0) |
Talling, P. J., Clar, M., Urlaub, M., Pope, E., Hunt, J. E., and Watt, S. F. L., 2014. Large submarine landslides on continental slopes geohazards, methane release, and climate change. Oceanography, 27: 32-45. (  0) 0) |
Tang, G., Li, F., and Liu, X., 2010. Digital Elevation Model Tutorial. Science Press, Beijing, 256pp.
(  0) 0) |
Terry, J. P., Winspear, N., Goff, J., and Tan, P. H. H., 2017. Past and potential tsunami sources in the South China Sea: A brief synthesis. Earth-Science Reviews, 167: 47-61. DOI:10.1016/j.earscirev.2017.02.007 (  0) 0) |
Wang, G., Du, C. Y., Huang, D. R., Jin, F., Roo, R. C. H., and Kwan, J. S. H., 2018. Parametric models for 3D topographic amplification of ground motions considering subsurface soils. Soil Dynamics and Earthquake Engineering, 115: 41-54. DOI:10.1016/j.soildyn.2018.07.018 (  0) 0) |
Watts, P., and Grilli, S. T., 2003. Underwater landslide shape, motion, deformation, and tsunami generation. The Thirteenth International Offshore and Polar Engineering Conference. Hawaii, 364.
(  0) 0) |
Wonham, J. P., Jayr, S., Mougamba, R., and Chuilon, P., 2000. 3D sedimentary evolution of a canyon fill (lower Miocene-age) from the Mandorove formation, offshore Gabon. Marine and Petroleum Geology, 17: 175-197. DOI:10.1016/S0264-8172(99)00033-1 (  0) 0) |
Wu, P., Hou, D., Gan, J., and Li, X., 2018a. Paleoenvironment and controlling factors of Oligocene source rock in the eastern deepwater area of Qiongdongnan Basin: Evidences from organic geochemistry and palynology. Energy & Fuels, 32(7): 7423-7437. (  0) 0) |
Wu, S., Wang, D., and David, V., 2018b. Deep-sea geohazards in the South China Sea. Journal of Ocean University of China, 17(1): 1-7. DOI:10.1007/s11802-018-3490-1 (  0) 0) |
Xu, W., Che, A., Wang, Z., Wang, H., and Liu, C., 2011. Destruction characteristic of seabed landslide during earthquake motion and its mechanism. Journal of Shanghai Jiaotong University, 45(5): 782-786. (  0) 0) |
Zhan, W., Liu, Y., Zhong, J., and Lu, C., 1995. Preliminary analysis of the active faults and hazard geology in the south of the South China Sea. Marine Geology & Quaterary Geology, 15(3): 1-9. (  0) 0) |
Zhan, W., Sun, Z., Zhu, J., Tang, C., and Qiu, X., 2001. A study on geology environment and hazards in Pearl River Mouth Islands and waters. Marine Geology & Quaternary Geology, 21(4): 31-36 (in Chinese with English abstract). (  0) 0) |
 2023, Vol. 22


