2) The Key Laboratory of Speech Acoustics and Content Understanding, Institute of Acoustics, University of Chinese Academy of Sciences, Beijing 100049, China;
3) The State Key Laboratory of Acoustics, Institute of Acoustics, Chinese Academy of Sciences, Beijing 100190, China
The technology that integrates feature analysis (Liu et al., 2013) with a beam algorithm is commonly referred to as signal selection technology. Among these techniques, the cyclic MUSIC algorithm stands out as a widely employed signal-selective method capable of improving the angular resolution and noise robustness of targets with specific modulation frequencies, effectively suppressing interference and noise. Additionally, Schell and Gardner (1989) and Gardner et al. (2006) note that this algorithm can handle more sources than the number of sensors. Despite the recent increase in attention toward the cyclostationarity of propeller noise models, as highlighted by Jha et al. (2003), Jurdic et al. (2009), and Cheng et al.(2010, 2019), the application of cyclic beamforming algorithms in underwater acoustics has not been extensively explored.
The traditional cyclic beamforming algorithm, initially designed for digitally modulated signals (Agee et al., 1990), caters to signals characterized by higher modulation frequencies than signal bandwidths and higher signal-to-noise ratios (SNRs) than underwater acoustic signals. Schell and Gardner (1992) introduced cyclostationarity into array processing, and shows that cyclostationarity-exploiting direction-finding methods are less sensitive to array calibration errors compared to conventional methods. Subsequently, various subspace-based cyclic stationary MUSIC algorithms have emerged, including cyclic MUSIC (Schmidt, 1982), cyclic estimation of signal parameters via rotational invariance techniques (ESPRIT) (Gardner, 1988), extended cyclic MUSIC (Charge et al., 2003), and root-MUSIC (Charge and Wang, 2005), specifically tailored for cyclostationary signals. However, conventional algorithms predominantly focus on analyzing targets in the time domain rather than the frequency domain because the signal bandwidth of digitally modulated signals is typically much smaller than the modulated frequency.
Unlike digitally modulated signals, the frequency spectrum of cavitation noise generated by ship propellers spans multiple octaves, surpassing the modulation frequency of the propeller. This invalidates the single-frequency approximation commonly employed. Previous literature (Xu and Kailath, 1992) has explored the impact of bandwidths on the performance of cyclic algorithms. Given that time-domain methods rely on the assumption that signals of identical frequency share the same guiding vector, frequencydomain cyclic algorithms (Yan and Fan, 2005; Pokrajac and Vučić, 2010, 2011) have been proposed. These algorithms utilize multiple guiding vectors to represent signals in discrete frequency bands. An example of such is the extended MUSIC algorithm, though it results in a doubled matrix dimension. However, in subsequent subspace bearing estimations, the performance of these algorithms degrades under low SNR conditions owing to an insufficient number of snapshots.
Building on the aforementioned concepts, this study introduces a novel wideband cyclic beamforming algorithm. Specifically, to address the bandwidth issue, the conventional cyclic covariance matrix is replaced with its own variance (Guo et al., 2016). This substitution not only preserves signal selectivity performance but also transforms the algorithm from a multifrequency to a single-frequency problem, thereby halving the number of guiding vectors required. To tackle the signal robustness problem, beamforming analysis is employed instead of subspace analysis, overcoming challenges in estimating signal subspace under low snapshot conditions. Additionally, the assumption that target signals in the same frequency band share a common steering vector increases the number of available snapshots while maintaining a constant frame length. Ultimately, the proposed algorithm demonstrates significantly improved performance when operating on low SNR broadband signals.
2 Related WorkTo enhance understanding of the conventional cyclic beamforming algorithm and the significant contributions of this study, this section is organized as follows. Initially, we explore the connection between propeller noise and cyclic stationarity. Following that, we offer a succinct overview of a classic frequency-domain cyclic algorithm, namely, extended wideband spectral cyclic MUSIC (EWSCM), drawing upon relevant literature (Pokrajac and Vučić, 2010). Finally, we present the definition of the beamforming algorithm based on the power spectrum and modulation spectrum.
2.1 Relationship Between Propeller Noise and Cyclic Stationarity 2.1.1 Physical mechanism of propeller noisePropeller noise stands out as a prominent feature of ship noise, originating from physical processes such as the pressure gradient generated by the rapid rotation of the propeller. This rotation leads to the formation of cavitation bubbles on the blade surface, and the subsequent bursting and expansion of these bubbles result in cavitation noise spanning an exceptionally wide bandwidth of up to 100 kHz. The strength of cavitation is contingent on water pressure, influenced by factors like wake field and water depth. As the propeller blade rotates, periodic changes in water pressure cause modulation in the amplitude of cavitation noise, creating a modulation period equivalent to the propeller period. Consequently, propeller signals are characterized by amplitude-modulated cavitation components resulting from the periodic blade rotation of wideband noise components. Recent studies by Jha et al. (2003) and Jurdic et al. (2009) have demonstrated the effectiveness of cyclostationary analysis in modeling and analyzing propeller noise, particularly in turbulent wake analysis. Notably, modeling propeller noise using stationary stochastic processes is qualitative rather than quantitative. This approach serves the purpose of description rather than prediction, as the model relies on simplifying assumptions.
2.1.2 Mathematical explanation of cyclic stationarityIn the context of cyclostationary signals, distinguishing them from periodic signals exhibiting discontinuous spectral line structures in the frequency domain is crucial. Cyclic stationary signals lack a spectral structure but can generate spectral lines in the frequency domain after processing through a nonlinear system, such as an energy or power spectrum. An example of a cyclic stationary signal is a random amplitude modulation signal, which can be expressed as x(t) = m(t)φ(t) + v(t). Here, m(t) is a modulated function with a cycle period of 2π/Ω, such as propeller rotation, and φ(t) and v(t) are the broadband cavitation noise and background noise, respectively, with distinct SNRs at different frequency bands. Given that propellers typically contain multiple blades, m(t) includes, at least, the propeller shaft frequency and its frequency doubling. Propeller speed and blade number are critical physical quantities in the analysis of underwater acoustic signals. Therefore, m(t) can be expanded as
| $ \begin{equation} \left\{\begin{array}{l} x(t)=\sum\limits_k c_k \phi(t) \mathrm{e}^{i k \Omega t}+v(t) \\ X(\omega)=\sum\limits_k c_k \Phi(\omega-k \Omega)+V(\omega) \end{array}.\right. \end{equation} $ | (1) |
Here the function Φ(ω), X(ω), V(ω) are the frequency spectrum of φ(t), x(t), v(t). A crucial point to consider is that Eq. (1) represents a Fourier series comprising coefficients that are random functions of interrelated times. Besides elucidating the underlying physical mechanism, this equation proves adequate for modeling cyclostationary signals. Additionally, it explicitly reveals the inherent periodicity of cyclostationary signals, contributing to an understanding of their primary statistical properties, as briefly discussed in the following section.
2.1.3 Frequency-domain statisticsIn the analysis of frequency-domain signals, the spectral correlation density serves as a crucial metric that captures the statistical correlation between neighboring spectral components. In this regard, we investigate the spectral correlation density properties of propeller noise as examined by Antoni and Hanson (2012).
| $ \begin{aligned} S_x(\alpha, \omega) & =E\{X(\omega) X(\omega+\alpha)\}=E\left\{\left(\sum{_k} c_k \Phi(\omega-k \Omega)+V(\omega)\right)\left(\sum{_k} c_k \Phi(\omega-k \Omega+\alpha)+V(\omega+\alpha)\right)\right\} \\ & =\sum{_k} \sum{_p} S_{c_k, c_{k-p}}(\omega) \delta_{\alpha-p \Omega}+S_v(\omega) \delta_\alpha\;. \end{aligned} $ | (2) |
The spectral correlation density
| $ \begin{equation} S_{C_k, C_{k-p}}(\omega)=c_k c_{k-p} \Phi(\omega-k \Omega) \Phi(\omega-(k-p) \Omega) \end{equation} $ | (3) |
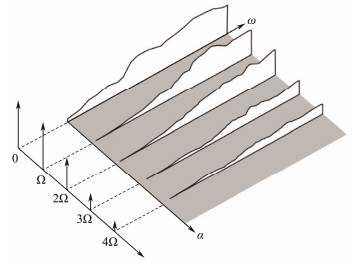
pertains to the modulation of cavitation noise by ckΦ(ω − kΩ) and Ck−pΦ(ω − (k − p)Ω). The Kronecker operator δβ takes a value of 1 when β = 0; 0 otherwise. Fig.1 depicts a typical modulation spectral characteristic of propeller noise. In the context of the spectral correlation density of propeller noise, several salient features warrant attention.
|
Fig. 1 Propeller noise modulation spectrum. |
1) At α = 0, the spectral correlation density reduces to the classical spectral density such that Sx(0, ω) ≡ Sx(ω).
2) The spectral correlation density function is nearly zero over the entire range of values of α, except for multiples of the axial frequency Ω. Specifically, the function is discrete with respect to modulation frequency α and continuous with respect to spectral frequency ω.
3) The effect of static background noise is completely concentrated at the zero cyclic frequency α, so it does not theoretically affect the detection of discrete components along the cyclic frequency axis, even in extremely noisy environments. Even in the more realistic case of nonstationary noise, as long as the noise itself is not cyclostationary, this property remains robust because the spectrally correlated density will propagate nearby α = 0 but will not seriously interfere with the discrete pattern of propeller noise in α.
2.2 Review of the EWSCM AlgorithmsIn the context of a conventional frequency-domain array signal, it is typically assumed that the sensors within the array exhibit identical linear time-invariant responses and are uniformly spaced along a linear axis. The data acquired by each array element can be expressed theoretically as follows:
| $\begin{equation} \underline{\boldsymbol{x}}(f)=\left[x_1(f), x_2(f), \cdots, x_M(f)\right], \end{equation}$ | (4) |
| $\begin{equation} x_m(f)=\sum\limits_{k=0}^K s_k(f) \mathrm{e}^{\frac{j 2 \pi f(m-1) D \sin \theta_k}{c}}+n_m(f) \end{equation}$ | (5) |
| $\begin{equation} \boldsymbol{x}(f)=\boldsymbol{A}(f) \boldsymbol{s}(f)+\boldsymbol{n}(f) \end{equation}$ | (6) |
Here, m denotes the number of elements within the array. The term
| $\begin{equation} \boldsymbol{A}(f)=\left[\boldsymbol{a}_0(f), \boldsymbol{a}_1(f), \cdots, \boldsymbol{a}_{K-1}(f)\right] \end{equation}$ | (7) |
refers to the M × K array steering matrix, where a0(f) and ak(f) is the steering vector for target signal and kth interference signal:
| $\begin{equation} \boldsymbol{a}_k(f)=\left[1, \cdots, \mathrm{e}^{j 2 \pi f(m-1) D \sin \theta_k / c}\right]^{\mathrm{T}} \end{equation}$ | (8) |
Additionally,
| $ \begin{equation} \boldsymbol{n}(f)=\left[n_1(f), \cdots, n_M(f)\right]^{\mathrm{T}} \end{equation}, $ | (9) |
whereas s0 correspond to the target signal with a modulated frequency of α. sk and θk correspond to the kth interference signal and its azimuth estimate, respectively, and T represents transpose. In this context, c denotes the speed of sound, D represents the distance between adjacent sensors, and nm is indicative of the smooth background noise and interference signal.
The EWSCM algorithm is based on the combination of array vectors from two neighboring frequency points to form an extended array vector, followed by the calculation of an extended covariance matrix. The extended covariance matrix has the advantage of containing cyclic covariance matrix components, enhancing its ability to characterize target signals with a specific modulation frequency compared with the traditional covariance matrix.
| $ \boldsymbol{X}_E^\alpha(f)=\left[\begin{array}{l} \boldsymbol{X}(f+\alpha / 2) \\ \boldsymbol{X}(f-\alpha / 2) \end{array}\right]. $ | (10) |
The extended data vector
| $ \begin{equation} \begin{aligned} \boldsymbol{R}_E^\alpha(f) & =E\left[\boldsymbol{X}_E^\alpha(f)\left(\boldsymbol{X}_E^{-\alpha}\right)^{\mathrm{H}}(f)\right] \\ & =\left[\begin{array}{cc} E\left[\boldsymbol{X}\left(f_1\right) \boldsymbol{X}^{\mathrm{H}}\left(f_2\right)\right] & E\left[\boldsymbol{X}\left(f_1\right) \boldsymbol{X}^{\mathrm{T}}\left(f_1\right)\right] \\ E\left[\boldsymbol{X}^*\left(f_2\right) \boldsymbol{X}^{\mathrm{H}}\left(f_2\right)\right] & E\left[\boldsymbol{X}^*\left(f_2\right) \boldsymbol{X}^{\mathrm{T}}\left(f_1\right)\right] \end{array}\right] . \end{aligned} \end{equation}. $ | (11) |
Here H represents conjugate transpose, * represents conjugate. The expanded spectrum cyclic cross-correlation matrix, denoted by
By substituting Eq. (6) into the expression above, we obtain the extended frequency domain cross-correlation matrix
| $ \begin{equation} \begin{aligned} & \boldsymbol{R}_E^\alpha(f)= \\ & {\left[\begin{array}{ll} \boldsymbol{A}\left(f_1\right) & \\ & \boldsymbol{A}^*\left(f_2\right) \end{array}\right]\left[\begin{array}{ll} R_{s s}^\alpha(f) & R_{s s}^\alpha \cdot(f) \\ R_{s s}^{-\alpha}(f) & R_{s s}^{-\alpha^*}(f) \end{array}\right]\left[\begin{array}{ll} \boldsymbol{A}^{\mathrm{H}}\left(f_2\right) & \\ & \boldsymbol{A}^{\mathrm{T}}\left(f_1\right) \end{array}\right]^{\mathrm{H}} .} \end{aligned} \end{equation} $ | (12) |
Eq. (12) is decomposed to estimate the direction of arrival using the space spectrum method based on MUSIC. The form of the space spectrum can be expressed as
| $ \begin{equation} P=\left[\lambda_{\min }\left[\boldsymbol{B}^{\mathrm{H}}(f, \alpha / 2) \boldsymbol{U}_N \boldsymbol{U}_N^{\mathrm{H}} \boldsymbol{B}(f,-\alpha / 2)\right]\right]^{-1} \end{equation}. $ | (13) |
Matrix B is defined as follows, where λmin represents the minimum eigenvalue of the corresponding matrix, and UN denotes the noise subspace of
| $ \begin{equation} \boldsymbol{B}(f, \alpha / 2)=\left[\begin{array}{ll} \boldsymbol{A}(f, \alpha / 2) & \\ & \boldsymbol{A}^*(f,-\alpha / 2) \end{array}\right]. \end{equation} $ | (14) |
Based on our analysis, the EWSCM algorithm differs from the conventional music algorithm in terms of searching the steering vector. The conventional MUSIC algorithm searches the steering vector of only one frequency point, whereas the EWSCM algorithm searches the steering vector of two adjacent frequency points simultaneously. This approach is consistent with our previous analysis.
2.3 Based on the Power Spectrum and Modulation Spectrum Beam AlgorithmTraditional cyclic bearing estimation algorithms primarily rely on subspace estimation. On the one hand, they are constrained by the selection of the hyperparameter of subspace order, and on the other hand, the algorithm's performance may decline in the presence of complete coherence. Beam-based algorithms can circumvent both these issues (Gelli and Izzo, 1992). Therefore, in the subsequent discussion, we predominantly utilize the beam-bearing estimation algorithm.
In contrast to traditional cyclic beamforming algorithms (Wu and Wong, 1996; Markhi et al., 2007; Lee and Huang, 2012), which exhibit performance comparable to that of traditional Capon beamforming (CBF) algorithms due to their frequency-domain correlation, this study introduces power spectrum-based and modulated spectrum-based beam-forming algorithms. These methods process synthesized beam space data obtained through minimum variance distortionless response (MVDR) or CBF, estimating spatial spectral distributions based on either the power spectrum or modulation spectrum.
The power spectrum-based beamforming algorithm analyzes the spatial angle distribution of the power spectrum, whereas the modulation spectrum-based beamforming algorithm scrutinizes the energy distribution of specific modulation spectra in the synthesized beam space data.
3 Wideband Cyclic MVDR AlgorithmThis section introduces a novel wideband cyclic beamforming algorithm named WCMVDR, designed to enhance the algorithm's robustness and computational efficiency in low SNR scenarios. To achieve these goals, the algorithm omits the extended cyclic covariance matrix and instead employs the original cyclic covariance matrix and its variance. The physical implications of this approach are also thoroughly analyzed.
Based on Eq. (6), the cyclic covariance matrix can be represented as
| $ \begin{aligned} &\begin{aligned}\\ &\boldsymbol{R}_{x \alpha}(f)=E\left[\boldsymbol{x}(f) \boldsymbol{x}^{\mathrm{H}}(f+\alpha)\right]\\ & =\boldsymbol{A}(f) E\left[\boldsymbol{s}(f) \boldsymbol{s}^{\mathrm{H}}(f+\alpha)\right] \boldsymbol{A}^{\mathrm{H}}(f+\alpha)+E\left[\boldsymbol{n}(f) \boldsymbol{n}^{\mathrm{H}}(f+\alpha)\right] \\ & \approx \boldsymbol{A}(f) E\left[\boldsymbol{s}(f) \boldsymbol{s}^{\mathrm{H}}(f+\alpha)\right] \boldsymbol{A}^{\mathrm{H}}(f+\alpha), \end{aligned} \end{aligned} $ | (15) |
where x(f) represents the signal vector at frequency f, A(f) is the steering matrix, and E[n(f)nH(f + α)] ≈ 0 is because noise is not cyclostationary. The cyclic covariance matrix Rxα(f) differs from the traditional covariance matrix in that it is asymmetric. Therefore, certain analyses concerning the covariance matrix require modifications in this context.
In the context of covariance matrices, the eigenvectors correspond to the direction of the signal sources, whereas the eigenvalues correspond to the energy of the signal. In this study, we perform feature decomposition of the traditional covariance matrix and obtain the following approximate expression by default:
| $ \begin{equation} \begin{aligned} \boldsymbol{R}_x & =E\left\{\boldsymbol{x} \boldsymbol{x}^{\mathrm{H}}\right\}=\boldsymbol{U}_s \boldsymbol{\Sigma}_s \boldsymbol{U}_s^{\mathrm{H}}+\boldsymbol{U}_n \boldsymbol{\Sigma}_n \boldsymbol{U}_n^{\mathrm{H}} \\ & =\boldsymbol{A}(f) \boldsymbol{R}_s \boldsymbol{A}^{\mathrm{H}}(f)+\boldsymbol{U}_n \boldsymbol{\Sigma}_n \boldsymbol{U}_n^{\mathrm{H}} . \end{aligned} \end{equation}. $ | (16) |
This paragraph discusses the components of the covariance matrix and their respective relationships. The covariance matrix, denoted by Rx, is computed from the received signal vector x in an array. The signal subspace is characterized by its eigenvectors Us and eigenvalues Σs, whereas the noise subspace is represented by its eigenvectors Un and eigenvalues Σn. A diagonal matrix Rs is associated with the target energy, and its size is equivalent to the number of targets. The direction of each target is represented by the matrix A.
Considering the frequency domain correlation and matrix asymmetry, the left and right eigenvectors are significant physical quantities for the cyclic covariance matrix compared with the eigenvectors. Therefore, the singular value decomposition (SVD) of the cyclic covariance matrix can be approximated as follows:
| $ \begin{equation} \begin{aligned} \boldsymbol{R}_{x \alpha}(f) & =E\left\{\boldsymbol{x}(f) \boldsymbol{x}^{\mathrm{H}}(f+\alpha)\right\}=\boldsymbol{U}_s \boldsymbol{\Sigma}_s \boldsymbol{V}_s^H+\boldsymbol{U}_n \boldsymbol{\Sigma}_n \boldsymbol{V}_n^H \\ & =\boldsymbol{A}(f) \boldsymbol{R}_{s \alpha}(f) \boldsymbol{A}^{\mathrm{H}}(f+\alpha)+\boldsymbol{U}_n \boldsymbol{\Sigma}_n \boldsymbol{V}_n^{\mathrm{H}}. \end{aligned} \end{equation} $ | (17) |
The received array vector at frequency point f is denoted by x(f). The left eigenvectors, eigenvalues, and right eigenvectors of the cyclic covariance matrix are important physical quantities. The SVD of the cyclic covariance matrix can be approximated as
| $ \begin{equation} \boldsymbol{R}_{s \alpha}(f)=\operatorname{diag}\left(s(f) s^{\mathrm{H}}(f+\alpha)\right) \end{equation}, $ | (18) |
where Rsα(f) is a diagonal matrix with dimensions of the source number whose frequency modulation is α. Although cyclic stationarity offers better target discrimination and can accurately detect specific targets among multiple targets in theory owing to the physical mechanism of propeller noise, the SNR of cyclostationary signals is weaker than that of power spectrum characteristics when compared with background noise. Consequently, under low SNR and few snapshot conditions, the orthogonality of Vn and A(f + α) remains doubtful.
Given the difficulty in estimating the signal noise subspace under low SNR and limited snapshots, a beamforming method is preferred over subspace estimation to estimate target orientation. In this regard, we investigate the relationship between eigenvectors and eigenvalues using MVDR and a traditional covariance matrix.
The constrained optimization problem of the MVDR can be expressed as follows:
| $ \begin{equation} \min \boldsymbol{\varepsilon}=\boldsymbol{w}^{\mathrm{H}} \boldsymbol{R}_x \boldsymbol{w} \text { s.t. } \boldsymbol{a}_0^{\mathrm{H}} \boldsymbol{w}=1 \end{equation}. $ | (19) |
Here s.t. represents subject to. To enhance the accuracy of azimuth estimation, the MVDR algorithm minimizes the power spectrum of the synthesized signal by attenuating interference while ensuring a target direction response of unity. This quadratic optimization problem enables easy calculation of the weight vector, expressed as
| $ \begin{equation} \boldsymbol{w}=\boldsymbol{R}_x^{-1} \boldsymbol{a}_0 /\left(\boldsymbol{a}_0^{\mathrm{H}} \boldsymbol{R}_x^{-1} \boldsymbol{a}_0\right) \end{equation}. $ | (20) |
The spatial distribution of the spectral distribution can be represented by this method.
| $ \begin{equation} \boldsymbol{\varepsilon}=1 /\left(\boldsymbol{a}_0^{\mathrm{H}} \boldsymbol{R}_x^{-1} \boldsymbol{a}_0\right) \end{equation}. $ | (21) |
We substitute Eq. (17) into Eq. (21) and use the orthogonality between the noise and signal subspaces to express the inverse matrix as
| $ \begin{equation} \boldsymbol{R}_x^{-1}=\boldsymbol{A}(f) \boldsymbol{R}_s^{-1} \boldsymbol{A}^{\mathrm{H}}(f)+\boldsymbol{U}_n \boldsymbol{\Sigma}_n^{-1} \boldsymbol{U}_n^{\mathrm{H}} . \end{equation} $ | (22) |
Given the relatively large eigenvalues of Rs compared with those of Σn, Rs-1 is much smaller than Σn-1. The eigenvalues of the matrix represent the response of the array algorithm to different directions, where Rx-1 has a lower response to the target direction than other unrelated directions. However, Rs-1 is in the denominator of the weight vector calculation, so the response of the spatial spectrum distribution in the target direction increases significantly.
For the cyclic beamforming algorithm and cyclic covariance matrix, the constrained optimization problem differs from that of MVDR. The optimization of the cyclic beamforming algorithm subject to constraints can be expressed as
| $ \begin{equation} \begin{aligned} \max _{w(f), w(f+\alpha)} & \boldsymbol{w}^{\mathrm{H}}(f) E\left\{\boldsymbol{x}(f) \boldsymbol{x}^{\mathrm{H}}(f+\alpha)\right\} \boldsymbol{w}(f+\alpha) \\ \text { s.t. } & \left\{\begin{array}{l} \boldsymbol{w}^{\mathrm{H}}(f) \boldsymbol{w}(f)=1 \\ \boldsymbol{w}^{\mathrm{H}}(f+\alpha) \boldsymbol{w}(f+\alpha)=1 \end{array}\right. \end{aligned} \end{equation}. $ | (23) |
Eq. (23) can be solved by maximizing the subsequent expression using the Lagrange multiplier approach.
| $ \begin{equation} F_c(\omega, c)=\boldsymbol{w}^{\mathrm{H}} \boldsymbol{R}_{x \alpha} c c^{\mathrm{H}} \boldsymbol{R}_{x \alpha}^{\mathrm{H}} \boldsymbol{w}-\mu\left(\boldsymbol{w}^{\mathrm{H}} \boldsymbol{w}-1\right)-\mu^{\prime}\left(c^{\mathrm{H}} \boldsymbol{c}-1\right) \end{equation}. $ | (24) |
In Eq. (24), Rxα = E{x(f)xH(f + α)}, c = w(f + α) and w = w(f), and μ and μ' represent the Lagrange multipliers. By differentiating the equation with respect to w and c and equating the derivatives to zero, we obtain the following expression:
| $ \begin{equation} \left\{\begin{array}{l} \boldsymbol{R}_{x \alpha} \boldsymbol{c} \boldsymbol{c}^{\mathrm{H}} \boldsymbol{R}_{x \alpha}^{\mathrm{H}} \boldsymbol{w}=\mu \boldsymbol{w} \\ \boldsymbol{R}_{x \alpha}^{\mathrm{H}} \boldsymbol{w} \boldsymbol{w}^{\mathrm{H}} \boldsymbol{R}_{x \alpha} \boldsymbol{c}=\mu^{\prime} \boldsymbol{c} \end{array}\right. \end{equation} . $ | (25) |
By simplifying and solving Eq. (25), the following expression can be obtained:
| $ \begin{equation} \left\{\begin{array}{l} \boldsymbol{R}_{x \alpha} \boldsymbol{R}_{x \alpha}^{\mathrm{H}} \boldsymbol{w}=v \boldsymbol{w} \\ \boldsymbol{R}_{x \alpha}^{\mathrm{H}} \boldsymbol{R}_{x \alpha} \boldsymbol{c}=v^{\prime} \boldsymbol{c} \end{array}\right. \end{equation}. $ | (26) |
According to theory, the optimal weight vectors w and c should correspond to the left and right principal eigenvectors of the cyclic covariance matrix Rxα. In traditional blind CBF (Wu and Wong, 1996), the weight vector degenerates into the steering vector of CBF as the number of snapshots increases. This paper aims to improve the performance of the proposed algorithm by analyzing this feature from the perspective of beamforming and azimuth estimation.
The use of the traditional cyclic beamforming algorithm in the beamforming domain faces a major challenge, which is the asymmetric nature of the cyclic covariance matrix. Therefore, the algorithm requires the estimation of the weight vector for two frequency points. To overcome this challenge, we focus solely on the left eigenvector of the cyclic covariance matrix. As indicated by Eq. (26), this approach can halve the frequency point required. Consequently, we can solve this issue by multiplying the cyclic covariance matrix by its conjugate transpose.
| $ \begin{equation} \left\{\begin{array}{l} \boldsymbol{R}_{x \alpha}=\boldsymbol{U} \boldsymbol{S} \boldsymbol{V}^{\mathrm{H}}=\boldsymbol{A}(f) \boldsymbol{R}_{s \alpha}(f) \boldsymbol{A}^{\mathrm{H}}(f+\alpha)+\boldsymbol{U}_n \boldsymbol{S}_n \boldsymbol{V}_n^{\mathrm{H}} \\ \boldsymbol{R}_{x \alpha} \boldsymbol{R}_{x \alpha}^{\mathrm{H}}=\boldsymbol{U} \boldsymbol{S} \boldsymbol{V}^{\mathrm{H}} \boldsymbol{V} \boldsymbol{S}^{\mathrm{H}} \boldsymbol{U}^{\mathrm{H}}=\boldsymbol{U} \boldsymbol{S} \boldsymbol{S}^{\mathrm{H}} \boldsymbol{U}^{\mathrm{H}} \\ \quad=\boldsymbol{A}(f) \boldsymbol{R}_{s \alpha}(f) M \boldsymbol{R}_{s \alpha}^{\mathrm{H}}(f) \boldsymbol{A}^{\mathrm{H}}(f)+\boldsymbol{U}_n \boldsymbol{S}_n \boldsymbol{S}_n^{\mathrm{H}} \boldsymbol{U}_n^{\mathrm{H}} \end{array}\right. \end{equation}, $ | (27) |
where M is the scalar representing the number of arrays, and
The conventional cyclic beamforming algorithm faces a challenge in the beam space due to the asymmetry of the cyclic covariance matrix, requiring the estimation of weight vectors at two different frequency points. However, by analyzing only the left eigenvector of the cyclic covariance matrix, as per Eq. (27), the required frequency can be halved. To address this issue, a feasible approach is to multiply the cyclic covariance matrix by its own conjugate transpose, yielding a new matrix representing the variance of the traditional cyclic covariance matrix. On the one hand, the eigenvector of this matrix corresponds to the same concept as the traditional MVDR, denoting the orientation vector A(f) of the target. On the other hand, the definition of the eigenvalue differs from MVDR, representing the modulation spectrum energy of the source at the modulation frequency α rather than the power spectrum energy. Consequently, this novel algorithm is suitable for the direction detection of specific targets.
This paper introduces a novel approach to address the challenges associated with the use of the cyclic beamforming algorithm in the frequency domain, specifically in the context of underwater acoustic signals. One of the main difficulties in this area is obtaining sufficient snapshots for the analysis of underwater acoustic cyclostationary signals. To address this issue, this study proposes a frequency domain statistical averaging technique. Owing to the characteristics of propeller noise, which is a component of ship noise and has a rotation period much longer than that of digitally modulated signals, the increment number of snapshots in time is limited. Additionally, as the propeller noise contains more than cyclostationary components, the use of a cyclic covariance matrix in short snapshots for azimuth estimation can result in numerous miscellaneous peaks in the spatial spectrum. Thus, the proposed approach effectively improves the performance of the algorithm by statistically averaging the covariance matrix variance of adjacent frequency bands while keeping the number of snapshots unchanged.
The main focus of this study is to discuss the cyclic covariance matrix, its significance in the cyclic beamforming algorithm, and the rationale for statistically averaging the covariance matrix of adjacent frequency bands. In the subsequent section, we detail the methodology employed in the proposed algorithm.
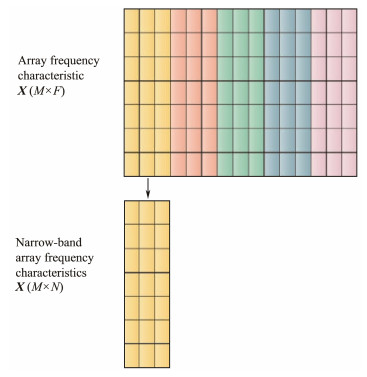
Initially, the received array signal is Fourier transformed to derive the array frequency characteristic XM×F. As depicted in Fig.2, this signal comprises M array elements and F frequency points. Next, the array frequency vector is partitioned into L narrow array frequency bands XM×N, where N = F/L.
|
Fig. 2 Array frequency characteristic. |
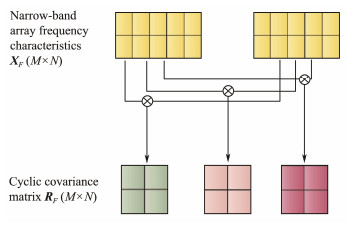
The obtained narrow band array frequency characteristic column vector is denoted as x(f) with a known modulation frequency of α. As illustrated in Fig.3, the cyclic covariance matrix of the frequency point is computed by multiplying the conjugate transpose of each column vector and its adjacent column vector by α. Specifically, R1(f) and R2(f) are calculated as
| $ \begin{equation} \left\{\begin{array}{l} \boldsymbol{R}_1(f)=\boldsymbol{x}(f) \boldsymbol{x}^{\mathrm{H}}(f+\alpha) \\ \boldsymbol{R}_2(f)=\boldsymbol{x}(f) \boldsymbol{x}^{\mathrm{H}}(f-\alpha) \end{array}\right. \end{equation}. $ | (28) |
|
Fig. 3 Cyclic covariance matrix. |
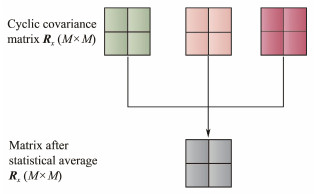
The features acquired from statistical averaging are obtained by averaging the cyclic covariance matrices derived for all frequency points within a narrow band. In particular, the cyclic covariance matrix of the frequency point is obtained by multiplying the conjugate transpose of each column vector and its adjacent column vector by α. Statistical averaging is performed by summing the cyclic covariance matrices obtained for all frequency points in the narrow band, which is depicted in Fig.4. Mathematically, this process can be expressed as
| $ \begin{equation} \boldsymbol{R}_x=\sum\limits_{n=0}^N \boldsymbol{R}_1\left(f_n\right)+\sum\limits_{n=0}^N \boldsymbol{R}_2\left(f_n\right) . \end{equation} $ | (29) |
|
Fig. 4 Statistical mean cyclic covariance matrix. |
The resulting new covariance matrix is obtained by multiplying the cyclic covariance matrix, which is statistically averaged by Eq. (27), with its own conjugate transpose. This matrix is expressed as
| $ \begin{equation} \boldsymbol{R}=\boldsymbol{R}_x \boldsymbol{R}_x^{\mathrm{H}}. \end{equation} $ | (30) |
The newly obtained covariance matrix is subjected to constrained optimization, taking into account the significance of its eigenvalues and eigenvectors in accordance with Eq. (27). This leads to the calculation of its spatial spectral distribution using a constrained optimization method. The corresponding constrained optimization conditions and power spectrum distribution can be derived based on Eqs. (19) and (21).
| $ \begin{equation} \min \varepsilon=\boldsymbol{w}^{\mathrm{H}} \boldsymbol{R} \boldsymbol{w} \text { s.t. } \boldsymbol{a}_0^{\mathrm{H}} \boldsymbol{w}=1, \end{equation} $ | (31) |
| $ \begin{equation} \varepsilon=1 /\left(\boldsymbol{a}_0^{\mathrm{H}} \boldsymbol{R}^{-1} \boldsymbol{a}_0\right) \end{equation} . $ | (32) |
Considering Eq. (27), the theoretical peak value should only appear at the target location with a specific modulation frequency, suppressing the response of other interfering signals in the noise direction.
4 ExperimentsThis section primarily focuses on devising experiments to assess the performance disparities between the proposed algorithm and its conventional counterpart. It is delineated into two distinct segments. The initial segment involves the experimental setup, which encompasses selecting datasets, defining evaluation indices, and determining the algorithm along with its associated hyperparameters. The subsequent sections explore the practical application scenarios, evaluating the performance differences among various algorithms in three diverse contexts and providing an analysis of the underlying reasons.
4.1 Experimental SettingThis paper focuses on conducting comparative experiments under three distinct data conditions:
1) Pure Simulation Data (sin-data): This condition represents an ideal scenario primarily used to assess the performance variations among different algorithms under ideal conditions. The target signal comprises band-pass white noise modulated by a sine wave. The carrier frequencies for the two targets are 3 and 5 Hz, respectively. The frequency band of the band-pass white noise ranges from 500 to 550 Hz, with a sampling rate of 2000 Hz. The two targets are positioned at 28˚ and 34˚ for shorter distances and 28˚ and 134˚ for longer distances in the experiment. The incident mode of the array is set as a plane wave. Additional parameters include 10 arrays, a 4-s frame length, 10 snapshots, identical amplitudes for both targets, an array SNR of 5 dB, a sound speed of 1485 m s−1, and an array spacing of 0.37 m.
2) Acoustic Field Simulation Array Metadata Based on Actual Data: These data conditions mirror real-life situations and are used to evaluate the performance disparities of different algorithms in situations close to reality. Actual data are input into the array via sound field simulation software, with unspecified multipath and background noise. As indicated, both targets include propeller noise components with shaft frequencies of 1.2 and 1.5 Hz, respectively. The cavitation noise covers the full frequency band with a sampling rate of 5000 Hz. Initially positioned at 270˚, the two targets gradually separate, one remaining at 270˚, while the other moving closer to 230˚. This dataset comprises 128 arrays and a 10-s frame length.
3) Partial Coherent Data: Derived from pure simulation data, this dataset features a diffused sound source with added width. The primary purpose of this study is to compare the performance distinctions between subspace and beam algorithms under strong coherence conditions. The angle distribution of the sound source gradually transitions from a plane wave incident to an angle width ranging from 1˚ to 30˚. The target signal parameters align with pure simulation data, except for the center frequency, which ranges from 900 to 950 Hz.
In this study, evaluation indicators comprise the directivity index (DI) and root mean square error (RMSE). DI characterizes the directivity index of the beam algorithm, representing the mean energy ratio of all directions within the anticipated direction. RMSE signifies the estimation bias of the beam algorithm, calculated as the square root of the average squared difference between the actual and estimated locations.
During experiments with actual data, the target signal energy significantly differed from the interference signal energy. To prevent DI from consistently yielding a value of 0, a modified definition was adopted. This definition calculates the mean energy ratio over approximately a 5˚ span within the desired direction rather than across the entire target direction.
Regarding the selection of comparison algorithms, CBF and MVDR were chosen on the basis of power spectrum analysis. The diagonal loading weighting factor of MVDR was set at 1/1000 of the covariance matrix trace. Furthermore, modulation spectrum analysis was conducted using headspace data obtained from the CBF and MVDR. For comparison, the traditional cyclic MUSIC algorithm employed EWSCM. Subspace decomposition utilized a target number equivalent to 1.
4.2 Experimental Results 4.2.1 Simulation data scenarios 4.2.1.1 Experimental designThe simulation data depict the performance of the algorithm under ideal conditions. This dataset primarily focuses on comparing the bearing estimation capability and computational requirements of the algorithm for two targets across varying snapshot numbers and distances. In experiments with closely positioned targets, our investigation centers on the target discrimination and interference suppression abilities of different algorithms in azimuth estimation tasks. Conversely, for experiments covering long distances, our primary concern is the unbiasedness and directivity of different algorithms in the bearing estimation task. Additionally, we provide a comprehensive statistical table detailing the total computational workload.
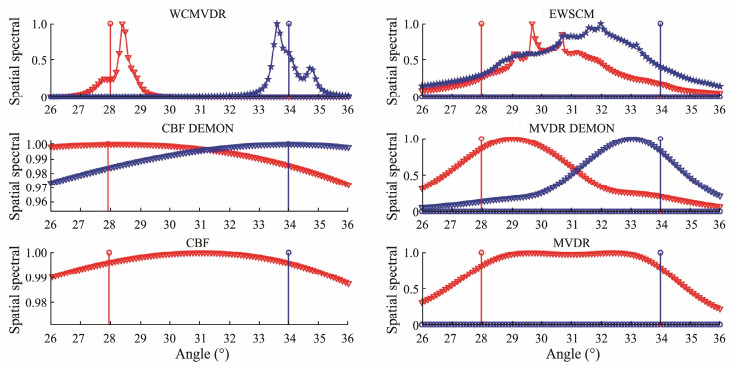
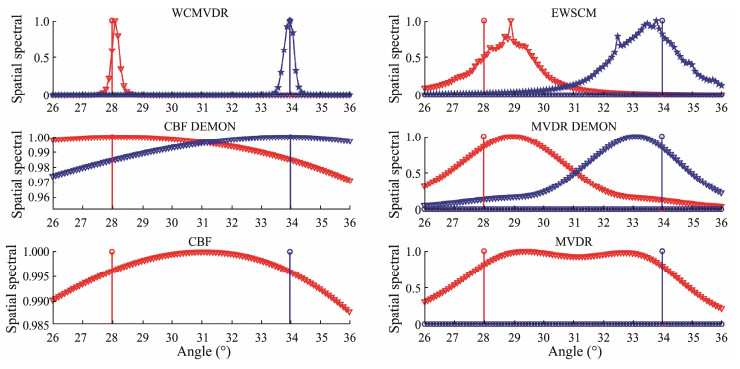
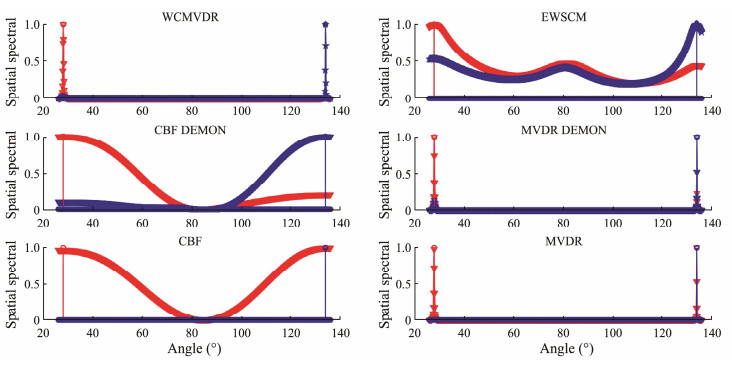
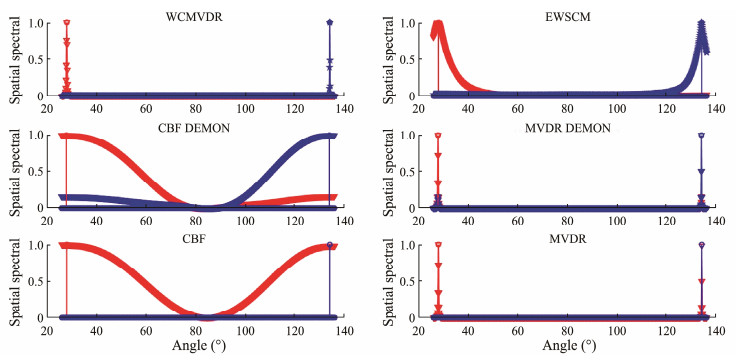
In the spatial spectral distribution, as illustrated in Figs.5 – 8, the red and blue vertical lines correspond to the actual positions of targets 1 and 2, respectively. The red and blue dashed lines depict the spatial spectral distribution of the cyclic beam algorithm at 3 and 5 Hz, respectively, representing the anticipated modulation frequencies. CBF and MVDR algorithms, relying solely on power spectrum analysis, use red lines exclusively to illustrate the spatial spectral distribution due to their lack of target selectivity. The culmination of azimuthal estimation results is presented in Tables 1 and 2, whereas Table 3 details the computational loads.
|
Fig. 5 Spatial spectral distribution of the close target algorithm obtained with few snapshots. |
|
Fig. 6 Spatial spectral distribution of the close target algorithm obtained with many snapshots. |
|
Fig. 7 Spatial spectral distribution of the distant target algorithm is obtained using a few snapshots. |
|
Fig. 8 Spatial spectral distribution of the distant target algorithm is obtained using many snapshots. |
|
|
Table 1 Comparative DI across various scenarios |
|
|
Table 2 Comparative RMSE across various scenarios |
|
|
Table 3 Comparative calculation times across various scenarios |
In our experimental design, we primarily focus on assessing target discrimination and interference suppression capabilities among various algorithms in the azimuth estimation task during close-range experiments. Close-range targets, falling below the Rayleigh limit, lack target selectivity and exhibit an average positioning deviation (RMSE) of 3.0˚, approximately half the distance between the targets. MVDR demonstrates a slight improvement in positioning deviation (RMSE), achieving an optimal value of 1.35˚. However, its performance in the DI is poor, registering an optimal value of only 0.1121 dB, considerably lower than the DI of single-target MVDR under identical conditions. This discrepancy indicates insufficient differentiation among the targets. Consequently, the modulated spectrum-based beam-forming algorithm notably enhances performance. The modulated spectrum-based CBF algorithm shows a reduced position deviation (RMSE) from 2.9˚ to 0.25˚ while maintaining a high DI, primarily owing to its interference reduction capability, although it fails to enhance directivity toward individual objects. Introducing an MVDR based on the modulation spectrum improves its RMSE from 0.24˚ to 0.95˚. However, the MVDR algorithm based on the modulation spectrum operates as a cascade system, treating spatial filtering and feature analysis as independent modules. Although interference components are eliminated in subsequent feature analysis, spatial filtering bias due to closely situated targets remains uncompensated. To address this issue, we introduce a cyclic beam algorithm for joint space-frequency analysis. Both the proposed cyclic beam algorithm WCMVDR and the traditional cyclic beam algorithm EWSCM exhibit promising performance in RMSE and DI. Notably, EWSCM demonstrates unstable performance at low snapshots but effectively achieves target differentiation at higher snapshots. Ultimately, in this study, WCMVDR showcases optimal performance across various snapshots and indicators, achieving an RMSE of 0.05˚ and a DI of 1.4180 dB.
In another series of experiments involving longer distances, our primary focus is on exploring the unbiasedness and interference suppression capacities of different algorithms in the bearing estimation task. In this scenario, the impact of the interference on the target is negligible, rendering the experiment similar to a single-object detection task. Initially, all algorithms exhibit an RMSE below 0.5˚, indicating their essentially unbiased nature. Unlike CBF + DEMON and MVDR + DEMON, which show energy spikes in the interference direction due to a sequence of beaming and subsequent feature analysis, the standard cyclic beam algorithms WCMVDR and EWSCM display minimal energy spikes in the interference direction, confirming the effectiveness of the standard cyclic beam algorithm. Finally, MVDR and WCMVDR demonstrate similar mainlobe widths in distant target experiments concerning the DI.
Considering computational complexity, CBF emerges as the fastest algorithm across all application scenarios, with WCMVDR and MVDR exhibiting comparable computational speeds. The traditional cyclic azimuth estimation algorithm EWSCM, having two times the degrees of freedom compared with WCMVDR, significantly prolongs the calculation time. Finally, the power spectrum-based beam synthesis algorithm requires extended computation time due to considerations of overlap retention between frames and the reconstructed time-domain signal. Consequently, there exists a practical limit to the number of snapshots in real-world applications.
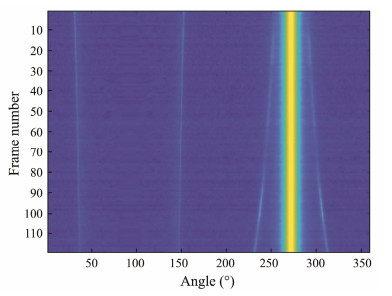
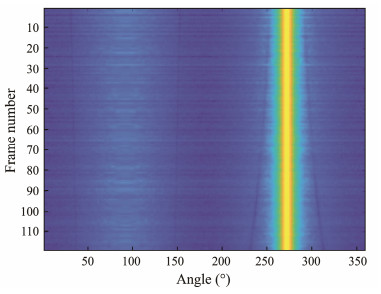
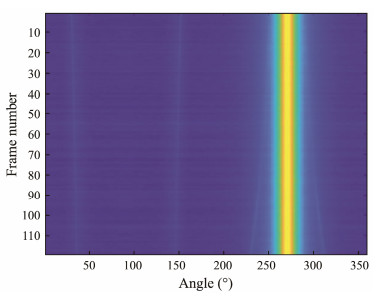
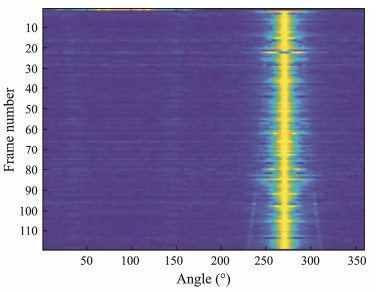
4.2.2 Real data scenarios 4.2.2.1 Experimental designThe second set of simulation experiments aims to replicate algorithm performance more closely to real-world scenarios. In this dataset, our primary focus is to assess the capability of the algorithm to extract weak targets amid varying degrees of strong interference signals. Due to the absence of known true target bearings, angle estimation bias measurement remains unattainable. Therefore, in this experiment, our sole evaluation index is the DI. Additionally, given the considerably weaker energy of the target compared with the interference signal, to better evaluate the significance of the weak target, we narrowed the comparison window length of DI to a 5˚ radius around the anticipated angle from all perspectives. Furthermore, in these experiments, owing to the rapid maneuvering capability of the target, the available snapshots of the algorithm in the time domain are limited. This scenario closely mimics environments with fewer snapshots.
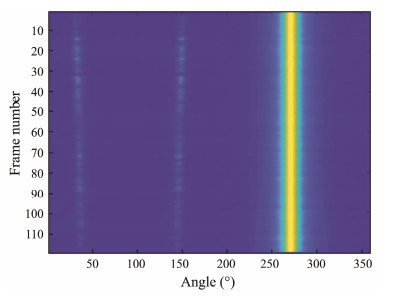
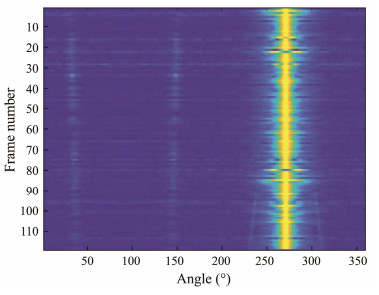
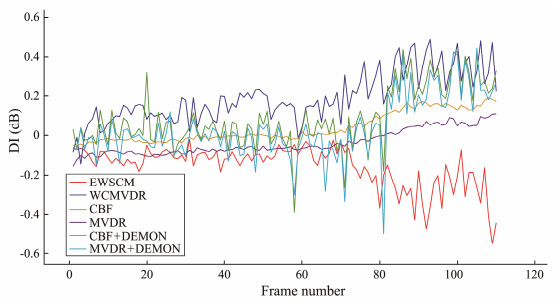
4.2.2.2 Experimental results and analysisThe trajectory history diagrams for various algorithms are illustrated in Figs.9 – 14, while Fig.15 presents a comparison of their directivity index (DI). The proposed WCMVDR algorithm demonstrates an optimal DI of 0.1943 dB. Consequently, in comparison with other algorithms, its trajectory history diagram exhibits enhanced clarity. Although CBF based on the power spectrum maintains the most stable directivity distribution at 0.0367 dB, it also shows greater volatility.
|
Fig. 9 Trajectory history diagram based on the WCMVDR. |
|
Fig. 10 Trajectory history diagram based on the EWSCM. |
|
Fig. 11 Trajectory history diagram based on the power spectral CBF. |
|
Fig. 12 Trajectory history diagram of the CBF algorithm based on the modulation spectrum. |
|
Fig. 13 Trajectory history diagram based on the power spectrum MVDR. |
|
Fig. 14 Trajectory history diagram of the MVDR algorithm based on the modulation spectrum. |
|
Fig. 15 Temporal variation in directivity index for beamforming algorithms in proximity to self-noise target. |
The traditional cyclic subspace algorithm EWSCM faces limitations related to the SNR and the number of fast beats. On actual data, the algorithm struggles to accurately estimate the signal subspace, resulting in a DI of only −0.1567 dB. Notably, the performance improvement of the WCMVDR algorithm proposed in this paper is substantial, showing an 81% (from 0.0367 dB to 0.1934 dB) and 181% (from −0.1567 dB to 0.1934 dB) enhancement compared with traditional CBF and EWSCM, respectively.
In scenarios where two targets are distant from each other (80 – 119 frames), the proposed WCMVDR algorithm achieves a DI of 0.34 dB, signifying a notable 58% enhancement over the traditional CBF algorithm which is 0.15 dB. Additionally, in this scenario, the CBF algorithm based on the modulation spectrum displays a 47% performance increase compared with its power spectrum-based counterpart. The MVDR algorithm based on the modulation spectrum which is 0.22 dB, demonstrates a 32% improvement over the CBF algorithm based on the power spectrum. Overall, all three cyclic beam algorithms exhibit superior weak target extraction abilities compared with the traditional CBF algorithm in this scenario, with the algorithm designed in this paper demonstrating the most pronounced performance improvement.
Analyzing scenarios where two targets are close to each other (1– 79 frame), which corresponds to 10 to 790 seconds of signal, the proposed algorithm achieves a performance of 0.18 dB, marking an 86% improvement over the traditional CBF algorithm, which is −0.005 dB. Interestingly, the CBF and MVDR algorithms based on the modulation spectrum showcase a 62% (from −0.005 dB to 0.0173 dB) and −66% (from −0.005 dB to −0.0305 dB) performance improvement, respectively, compared with the traditional CBF algorithm. Notably, the MVDR algorithm based on the power spectrum demonstrates decreased performance, and both beam algorithms based on the modulation spectrum exhibit higher performance fluctuations than those observed at longer distances. This might stem from excessively strong interference targets and an insufficient number of snapshots, leading to an influx of interference components in the beam synthesis algorithm. Consequently, robustness and overall performance decline. However, the algorithm proposed in this paper remains optimal in this application scenario.
Furthermore, the traditional cyclic subspace algorithm EWSCM and MVDR algorithm based on the power spectrum both exhibit lower performance compared with CBF at various distances. This highlights their inability to accurately differentiate between target and interference signals, even with a limited number of fast shots and a low SNR. This observation aligns with the earlier conclusion drawn from the pure simulation data experiment, where the performance of EWSCM diminished under low SNR conditions.
4.2.3 Coherent signal data scenario 4.2.3.1 Experimental designThe third set of simulation experiments primarily focuses on discerning the disparities between beamand subspace-like algorithms in the presence of coherent signals. In an ideal scenario, subspace algorithms, such as the MUSIC algorithm, exhibit commendable resolution. However, subspace algorithms face challenges in distinguishing signal subspace from noise subspace, especially in cases involving coherent signals, such as diffusive sound sources. Consequently, some signal subspace components diffuse into the noise subspace, ultimately diminishing algorithm performance. In contrast, beam algorithms display greater resilience to diffuse sound sources because of their uniform signal analysis. This experiment quantifies the coherence of the signal by considering the width of the diffusing sound source. Within the algorithmic domain, a comparison is drawn between the beam-based MVDR algorithm and the subspace-based MUSIC algorithm, as well as between the cyclic beam-based WCMVDR algorithm and the cyclic subspace-based EWSCM algorithm under power spectrum conditions.
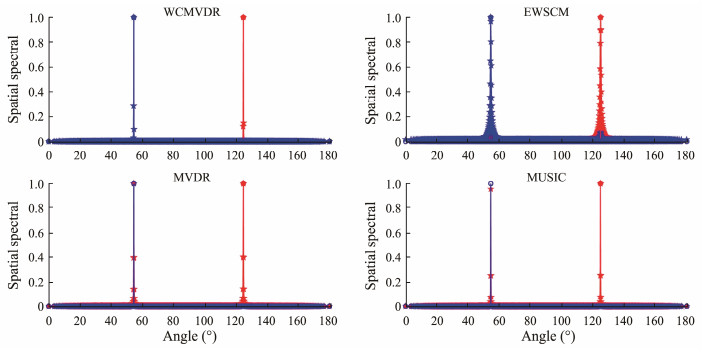
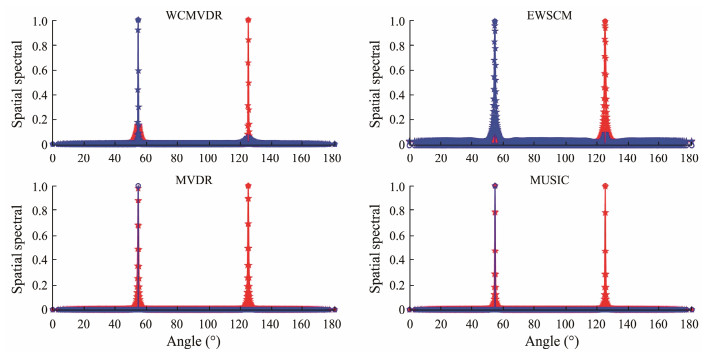
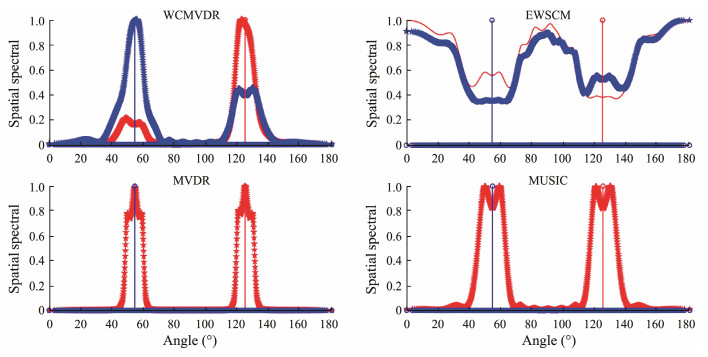
4.2.3.2 Experimental results and analysisFigs.16 – 18 depict comparative results for each algorithm at different coherence levels, complemented by corresponding algorithmic performance summarized in Tables 4 and 5. These observations reveal a significant decline in the performance of most algorithms as coherence increases. Notably, the beam-based MVDR and WCMVDR algorithms exhibit greater robustness compared with the subspace-based MUSIC and EWSCM algorithms with increased coherence.
|
Fig. 16 Spatial spectral distribution of the different algorithms in the absence of coherent signals. |
|
Fig. 17 Spatial spectral distribution of the different algorithms in the presence of low-coherence signals. |
|
Fig. 18 Spatial spectral distribution of the different algorithms in the presence of high-coherence signals. |
|
|
Table 4 Estimated bias RMSE of algorithms in coherent noise |
|
|
Table 5 Estimated bias DI of algorithms in coherent noise |
Concerning power spectrum-based algorithms, signal coherence primarily impacts estimation bias. The subspace-based MUSIC algorithm, with improved coherence, shows false alarms due to signal subspace leakage into the noise subspace. Consequently, when the guidance vector and noise subspace become orthogonal, the deviation leads to false alarms. However, as the beam-based algorithm does not differentiate between noise and signal subspaces, its performance remains consistently superior in terms of RMSE compared with the WCMVDR algorithm proposed in this paper.
In the case of the cyclic beam algorithm WCMVDR and the cyclic subspace EWSCM, signal coherence predominantly affects the DI. As the coherence level increases, the DI of EWSCM rapidly diminishes, eventually losing its discriminative capability entirely. This highlights the heightened sensitivity of the extended subspace algorithm EWSCM to coherence levels owing to its doubled dimension.
5 ConclusionsThis work introduces a novel algorithm inspired by the traditional cyclic beamforming algorithm. The proposed method involves reanalyzing the variance statistical average of the cyclic covariance matrix across frequency bands, resulting in significantly enhanced robustness and computation speed. Specifically, the algorithm demonstrates improved performance, achieving gains of 0.8 dB in the pure simulation target and 0.3 dB in the actual target. In contrast to conventional beam-first and feature-second analysis methodologies, this paper adopts an approach that integrates feature analysis and beamforming. This novel approach is anticipated to further enhance algorithm performance by enabling a more comprehensive understanding of the underlying features.
AcknowledgementsThis research is supported by the IOA Frontier Exploration Project (No. ZYTS202001), and the Youth Innovation Promotion Association CAS.
Agee, B. G., Shell, S. V., and Gardner, W. A., 1990. Spectral self-coherence restoral: A new approach to blind adaptive signal extraction using antenna arrays. Proceedings of the IEEE, 78(4): 753-767. DOI:10.1109/5.54812 (  0) 0) |
Antoni, J., and Hanson, D., 2012. Detection of surface ships from interception of cyclostationary signature with the cyclic modulation coherence. IEEE Journal of Oceanic Engineering, 37(3): 478-493. DOI:10.1109/JOE.2012.2195852 (  0) 0) |
Chargé, P., and Wang, Y., 2005. A root-music-like direction finding method for cyclostationary signals. EURASIP Journal on Advances in Signal Processing, 2005(1): 1-5. (  0) 0) |
Chargé, P., Wang, Y., and Saillard, J., 2003. An extended cyclic music algorithm. IEEE Transactions on Signal Processing, 51(7): 1695-1701. DOI:10.1109/TSP.2003.812834 (  0) 0) |
Cheng, Y. S., Gao, X., and Liu, H., 2010. A method for ship propeller blade-number recognition based on template matching. Technical Acoustics/Shengxue Jishu, 29(2): 228-231. (  0) 0) |
Cheng, Y. S., Wang, S., Ding, C., and Liu, Q., 2019. Influence of demodulation bandwidth on demodulation spectrum of ship radiated noise. Chinese Journal of Acoustics, 38(4): 445-458. (  0) 0) |
Gardner, W. A., 1988. Simplification of music and esprit by exploitation of cyclostationarity. Proceedings of the IEEE, 76(7): 845-847. DOI:10.1109/5.7152 (  0) 0) |
Gardner, W. A., Napolitano, A., and Paura, L., 2006. Cyclostationarity: Half a century of research. Signal Processing, 86(4): 639-697. DOI:10.1016/j.sigpro.2005.06.016 (  0) 0) |
Gelli, G., and Izzo, L., 1992. A cyclic beamforming method for signal DOA estimation. Sixth European Signal Processing Conference. Brussels, Belgium: 1805-1808. (  0) 0) |
Guo, S. L., Tang, R., Peng, L. H., and Ji, X. P., 2016. Matched field localization based on CS-MUSIC algorithm. Journal of Ocean University of China, 15(2): 254-260. DOI:10.1007/s11802-016-2711-8 (  0) 0) |
Jha, A., Nikolaidis, E., and Gangadhararn, S., 2003. Cyclostationary random vibration of a ship propeller. Journal of Ship Research, 47(4): 299-312. DOI:10.5957/jsr.2003.47.4.299 (  0) 0) |
Jurdic, V., Joseph, P., and Antoni, J., 2009. Investigation of rotor wake turbulence through cyclostationary spectral analysis. AIAA Journal, 47(9): 2022-2030. DOI:10.2514/1.36728 (  0) 0) |
Lee, J. H., and Huang, C. C, 2012. Robust cyclic adaptive beamforming using a compensation method. Signal Processing, 92(4): 954-962. DOI:10.1016/j.sigpro.2011.10.008 (  0) 0) |
Liu, H. S., Hu, Y., Yin, Y. X., Wang, L. F., Tong, S. Y., and Ma, H., 2013. Shallow water body data processing based on the seismic oceanography. Journal of Ocean University of China, 12(3): 319-326. DOI:10.1007/s11802-013-2100-5 (  0) 0) |
Markhi, H., Haibala, M., Mrabti, F., Chargé, P., and Zouak, M., 2007. An improved cyclic beamforming method for signal DOA estimation. Signal, Image and Video Processing, 1 (3): 267-272.
(  0) 0) |
Pokrajac, I. P., and Vučić, D., 2010. Wideband cyclic music algorithms: A frequency-domain approach. Facta Universitatis-Series: Electronics and Energetics, 23(3): 367-378. DOI:10.2298/FUEE1003367P (  0) 0) |
Pokrajac, I. P., and Vučić, D., 2011. Signal selective direct positioning algorithm of wideband cyclostationary signals. 2011 10th International Conference on Telecommunication in Modern Satellite Cable and Broadcasting Services (TELSIKS), 2: 540-543. (  0) 0) |
Schell, S. V., and Gardner, W. A., 1989. Cyclic Music algorithm for signal-selective direction estimation. International Conference on Acoustics, Speech, and Signal Processing, 4: 2278-2281.
(  0) 0) |
Schell, S. V., and Gardner, W. A., 1992. Robustness of direction-finding methods for cyclostationary signals in the presence of array calibration error. IEEE Sixth SP Workshop on Statistical Signal and Array Processing. Victoria, BC: Canada, 346-349. (  0) 0) |
Schmidt, R. O., 1982. A signal subspace approach to multiple emitter location and spectral estimation. PhD thesis. Stanford University.
(  0) 0) |
Wu, Q., and Wong, K. M., 1996. Blind adaptive beamforming for cyclostationary signals. IEEE Transactions on Signal Processing, 44(11): 2757-2767. DOI:10.1109/78.542182 (  0) 0) |
Xu, G., and Kailath, T., 1992. Direction-of-arrival estimation via exploitation of cyclostationary – A combination of temporal and spatial processing. IEEE Transactions on Signal Processing, 40(7): 1775-1786. DOI:10.1109/78.143448 (  0) 0) |
Yan, H. Q., and Fan, H. H., 2005. Wideband cyclic music algorithms. Signal Processing, 85(3): 643-649. DOI:10.1016/j.sigpro.2004.11.011 (  0) 0) |
 2024, Vol. 23


