2) Yellow Sea Fisheries Research Institute, Chinese Academy of Fishery Sciences, Key Laboratory of Sustainable Development of Marine Fisheries, Ministry of Agriculture and Rural Affairs, Qingdao Key Laboratory for Marine Fish Breeding and Biotechnology, Qingdao 266071, China;
3) Laboratory for Marine Fisheries Science and Food Production Processes, Pilot National Laboratory for Marine Science and Technology (Qingdao), Qingdao 266071, China
Human activities such as overfishing and industrial production have placed enormous pressure on the marine ecological environment and biological resources, resulting in the environmental pollution in offshore waters, habitat degradation, and a decline in fishery resources and biodiversity. Thus, restoring the environment and protecting marine organisms are important to maintain the stability of the marine ecosystem structure and sustainable output of fisheries. As engineering components placed in water, artificial reefs are fishery infrastructure used to protect and restore habitats, create suitable environments, provide spawning and feeding grounds for aquatic organisms, and achieve the proliferation and conservation of fishery resources (Rooker et al., 1997; Seaman et al., 2000; Relini et al., 2002; Yang et al., 2005; Cáceres et al., 2010).
Previous studies indicated that a series of ecological effects is produced after an artificial reef is placed, includeing the bait effect, the shelter effect, and the flow field effect. Flow can meet the habitat requirements of organisms at different trophic levels. Therefore, the flow field effect is the basic function of the ecological effect of artificial reefs. At present, research methods on the flow field characteristics of artificial reefs at home and abroad mainly include physical model experiments and computer simulations. The physical model experiments mainly use wind tunnels and water tanks PIV and the structure of the reef studied in China is mainly square type, round tube type, star type, triangle type, and tower type (Kuroki et al., 1964; Zheng et al., 2001; Yu et al., 2004; Duzbastllar and Senturk, 2009; Guan et al., 2010; Jiang et al., 2010; Fu et al., 2014; Shao et al., 2014; Li et al., 2017). On the basis of PIV, Li et al. (2014) researched the upwelling characteristics of hollow square enhancement reefs and found that when the distance between reefs arranged longitudinally was from 0.5 L to 1.5 L, the interaction of the reefs was the largest. Liu et al. (2012) studied the effects of hollow cube artificial reefs and their compounds on the flow field based on PIV. Liu et al. (2009) also studied the influence of artificial reefs and their compounds on the flow field through wind tunnel experiments and found that the flow field changed most significantly when the distance was between 1 to 1.5 times the model size at the same water speed. Moreover, the effects on the flow field of the parallel compound models were greater than those on the vertical compound models.
The structural characteristics and layout of artificial reefs are the key factors that affect the flow field effect. Selecting suitable artificial reef structures and formulating scientific layout methods according to natural conditions such as water depth and current in specific sea areas can maximize ecological effects of artificial reefs and can effectively reduce the economic cost of reefs. Artificial reefs can be constructed scientifically, and the blindness and extensiveness of artificial reefs can be eliminated through the rational design of a layout plan on the premise of analyzing the characteristics of the artificial reef flow field. On the basis of the principle of computational fluid dynamics (CFD), this paper uses the STAR-CCM+ software to simulate the flow field characteristics of a self-designed multi-trophic artificial reef and discusses the influence of the reef individuals and its combination on the fluid flow state and flow field distribution. This work provides scientific guidance for the engineering construction of the structural reef.
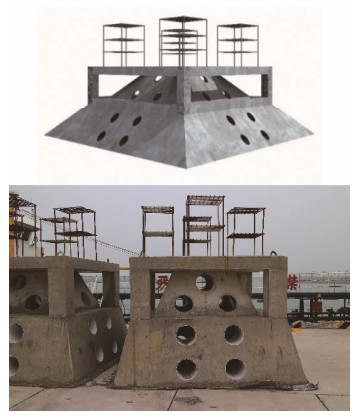
2 Materials and Methods 2.1 Experimental ReefThe object of this study is a multi-trophic artificial fish reef (Fig. 1), which has a multi-layered three-dimensional structure. Its top layer is a metal algae proliferation layer that adopts a network structure with a height of 1000 mm and a width of 1200 m. Its second layer is a concrete fish conservation layer, which adopts a frame structure and has a height of 1000 mm, a length and a width of 4000 mm, and three holes with a diameter of 300 mm on each of the four guide plates.
|
Fig. 1 Structure and actual picture of multi-trophic artificial reef. |
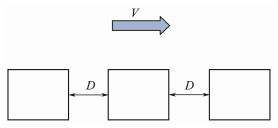
The bottom layer is the sea treasure proliferation layer made of concrete, and it is a quadrangular pyramid structure with a large surface area and many holes. The side length of the top surface is 4000 mm, the side length of the lower surface is 5000 mm, and the height is 1500 mm. The interior is a hollow square with a side length of 3000 mm. Each side has four holes with a diameter of 300 mm. The combination layout of the reefs is shown in Fig. 2. The arrangement is along the flow. The arrangement spacing D is 0.5, 1.0, 1.5, and 2.0 times the maximum reef length L (5 m at the bottom), respectively. The experimental flow rate was set to 0.6 m s−1.
|
Fig. 2 Diagram of artificial reef deployment. |
According to the characteristics of the fluid in the artificial reef area, the experimental fluid was set as a steady, incompressible viscous fluid, the control equation adopted the time-averaged continuity equation and the N-S equation, and the RNG k-ε model was chosen as the turbulence model.
In this paper, STAR-CCM+ software was used for simulation, and the RNG k-ε two-layer model was selected. The wall was treated with a two-layer full y+ wall surface, turbulence intensity I = 0.01 two-layer ReY* = 60, two-layer δReY = 10, and the total thickness of the boundary layer was determined by δtot = 0.37Lc × Re−0.2
The turbulent flow calculation method was the Reynolds time-averaged method (RANS), i.e., the Reynolds-averaged Navier-Stokes equation. The specific calculation method was to decompose each solution variable ϕ in the instantaneous Navier-Stokes equation into its mean value
| $ {T_{RANS}} = - \rho \left({\begin{array}{*{20}{c}} {\overline {u^{'}u^{'}} }&{\overline {u^{'}v^{'}} }&{\overline {u^{'}w^{'}} } \\ {\overline {u^{'}v^{'}} }&{\overline {v^{'}v^{'}} }&{\overline {v^{'}w^{'}} } \\ {\overline {u^{'}{w^{'}}} }&{\overline {v^{'}w^{'}} }&{\overline {w^{'}w^{'}} } \end{array}} \right) + \frac{2}{3}\rho kI, $ | (1) |
where k is the turbulent kinetic energy, and I is the unit tensor.
The continuity equation
| $ \frac{{\partial u}}{{\partial x}} + \frac{{\partial v}}{{\partial y}} + \frac{{\partial w}}{{\partial z}} = 0 . $ | (2) |
The momentum equation
| $ \frac{\partial }{{\partial t}}(\rho {u_i}) + \rho \frac{\partial }{{\partial {x_j}}}({u_i}{u_j}) = - \frac{{\partial P}}{{\partial {x_i}}} + \frac{\partial }{{\partial {x_j}}}\left({\mu \frac{{\partial {u_i}}}{{\partial {x_j}}} - \rho \overline {{{u'}_i}{{u'}_j}} } \right) . $ | (3) |
In Eq. (3), ρ is the density of the fluid; ui is the average velocity component for x, y, z; P is the body of fluid pressure in the micro-volume; μ is the viscosity; u' is the fluctuation velocity; and i, j = 1, 2, 3 (x, y, z).
In 1986, Yakhot and Orzag (1986) proposed the RNG k-ε turbulence model based on the standard k-ε turbulence model. The standard k-ε turbulence model did not account for rotation in the flow. Therefore, its kinematic viscosity was not accurate enough. The RNG k-ε turbulence model was improved by adding a term to the ε equation to correct for the kinematic viscosity of turbulent flow. This term reflected the time-averaged strain rate of the mainstream. The RNG k-ε turbulence model improved the kinematic viscosity and reflected the influence of small-scale eddies in turbulent flow, thus ensuring that flows with large streamline curvature could also be well handled. The RNG k-ε turbulence model is similar to the standard k-ε turbulence model
| $ \frac{{\partial (pk)}}{{\partial t}} + \frac{{\partial (pk{u_j})}}{{\partial {x_i}}} = \frac{\partial }{{\partial {x_i}}}\left[ {{\alpha _k}{\mu _{{\text{eff}}}}\frac{{\partial (k)}}{{\partial {x_i}}}} \right] + {G_k} + \rho \varepsilon, $ | (4) |
| $ \begin{aligned} \frac{{\partial (p\varepsilon)}}{{\partial t}} +& \frac{{\partial (p\varepsilon {u_i})}}{{\partial {x_i}}} =\\ &\frac{\partial }{{\partial {x_i}}}\left[ {{\alpha _k}{\mu _{{\text{eff}}}}\frac{{\partial (\varepsilon)}}{{\partial {x_i}}}} \right] + \frac{{G_{1\varepsilon }^*}}{k} + {G_k} - {G_{2\varepsilon }}\rho \frac{{{\varepsilon ^2}}}{k}, \end{aligned} $ | (5) |
where
| $ {\mu _{{\text{eff}}}} = \mu + {\mu _t}, {\mu _t} = \rho {C_\mu }\frac{{{k^2}}}{\varepsilon }, {C_\mu } = 0.0845, {\alpha _k} = {\alpha _\varepsilon } = 1.39, $ |
| $ G_{1\varepsilon }^* = {G_{1\varepsilon }} - \frac{{\eta (1 - \eta /{\eta _0})}}{{1 + \beta {\eta ^3}}}, {G_{1\varepsilon }} = 1.42, \eta = {(2E_{ij}^2)^{1/2}}k/\varepsilon, $ |
| $ {E_{ij}} = 1/2\left({\frac{{\partial {u_i}}}{{\partial {x_j}}} + \frac{{\partial {u_j}}}{{\partial {x_i}}}} \right), {\eta _0} = 4.337, \beta = 0.012. $ |
To ensure the accuracy of the simulation calculation, certain requirements are set for the range of the computational domain. Relevant studies have shown that when the computational domain reached five to six times the feature parameter as the reef body (Kuroki et al., 1964; Nakamura, 1979), the flow field around the reef could be reflected better and more efficiently. To reflect the distribution of slow currents and eddies in the front and rear of the reef, the total length of the computational domain in this study is nine times the reef length, with three times in the front and five times in the rear, and the width on both sides of the reef is five times greater.
The inlet boundary of the computational domain is the velocity inlet. According to the sea conditions in the sea area where the reefs will be deployed, the water depth is set to 8 m, and the experimental velocity of the single reef is 0.3, 0.6, and 0.9 m s−1. The combined layout is set for the experiment. The inflow velocity is 0.6 m s−1. The outlet boundary is free outflow, the two sides and the top surface of the computational domain are symmetric boundary conditions, and the reef wall and the bottom of the computational domain have a no-slip boundary.
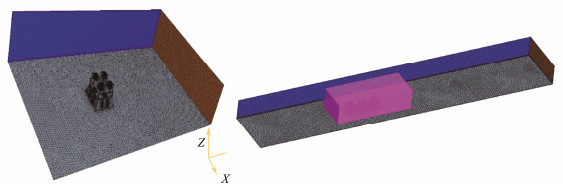
2.4 MeshingThe prismatic layer mesh in the polyhedral mesh was used, the relative size and custom prismatic layer mesh were used on the surface of the fish reef. In order to ensure the precision and accuracy of the calculation results, the grid of the area near the reef is refined. With the use of surface reconstruction, the reference size was 0.5.m, and the reef surface was set as the relative size. For the custom prism layer grid, the relative target size was 0.2 m, the minimum relative size was 0.02 m, the thickness of the prism layer was 0.25 m, and the number of the prism layer was 5. The grid division is shown in Fig. 3.
|
Fig. 3 Grid system in the computational domain. |
The calculation domain grid parameters of a single reef and the combination of four different spacings are shown in Table 1.
|
|
Table 1 Computational domain grid parameters |
In this study, the region with a vertical upward component greater than 0.1 times the inflow velocity is defined as the upwelling region (Guan et al., 2010), and the region with a horizontal component less than 0.8 times the inflow velocity is defined as the slow-flow region (Li et al., 2010; Gong et al., 2019).
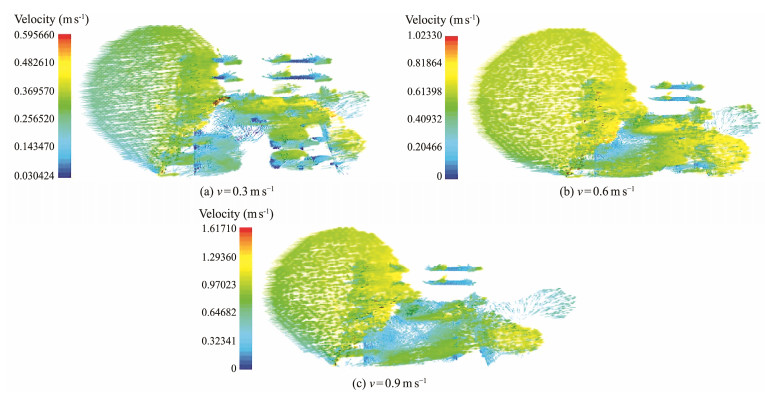
3 Results and Discussion 3.1 Distribution Characteristics of Reef Monomer Flow Field 3.1.1 Upwelling distribution characteristicsAs Fig. 4 shows, under the impact of the incoming current, a large-scale upwelling formed above the front of the reef, and the position of the larger upwelling velocity appeared near the reef in front of the middle and upper layers of the reef's headstream. Upwelling also occurred when seawater flowed out of the hole in the second layer of the reef. As shown in Table 2, the maximum velocity, height, and volume of the upwelling are positively correlated with the inflow velocity. Under the three inflow velocities, the maximum upwelling velocity is 0.80, 0.79, and 0.80 times the inflow velocity.
|
Fig. 4 Upwelling distribution vector under three inflow velocities. |
|
|
Table 2 Key parameters of the flow field of a single reef under three inflow velocities |
This result is consistent with Huang's research on porous square reefs and triangular prism reefs, which found that the ratio of the maximum upwelling velocity to the inflow velocity basically did not change with the inflow velocity (Huang et al., 2012, 2013). Under the three inflow velocities, the upwelling height of multi-trophic reefs was 1.31 – 1.43 times that of the reef body and was lower than that of square reefs and prismatic reefs (Huang et al., 2013; Wang et al., 2020). The main reason for this condition is that the upper layer of this reef is a grid structure that has a very small upstream surface, good water permeability, and a small lifting effect. The upwelling height showed a slight upward trend with the increase in the inflow velocity, which was basically in line with the result obtained by Tang et al. (2017), namely, that the upwelling height was not correlated with the inflow velocity. The upwelling area expanded with the increase in the inflow velocity, and the distribution range extended in the direction of the water flow.
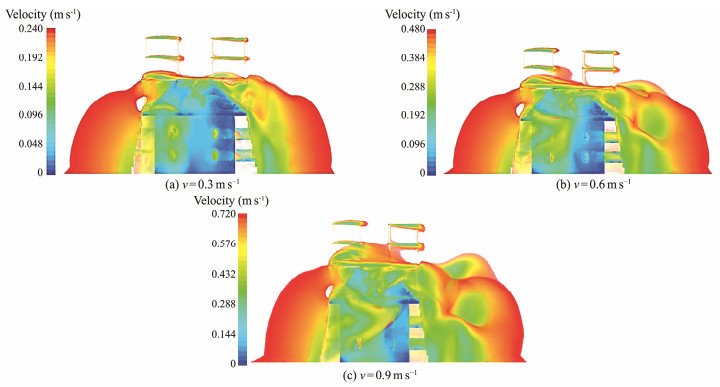
3.1.2 Slow flow distribution characteristicsFig. 5 shows a distribution cloud map of the Z-axis reverse slow flow area under the three incoming flow velocities. It indicates that along the inflow direction, the slow flow area was distributed in the front, rear, left, and right sides of the bottom and middle layers of the reef, and the velocity decreased quickly along the horizontal direction inside the reef. The distribution of the slow-flow area was similar to that in the study of Liu and Su (Liu et al., 2012; Su et al., 2007); that is, the velocity of the internal flow field was small. As shown in Table 2, with the increase in the inflow velocity, the length of the slow-flow area before and after the reef increased, but the change in the rear was more obvious than that in the front. Under an inflow velocity of 0.3 m s−1, the horizontal velocity at the corners of the middle and bottom layers of the reef was close to 0, and at the same inflow velocity, the horizontal velocity decreased along the inflow direction. Proximity to the leeward surface corresponds to a lower horizontal velocity, but the overall velocity inside the reef increased with the increase in the inflow velocity.
|
Fig. 5 Slow flow distribution cloud chart along the Z reverse under three inflow velocities. |
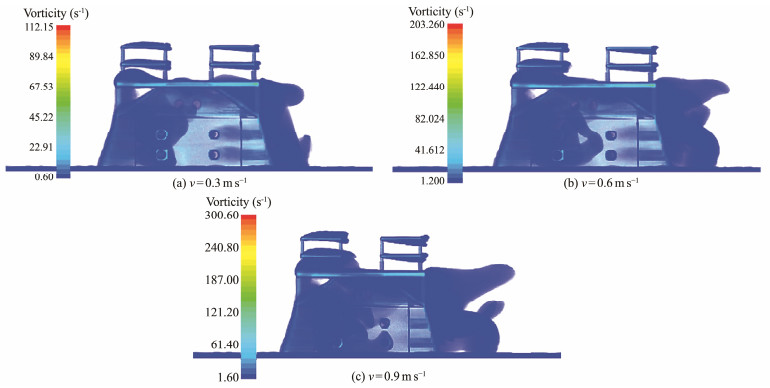
The vorticity distribution at the three inflow velocities is shown in Fig. 6. Eddy currents were present in the bottom and middle layers of the reef, between the middle layer and the second layer of wire mesh platforms, and behind the reef. The vorticity was larger in the middle and bottom layers of the reef near the backflow surface, and the distribution range of the vortex behind the reef increased significantly with the inflow velocity. Guan et al. (2010) concluded that the area of the compound M-type reef back vortex increased with the increase in the inflow velocity. This finding is consistent with the current study. As shown in Table 2, the maximum value of vorticity was positively correlated with the inflow velocity.
|
Fig. 6 Vorticity distribution under three inflow velocities. |
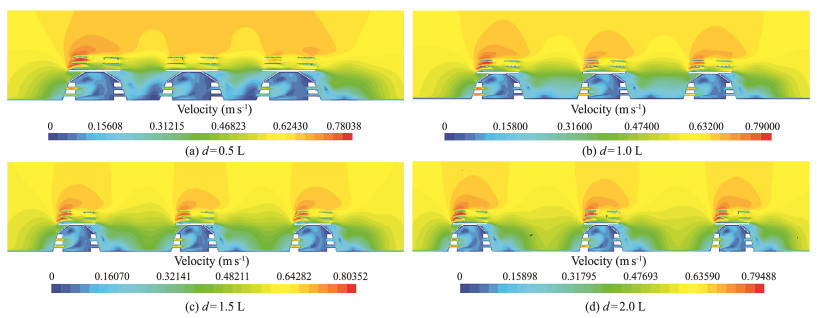
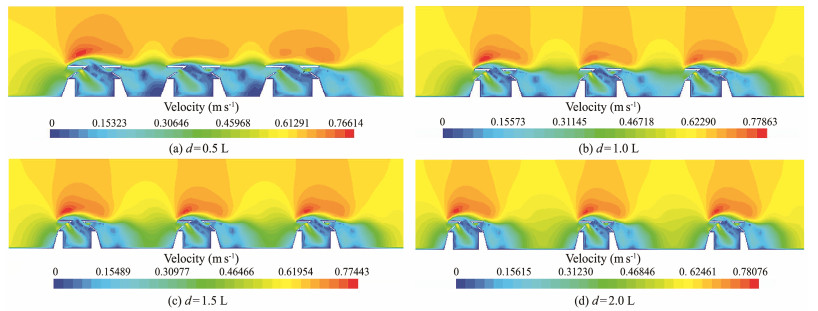
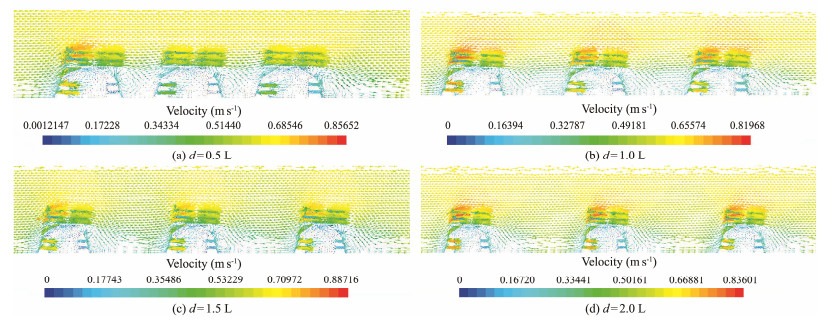
To better observe the influence of the reef on the fluid in the surrounding water, the cross-sections of the reef center (X = 1.75) and the lower hole (X = 2.5) were intercepted according to the direction of the inflow, and the velocity cloud map of the two sections was observed, as shown in Figs. 7 and 8. The reefs had a significant slowing effect on the rate of inflow, but the flow speed increased at the holes and the wire screen. Very low-velocity areas were present inside the reef, occupying about two-thirds of the space. The velocity of seawater at a distance between adjacent reefs also significantly decreased, and with the increase in the spacing, the velocity of seawater at a distance showed an increasing trend. The local area of the cross-sectional velocity vector at X = 1.75 m was intercepted, as shown in Fig. 9, to more clearly reflect the direction and size of the sea water flow in the waters around the reef.
|
Fig. 7 Velocity cloud chart on X = 1.75 m under four spacings. |
|
Fig. 8 Velocity cloud chart on X = 2.5 m under four spacings. |
|
Fig. 9 Velocity vector cloud chart on X = 1.75 m under four spacings. |
As shown in Table 3 and Fig. 10, under the four spacings, the maximum value of upwelling did not change significantly; all of them were slightly lower than the maximum upwelling value of individual reefs (0.476 m s−1). This result indicated that spacing had a minimal effect on upwelling, which was consistent with the research results of Zheng et al. (2012) on star-shaped fish reefs and Wang et al. (2020) on square fish reefs. Except for the maximum upwelling velocity, the other parameters of upwelling and spacing were approximately linearly related. The height and vertical area of upwelling decreased slightly with the increase in the spacing, but they were all larger than the upwelling height (4.694 m) of the single reef. With the increase in the spacing, the upwelling volume and horizontal area increased most obviously, and the upwelling areas in front of the second and third reefs increased with the increase in spacing.
|
|
Table 3 Key parameters of the flow field of combined reefs under four spacings |

|
Fig. 10 Variation trend of upwelling parameters under four spacings. |
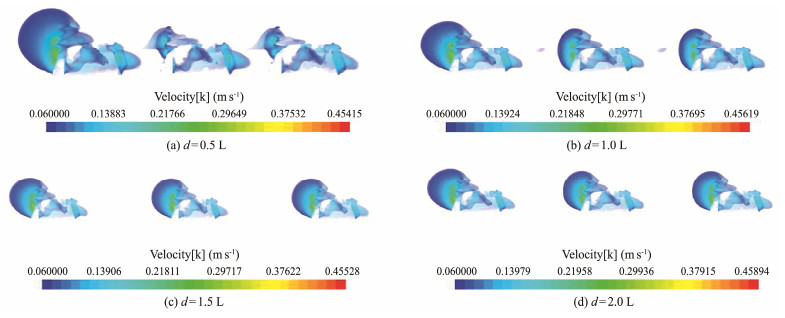
Fig. 11 shows that under the four combinations, upwelling occurred around the front and rear reefs and mainly concentrated on the side of the reef slope affected by seawater. The upwelling velocity of the second layer of the reef was high, and upwelling also occurred in the front of the wire screen, where 'Velocity[k]' represents the vertical component of the velocity. The upwelling volume in front of the first reef under the four spacings varied slightly, the upwelling volume of the second and third reefs increased significantly with the increase in the spacing, and when the spacing was 2.0 L, the slow-flow zone was broken, as shown in Fig. 12. Thus, the upwelling also approached the single reef (the upwelling height of a single reef was 4.762 m, and the area was 23.38 m2). The value was slightly higher than that of a single reef. This finding shows that with the increase in spacing, the interaction between adjacent reefs gradually decreased.
|
Fig. 11 Upwelling distribution cloud chart under four spacings. |

|
Fig. 12 Variation trend of slow flow parameters under four spacings. |
Linear fitting lines could visually reflect the trend of each parameter at different spacings. For upwelling volume, we could obtain the equation for the linear fitting line as y = 12.889x + 80.795, with a coefficient of determination R2 = 0.969. Thus, with the increase in spacing, the upwelling volume increases almost linearly. The rate of change is 12.889, and R2 is close to 1, indicating very good fitting. For the upwelling height, we could obtain the equation for the linear fitting line as y = −0.044x + 5.2115, with a coefficient of determination R2 = 0.8872. Thus, with the increase in spacing, the upwelling height decreases almost linearly. The rate of change is −0.044, and R2 is close to 1, indicating very good fitting. For the maximum upwelling velocity, we could obtain the equation for the fitting line as y = −0.0002x2 + 0.0032x + 0.447, with a coefficient of determination R2 = 0.7714. Thus, with the increase in spacing, the maximum upwelling velocity approximately changes in a quadratic curve, and R2 is close to 1, indicating that the fitting is good.
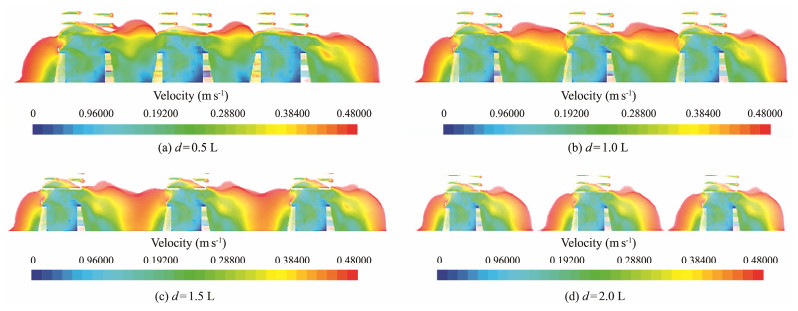
3.2.2 Slow-flow distribution characteristicsAs shown in Figs. 12 and 13, the reef combination had a significant slowing effect. Slow-flow areas were present before and after the sea water flows through the reef, and slow-flow areas with relatively lower velocities were also present inside the reef, except the interval area of the reef has a slow-flow area and is concentrated in the area below the second layer frame. Under the spacings of 0.5 L, 1.0 L, and 1.5 L, an obvious continuous slow-flow area formed among the reefs, and the length, horizontal area, and volume of slow flow increased with the increase in spacing. When the spacing was 2.0 L, a high-velocity area appeared between adjacent reefs, that is, fractures of slow flow were present between the reefs, and the length of the slow-flow zone before and after was significantly reduced compared with the 1.5 L spacing. Li et al. (2014) concluded that the synergistic effect of hollow square reefs was stronger at 0.5 – 1.5 times the spacing. Liu et al. (2009) found that when the distance from the reef model was 1.0 to 1.5 times the model scale, the flow field changed the most. Liu et al. (2012) believed that the vertical double-body hollow cube artificial reef combination achieved strong synergy when the distance was 1.0 L. The above results are consistent with this experiment.
|
Fig. 13 Slow flow distribution cloud chart under four spacings. |
The minimum length of the anterior slow-flow area of the reef combination under four spacings was 3.402 m (d = 0.5 L), which was 1.55 times longer than the anterior slow-flow area of a single reef under the same velocity. Similarly, the minimum retarding length behind the reef combination was 5.428 m (d = 0.5 L), reflecting an increase of 54% compared with the 3.523 m length of the retarding area behind a single reef at the same velocity. We could conclude that the reef combination had a significantly better effect on slowing the flow rate than a single reef. In addition, the volume of the retarding zone decreased significantly at a distance of 2.0 L, and the analysis showed that this decrease was related to the fracture of the retarding zone. The discontinuity of the retarding zone caused the retarding zone after each reef to change from approximately horizontal to having a reduced slope. All parameters before the retarding zone fracture were positively correlated with the spacing linearity, except the volume of the retarding zone.
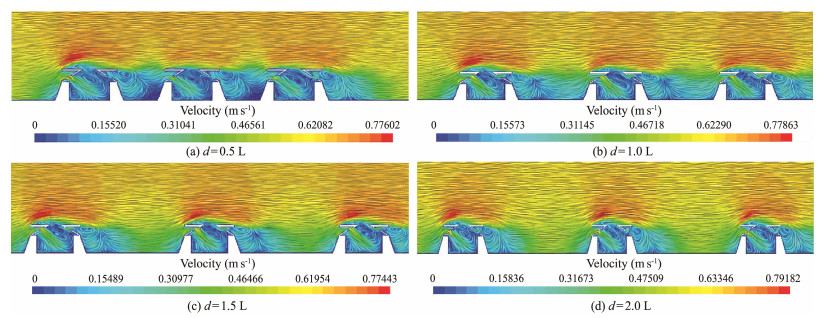
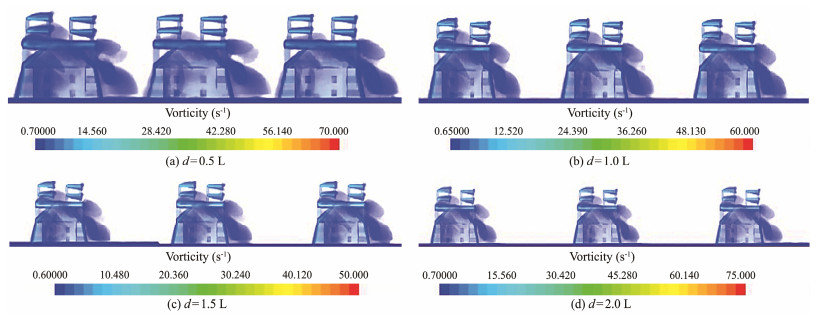
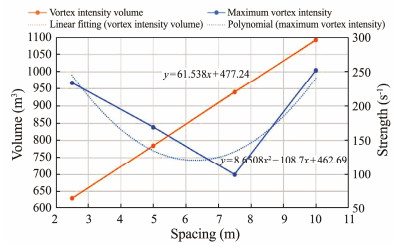
3.2.3 Eddy current distribution characteristicsAs shown in Figs. 14 and 15, the vortex strength is greater at the holes and the wire screen, and eddies were also present behind the holes where seawater flows out. Eddy currents were generated inside and behind the reefs under the four spacings, and small scales were present at the bottom of reefs close to the upstream surface and the bottom of the reefs. The middle and bottom layers of the reefs formed a continuous eddy current field near the leeward surface, and the eddies behind the reefs were distributed near the leeward surface. When the spacings were 0.5 – 1.5 L, the maximum value of the vorticity decreased with the increase in spacing. When the spacing was 2.0 L, the maximum value of vorticity increased significantly, reaching 252.08 s−1, which was very close to the maximum vorticity value of 250.47 s−1 of a single reef under a velocity of 0.6 m s−1. This result indicated that at 2.0 L spacing, the synergy between adjacent reefs decreased, and the fluid flow patterns around a single reef tended to be consistent. For the maximum vortex intensity, we could obtain the equation for the fitting line as y = 8.6508x2 − 108.7x + 462.69, with a coefficient of determination R2 = 0.8199. Thus, we can obtain that with the increase in spacing, the maximum upwelling velocity approximately changes in a quadratic curve, and R2 is close to 1, indicating that the fitting is good.
|
Fig. 14 Line integral convolution graph on X = 2.5 m under four spacings. |
|
Fig. 15 Vorticity distribution under four spacings. |
|
Fig. 16 Variation trend of vortex parameters under four spacings. |
In this experiment, the hydrodynamic characteristics of multi-trophic artificial reefs were numerically simulated based on CFD, the distribution characteristics of the surrounding flow field of a single reef structure under various flow velocity environments were analyzed, and the effect of the spacing on the flow field distribution of the reef was explored. The results showed that various flow patterns of upwelling, slow flow, and eddy current occurred around the multi-trophic artificial reef. The upwelling was mainly distributed on the upstream surface of the artificial reef, and the maximum velocity, height, and volume of the upwelling were related to the inflow velocity. A positive correlation was observed; a certain range of slow-flow areas before, on both sides, and inside the reef exists. The length and volume of the slow-flow area increased with the increase in the inflow velocity. The length of the slow-flow area behind the reef was greater than that in the front, and the slow-flow area was smaller, appearing in the interior of the reef. Eddy currents were generated in and behind the reef, and the vorticity was positively related to the incoming flow velocity. The experimental results under the four spacings showed that the spacing has little effect on the maximum velocity and height of the upwelling, but the distribution range of the upwelling increased as the spacing increased. The length of the slow-flow zone and the rear of the reef increased slightly with the increase in the spacing but decreased when the spacing was 2.0 L, and the slow-flow zone between the reefs broke. Obvious eddy currents were distributed in the bottom of the reef close to the upstream surface and the bottom of the reef body, the middle layer and bottom of the reef near the downstream surface, and the rear of the reef close to the downstream surface. The vorticity was the largest at a spacing of 2.0 L.
This study provides a scientific basis for the formulation of sea area layout plans by analyzing the flow field distribution of multi-trophic artificial reefs alone and in various combination modes. In accordance with the experimental results, a spacing of 1.5 L was selected for the layout. The validation experiment of this reef was conducted in Laizhou Bay. Future work will involve the actual measurement of the flow field around the artificial reefs and the investigation of ecological effects to facilitate a scientific evaluation for restoring the artificial reef habitat.
AcknowledgementsThe work is supported by the National Natural Science Foundation of China (No. 32002442), and the National Key R & D Program (No. 2019YFD0902101).
Cáceres, I., Trung, L. H., van Ettinger, H. D. V., Reniers, A., and Uijttewaal, W., 2010. Wave and flow response to an artificial reef: Laboratory measurements. Journal of Hydraulic Engineering, 136(5): 299-310. DOI:10.1061/(ASCE)HY.1943-7900.0000177 (  0) 0) |
Duzbastllar, F. O., and Senturk, U., 2009. Determining the weights of two types of artificial reefs required to resist wave action in different water depths and bottom slopes. Ocean Engineering, 36: 900-913. DOI:10.1016/j.oceaneng.2009.06.008 (  0) 0) |
Fu, D. W., Chen, Y., and Chen, Y. S., 2014. PIV experiment of artificial monomer reefs on the flowing field. Journal of Dalian Ocean University, 29(1): 82-85 (in Chinese with English abstract). (  0) 0) |
Gong, P. H., Zheng, Y. X., Li, J., Guan, C. T., Cui, Y., and Li, Q., 2019. Flow field effect and stability of the equilateral tower-type truss artificial reef. Journal of Fishery Sciences of China, 26(5): 1021-1028 (in Chinese with English abstract). (  0) 0) |
Guan, C. T., Liu, Y., Zhao, Y. P., Cui, Y., and Li, J., 2010. Experimental study on two-dimensional flow field of the compound M artificial reef with Particle Image Velocimetry (PIV). Journal of Fishery Modernization, 37(1): 15-19 (in Chinese with English abstract). (  0) 0) |
Huang, Y. D., Long, C., and Deng, J. T., 2013. Analysis of water flow field based on CFD at a three-prism artificial reef. Journal of Water Resources & Water Engineering, 24(1): 1-4 (in Chinese with English abstract). (  0) 0) |
Huang, Y. D., Zhao, S. F., Jiang, J. W., Zhou, Z. H., and Gu, J., 2012. Study on numerical simulation of water flow past a porous square artificial reef. Journal of Water Resources & Water Engineering, 23(5): 15-18 (in Chinese with English abstract). (  0) 0) |
Jiang, Z. Y., Liang, Z. L., Tang, Y. L., Huang, L. Y., Yu, D. Y., and Jiang, M. S., 2010. Numerical simulation and experimental study of the hydrodynamics of a modeled reef located within a current. Chinese Journal of Oceanology and Limnology, 28(2): 267-273. DOI:10.1007/s00343-010-9228-6 (  0) 0) |
Kuroki, T., Sato, O., and Ozaki, A., 1964. Physical Study of Fish Reef Structure I. Hokkaido Fisheries Department, Ministry of Fisheries, Hokkaido, 1-19.
(  0) 0) |
Li, J., Lin, J., and Zhang, S. Y., 2010. The numerical experiment on the permeability of a cubic artificial reef and the effect on the flow field around the reef. Journal of Shanghai Ocean University, 19(6): 836-840 (in Chinese with English abstract). (  0) 0) |
Li, J., Zhang, X. M., Guan, C. T., Zheng, Y. X., and Huang, B., 2014. Characteristics of upwelling of hollow square enhancement reefs based on particle image velocimetry. Transactions of the Chinese Society of Agricultural Engineering, 2: 232-239 (in Chinese with English abstract). DOI:10.3969/j.issn.1002-6819.2014.24.028 (  0) 0) |
Li, J., Zheng, Y. X., Gong, P. H., and Guan, C. T., 2017. Numerical simulation and PIV experimental study of the effect of flow fields around tube artificial reefs. Ocean Engineering, 134: 96-104. DOI:10.1016/j.oceaneng.2017.02.016 (  0) 0) |
Liu, H. S., Ma, X., Zhang, S. Y., Yu, H. B., and Huang, H. J., 2009. Research on model experiment of effect of artificial reefs on flow field. Journal of Fishery of China, 33(2): 229-236 (in Chinese with English abstract). (  0) 0) |
Liu, Y., Zhao, Y. P., Cui, Y., and Dong, G. H., 2012. Experimental study of the flow field around cube artificial reef. The Ocean Engineering, 30(4): 103-108 (in Chinese with English abstract). (  0) 0) |
Nakamura, M., 1979. Artificial reef fishery seen from the flow environment. Fisheries and Civil Engineering Journal of Japan, 15(2): 5-12. (  0) 0) |
Relini, G., Relini, M., and Torehia, G., 2002. Ten years of censuses of fish fauna on the Loano artificial reef. ICES Journal of Marine Science, 59: 5132-5137. DOI:10.1006/jmsc.2002.1272 (  0) 0) |
Rooker, J. R., Dokken, Q. R., Pattengill, C. V., and Holt, G. J., 1997. Fish assemblages on artificial and natural reefs in the Flower Garden Banks National Marine Sanctuary, USA. Coral Reefs, 16: 83-92. DOI:10.1007/s003380050062 (  0) 0) |
Schlichting, H., 1979. Boundary Layer Theory. 7th edition. Mc-Graw-Hill, New York, 29-49.
(  0) 0) |
Seaman, W., 2000. Artificial Reef Evaluation: With Application to Natural Marine Habitats. CRC Press, Boca Raton, 264pp.
(  0) 0) |
Shao, W. J., Liu, C. G., Nie, H. T., and Zheng, D. B., 2014. Analysis of hydrodynamic characteristics and flow field around artificial reefs. Chinese Journal of Hydrodynamics, 29(5): 580-585 (in Chinese with English abstract). (  0) 0) |
Su, D. T., Liu, T. L., and Ou, C. H., 2007. A comparison of the PIV measurements and numerical predictions of the flow field patterns within an artificial reef. Proceedings of the Seventeenth International Offshore and Polar Engineering Conference. Lisbon, Portugal, 7: 136.
(  0) 0) |
Tang, Y. L., Long, X. Y., Wang, X. X., Jiang, S. Y., and Cheng, H., 2017. Comparative analysis of flow field effects of commonly used artificial reefs in China. Journal of Agricultural Engineering, 33(8): 97-103 (in Chinese with English abstract). (  0) 0) |
Wang, J. H., Liu, L. L., Cai, X. C., Chen, J. Y., Yang, Y. X., and Jiang, S. X., 2020. Numerical simulation study on influence of disposal space on effects of flow field around porous square artificial reefs. Progress in Fishery Sciences, 41(3): 40-48 (in Chinese with English abstract). (  0) 0) |
Yakhot, V., and Orszag, S. A., 1986. Renormalization group analysis of turbulence. I. Basic theory. Journal of Scientific Computing, 1: 3-51. DOI:10.1007/BF01061452 (  0) 0) |
Yang, L., Liu, T. Y., and Huang, R. K., 2005. The Theory and Practice of Artificial Reefs in China. Guangdong Science and Technology Press, South China Sea Fisheries Research Institute, 68-108.
(  0) 0) |
Yu, D. C., Yu, C. G., and Yan, S. Q., 2004. Hydrodynamic simulation to the best layout of artificial ship-reefs. Oceanologia et Limnologia Sinica, 3(4): 299-305 (in Chinese with English abstract). (  0) 0) |
Zhang, H. H., and Sun, L., 2001. On reproduction increase of the sea aquatic resources by artificial fish-reef engineering. Resources Science, 23(5): 6-10. (  0) 0) |
Zheng, Y. X., Guan, C. T., Song, X. F., Liang, Z. L., and Cui, Y., 2012. Numerical simulation of the flow field effect of star-shaped artificial reef. Journal of Agricultural Engineering, 28(19): 185-193 (in Chinese with English abstract). (  0) 0) |
 2024, Vol. 23


