2) Beijing Key Laboratory of Development and Research for Land Resources Information, Beijing 100083, China
In the past 30 years, the Small Baseline Subset InSAR (SBAS-InSAR) time-series technique has emerged as an essential tool for measuring slow surface displacement and estimating geophysical parameters (Massonnet and Feigl, 1998; Li et al., 2022). InSAR is a high-precision measurement method that utilizes the interferometric step difference to determine the displacement of the earth's surface (Massonnet and Feigl, 1998). It achieves monitoring accuracy at the centimeter and millimeter levels, covers large monitoring areas, and provides timely information; this approach has been extensively applied in subsidence, glacial movement, and mine deformation (Li et al., 2022). Unmanned aerial vehicles (UAVs), as an emerging technology, have been widely utilized in disaster monitoring and three-dimensional modeling (Zhu et al., 2024). The data produced by UAVs are not only intuitive but also rich in detail, particularly when compared with InSAR technology. However, relying on a single remote sensing technique presents numerous challenges. Recent advances by researchers have shown significant progress through the integration of multiple remote sensing methods (Zhu et al., 2024).
The continuous advancement of the 'Belt and Road' cooperation initiative has made the strategic position of the 'Maritime Silk Road' increasingly prominent. In recent years, the SBAS-InSAR and UAV technology has been applied in marine fields, such as the observation of island and reef subsidence and analysis of macroscopic subsidence mechanisms (Huang et al., 2023), the monitoring of surface deformation in coastal areas (Hu et al., 2024), dynamic monitoring of national sea area (Fan et al., 2017), and maritime positioning and navigation. The SBAS-InSAR and UAV technology has become a universal tool that can be applied to land and ocean environments simultaneously. The mutual promotion between land and ocean environments promotes the continuous upgrading and evolution of this technology.
1.2 Application in Land Subsidence of Mining AreaUnderground mining activities cause surface deformation and negatively impact the environment (Bell and Donnelly, 2006). For example, these activities result in subsidence (Ge et al., 2007; Choi et al., 2010; Members, 2017; Zhang et al., 2018), tailing dam collapse (Genevois and Tecca, 1993; Sammarco, 2004; Riba et al., 2006), air, water, and soil pollution (Müezzinoğlu, 2003; Norgate and Lovel, 2006), and seismic activity (Šílený and Milev, 2006, 2008; Kouame et al., 2017). Among these occurrences, land subsidence poses a considerable and hazardous threat to human life and properties (Mahboob et al., 2020). Thus, accurately supervising the deformation of mining districts and facilitating new and current scientific ecological restoration methods are vital. These factors highlight the importance of mining activities as a crucial research area in terms of resource development and ecological protection.
Traditional monitoring methods for mine deformation and subsidence usually deploy a level-control net along the mining face of the mining area. It utilizes conventional geodetic means such as levels, theodolites and GPS-measuring instruments to observe and record changes in levels over long periods (Chen and Wu, 1964). Although these approaches have high accuracy, their underlying control network layout is complex. They also need long observation periods and have a small observation range. Moreover, workforce, materials and financial resources are required for these methods, which often have low temporal and spatial resolutions (Zhu et al., 2019). InSAR technology has been extensively applied to supervise surface deformation in open-pit mining regions because it can conduct large area and high-precision measurements (Du et al., 2021). However, traditional D-InSAR techniques are affected by various factors, such as spatiotemporal incoherence, atmospheric delays and orbital errors. Spatiotemporal incoherence presents a considerable challenge to the InSAR technology while monitoring mining-induced subsidence and significant deformations, which ultimately leads to decreased accuracy (Abdikan et al., 2014; Caló et al., 2017; Tavus et al., 2022). Time-series measurement methods, such as SBAS-InSAR and PS-InSAR, have been developed to address these limitations. Researchers have employed enhanced time-series InSAR techniques to conduct the integrated inversion of deformation over cities and mining areas, which obtained surface deformation rates for open-pit mining areas and their surrounding urban areas (Wang et al., 2022b). According to the DS-InSAR technology, Wang et al. (2022a) used Sentinel-1A data to compare the surface deformation of the plateau accumulation of dunes in the western mining area with the surface deformation during incomplete mining. This study attained promising results. Palama et al. (2022) used SBAS-InSAR technology and Sentinel-1A data to administer the ground motion situation caused by underground mining events in the Legnica Glogow copper mining area in southwestern Poland. They verified this method using Global Navigation Satellite System (GNSS) measurements.
The observations obtained by the InSAR technology only capture the deformation in the line-of-sight (LOS) orientation of the radar (Han et al., 2021). The complex domain information of the mining district is difficult to obtain using the deformation from a single LOS orientation. This information does not accurately reflect the actual surface deformation in several cases (Wang and Zhou, 2021). The approach in the current research is primarily based on the geometric correlation between the flight of satellites and the earth's surface. The analysis of the one-dimensional deformation field of simultaneous ascending and descending orbit data enables the derivation of a two-dimensional deformation field encompassing vertical and horizontal east-west orientations on the ground (Samsonov, 2019). Gao et al. (2022a) conducted surface deformation extraction and two-dimensional deformation analysis on the deformation field of the Yangbi earthquake in Yunnan on May 21, 2021, using the radar LOS observations of the ascending and descending orbits. Their results revealed that the impact of this earthquake on vertical orientation was smaller than that on horizontal orientation in the east-west direction. Integrating the ascending and descending orbit data from InSAR allows for the estimation of the two-dimensional components of surface deformation along vertical and horizontal directions. This approach addresses the measurement errors caused by the disparity between LOS and deformation directions. It can accurately monitor slow subsidence on a large scale at the edge of collapsed basins in mining districts. The monitoring accuracy can be obtained at the millimeter level. However, the low monitoring accuracy of InSAR for collapsed center areas with large deformation gradients and variables is attributed to the impact of the measurement mechanism and wavelength. The traditional InSAR technology alone does not provide high-precision monitoring data in such places (Wang et al., 2022b).
Low-altitude UAV photogrammetry technology is another valuable tool for acquiring mining subsidence data in small areas. It provides an essential supplement to satellite remote sensing and conventional photogrammetry and can be used to quickly obtain and update mining subsidence data in small regions (Yang et al., 2022). The rapid progress in UAV photogrammetry flight platforms and software recently have highlighted the advantages of this technology in disaster management, which attracted substantial research attention (GonzlezAguilera et al., 2012; Harwin and Lucieer, 2012; Turner et al., 2015; Uysal et al., 2015). Compared with standard measurement methods, UAV photogrammetry has low cost, convenient manual operations, and high efficiency and does not need fixed observation points (Ćwiąkała et al., 2020). The efficiency, flexibility and prompt data acquisition of UAV photogrammetry have allowed researchers to generate high-resolution images of target goals at low altitudes, especially for multi-range monitoring works. Therefore, the standard technological advancements used in high-resolution topographic images and for calculating the geomorphology are digital surface models, topographic surface, change of volume, and subsidence monitoring in mining areas (Laliberte and Rango, 2009; Tong et al., 2015; Kršák et al., 2016; Ignjatović Stupar et al., 2020; Pal et al., 2020; Zhou et al., 2020; Meng et al., 2021). Wang et al. (2022b) combined UAV photogrammetry with D-InSAR and SBAS-InSAR technologies while integrating deformation mass with probability integral models. This study obtained a comprehensive and highly accurate deformation aspect in mining areas. The reliability of this approach was confirmed by comparing its results with GNSS data. Gao et al. (2022b) employed drone photogrammetry technology to supervise surface subsidence in high-intensity mining areas in China's western region. They compared the accuracy of established subsidence basins through leveling, which provided an effective means for monitoring surface damage during coal mining. Wang et al. (2022c) used a probability integration model to process the deformation data obtained from UAV, D-InSAR and SBAS-InSAR for obtaining a complete deformation field. Integrating UAV and InSAR generates novel ideas and methods for examining subsidence patterns in mining areas. Zhou et al. (2022) consolidated UAV photogrammetry and InSAR to observe surface subsidence in coal mining. The results showed that the fusion method can effectively monitor large-scale surface subsidence in mining areas and determine the boundaries of mining subsidence with minor subsidence. Zhang et al. (2022) used D-InSAR and UAV photogrammetry techniques to identify the settlement situation in the Yangquan coal mine. Their findings revealed that the fused data can more accurately monitor settlement than single data. Zhao et al. (2023) used a combination of D-InSAR and UAV to monitor the subsidence of two mining areas in Hebei and Inner Mongolia, which obtained more accurate and reliable subsidence results.
Based on the literature review, this study proposes a methodology integrating UAV photogrammetry and InSAR technology to monitor surface subsidence in mining districts. The method leverages the high-precision data acquired through InSAR for surface mining subsidence basin edges and combines it with the findings of basin boundary derived from UAV photogrammetry. This integration facilitates the acquisition of accurate and detailed basin subsidence information. The backpropagation (BP) neural network algorithm (Ding et al., 2011), genetic algorithm (GA)-BP neural network algorithm (Wang et al., 2018) and long short-term memory (LSTM) algorithm (Sbeity et al., 2023) are applied to predict land subsidence from the research area. The feasibility of prediction methods will guide efforts for on mine collapse restoration.
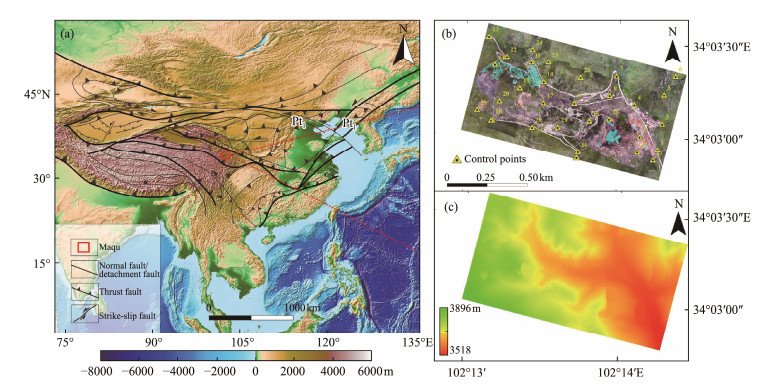
2 Materials and Methods 2.1 Study Area and Data AcquisitionThe research field is the Gesar gold mine in Northwest China, which was formerly known as Gerke Mining District. It is located at the southern edge of the west-dipping Shandong section of the Qinling Mountains. Gerk is the largest gold deposit in the region, with over 100 t of gold resources and an average gold grade of 7.88 g per ton (Shi and Zhang, 2018). The administrative division is under the authority of Gansu Province. The altitude is 3518 – 2896 m, the relative elevation difference is 300 – 500 m, and the geographical coordinates are 102°12΄56˝ – 102°14΄57˝E, 34°01΄53˝ – 34°03΄39˝N. The Gesar gold mine was completed in 1991, and its mining method was open-pit mining when it was placed into service (Li et al., 2020). In 2002, this mining method was fully transformed into underground mining, which was the shallow-hole shrinkage mining method. Surface collapse and subsidence have become more severe due to years of underground mining and geological disasters, which have affected the safety of surface structures. Fig.1 depicts the location and description of the research area.
|
Fig. 1 (a), Relative position relationship of the working face; (b), orthophoto and control points of the working face; (c), digital elevation model of the working face. |
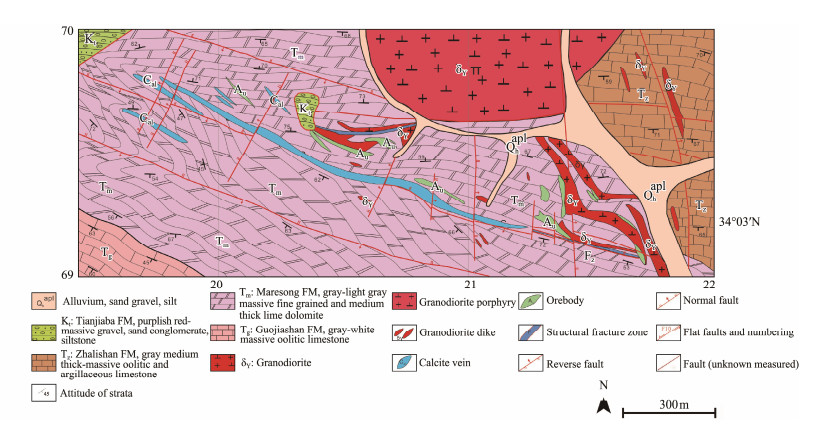
The mining area is based on the eastern edge of the Qinghai Tibet Plateau and in the northern piedmont of the meander grassland of the Yellow River, which is the first bend in the world. It experiences a cold and semi-humidclimate. The mining area is primarily covered by alpine meadow vegetation, with no trees or river systems, due to the influence of atmospheric circulation and plateau landforms. The geological framework of the mining area belongs to the southern belt of the West Qinling fold system, the southern edge of the Xilingshan uplift belt, and the southern wing of the Gekko-Zhongqu anticline. The structure is characterized by an overall uplift. The study area exhibits structural geological conditions with multiple stages of fault activity and transformation. Numerous groups of joints cutting each other result in relatively broken strata. In particular, the Dashui gold mine area is located at the intersection of multiple fault fracture zones, and the formation lithology mainly comprises carbonate rocks containing a small amount of clastic rock. The presence of significant dissolution phenomena has led to the formation of many dissolution cavities and mined-out areas (Fig.2).
|
Fig. 2 Geological map of Dashui mining area in the Gesar gold mine. |
This study primarily focused on the dynamic changes in surface mining subsidence basins in the study area from January 2020 to October 2022. UAV photogrammetry and InSAR data fusion methods were used for monitoring. Among them, the single look complex (SLC) synthetic aperture radar (SAR) data were obtained from the ascending and descending data (Table 1) of Sentinel-1 IW SLC from January 2020 to October 2022 of the Alaska Satellite Facility (alaska.edu). The SRTM1 data were jointly measured by DEM for NASA and NASA's Integrated Model-centric Architecture, with a resolution of 30 m. The Sentinel-1A auxiliary precision orbit data were provided by the European Space Agency (ESA). The ascending track was T128, and the descending track was T135.
|
|
Table 1 Basic parameters of Sentinel-1A data |
The research region covered a total area of 2.25 km2. According to the changes in the terrain elevation, nine sorties had been flown. Table 2 presents the fundamental data of UAV photogrammetry. The set heading overlap was 80%, and the sideway overlap was 70%. The crucial monitoring areas were subject to tilt photography; for instance, 5 images of different directions were collected at the same location, and more than 6000 images were obtained. Based on the study area, 29 ground control points (GCP), which included 20 control points and 9 checking points, were established to ensure data accuracy.
|
|
Table 2 Aerial photogrammetry information of low-altitude UAVs |
The SBAS-InSAR analysis used 159 Sentinel-1 interferometric wide swath modes captured from January 2020 to October 2022, with the shortest repetition circle of 12 days. The SARscape software was used for processing. Precise orbit ephemerides (acquired from the ESA (https://qc.sentinel1.eo.esa.int/)) and external SRTM DEM (resolution of 30 m) were used to remove the track error and terrain noise separately. The interference process in SBAS-InSAR utilizes Generic Atmospheric Correction Online Service data products to remove atmospheric water vapor from the interference pattern and reduce atmospheric errors.
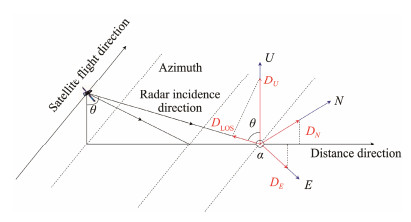
The deformation of each ground point obtained via conventional D-InSAR/SAR is only the shape variable of the ground point along the direction of the radar LOS, as shown in Fig.3. Accurate deformation measurement can be obtained only when the deformation of the local surface point aligns entirely with the LOS of the radar. However, this situation is extremely rare. The deformation direction of the surface point is assumed to be perpendicular to the LOS direction. In this case, InSAR/SAR cannot detect the deformation of the ground point, which leads to inaccurate results.
|
Fig. 3 Schematic of InSAR interferometry. |
The angle between the incident direction of the radar wave and the vertical plane is θ, which is called the incidence angle of the radar. The included angle between due north and the clockwise direction of satellite flight is α, which is also called the azimuth of the radar. A three-dimensional coordinate system is established at the ground point. The three axes are due north, due east, and vertical. Accordingly, the LOS direction can be decomposed into three axes by using DN, DE, and DU, respectively.
Therefore, the relationship between LOS deformation and vertical, east-west, and north-south deformation needs to be obtained (Miller and Shirzaei, 2015; Cigna and Tapete, 2021; Ohenhen and Shirzaei, 2022). The polar flight characteristics of current on-orbit radar systems cause difficulty in monitoring north-south deformation. By ignoring the LOS deformation component of the radar in the north-south direction and combining the InSAR observations of the ascending and descending orbits, the two-dimensional surface deformation field in the vertical and horizontal east-west directions can be calculated (Zhang et al., 2012) as follows:
| $ \left\{ {\begin{array}{*{20}{c}} {{D_{A{\text{-LOS}}}} = {D_U}*\cos {\theta _A}-{D_E}\sin {\theta _A}*\cos \left({{\alpha _A} -\frac{{3{\text{π }}}}{2}} \right)} \\ {{D_{D{\text{-LOS}}}} = {D_U}*\cos {\theta _D}-{D_E}\sin {\theta _D}*\cos \left({{\alpha _D}-\frac{{3{\text{π }}}}{2}} \right)} \end{array}} \right. . $ | (1) |
DA-LOS and DD-LOS are the LOS vertical displacements observed by the ascending and descending track information, respectively. The method can calculate the vertical and east-west deformations using the ascending and descending track information to establish equations.
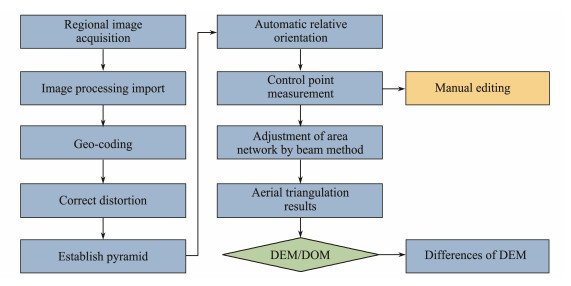
2.3 UAV Subsidence MonitoringThe images were processed using Context Capture Center (Bentley, United States) to produce a digital orthophoto map (DOM) for each spectral band using a UTM 48N coordinate system. Next, the point cloud was opened in the Lidar 360 software, and quadratic surface filtering was used to filter out points on human buildings and vegetation (points that do not fall on the ground). As a result, accurate ground point elevation information could be obtained. A DEM was generated using these elevation values. The resulting spatial resolution of output imagery in 2020 was 0.07 m px−1, and that between 2021 and 2022 was 0.05 m px−1. The three stages of DEM were resampled to a resolution of 0.1 m to facilitate data analysis due to the inconsistent resolution among different DEMs.
A total of 29 permanent CGCS2000 GCPs were established during the 2020 flight to ensure the accurate positioning of DOM and DEM. These points were selected from stable surfaces in clearly identifiable areas in the images, such as rock outcrops and artificial structures. In 2021 and 2022, these control points were used as a benchmark for the adjustment and absolute orientation of the outer orientation. Ultimately, the data from 3 years were accurately constrained under the same reference. The ground elevation difference was estimated by subtracting the 2020 DEM from the 2022 DEM. By comparing sequential DEMs (DEM of difference), topographic changes were analyzed, where the total amount of settlement changes was calculated by simply subtracting each DEM unit (given the size of each unit) (Cucchiaro et al., 2018). Therefore, a negative value indicates an elevation reduction over time, which is a signal of land subsidence. The error related to this elevation change was calculated as the standard deviation at all GCPs. Fig.4 shows the processing flow.
|
Fig. 4 Flowchart of aerial triangulation encryption and DEM/DOM generation. |
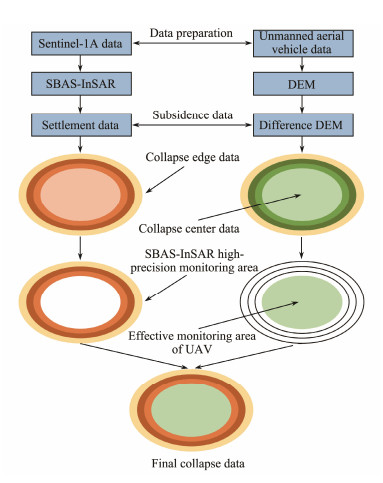
The mine images captured by UAVs at different times can be used to generate DEMs for different periods and monitor changes to obtain large-scale deformation information in the research region during the study period. The fusion method mentioned in the article is described as follows (Fig.5):
|
Fig. 5 Schematic of fusion method. |
1) The resolution was determined and unified. First, the length of the collapse center area was determined. Then, its edge was outlined, and its location and range were ascertained. For large collapse areas, the resolution should be close to the resolution of SBAS-InSAR data to avoid information redundancy caused by UAV data that are too large. For small- and medium-sized collapse areas, the resolution should lie between the pixel resolution of SBAS-InSAR and UAV to avoid a significantly large resolution. Such resolution will cause the disappearance of the gradient change in SBAS-InSAR deformation data. The length of the collapse pit in this experiment was approximately 100 m, the resolution of InSAR deformation monitoring information was 15 m, the multi-look factor was 4:1, and the resolution of UAV deformation monitoring data was 0.1 m. After careful consideration, the unified resolution of this experiment was determined to be 5 m.
2) Sampling and interpolation were conducted. After the fusion resolution was unified, the image was sampled, and the sampling frequency was determined. The sampling frequency of this experiment was 5 m. The SBAS-InSAR deformation data were sampled upstream, and the UAV deformation data were sampled downstream. Interpolation methods included a nearest neighbor, bilinear interpolation and bicubic interpolation. The bilinear interpolation method was used in this experiment to ensure accuracy and avoid excessive data volume.
3) SBAS-InSAR was integrated with UAV. After the two steps, the data samples obtained by SBAS-InSAR and UAV had the same resolution. The two samples were geo-registered, and the resolution of both surface deformations was unified into the same unit. The SBAS-InSAR deformation monitoring data were divided by 1000; the unified unit was expressed in meters.
By using UAV and InSAR technologies to monitor subsidence basins in mining areas, the UAV large deformation area was fused with the InSAR boundary area to obtain complete subsidence basin data. Threshold segmentation was used to fuse the two. 'Mining regulations for coal pillars and buildings, water, railways, and major roadways' suggested by the China Coal Association state that when the mining of underground coal resources results in 10 mm of settlement, edge of surface deformation, and the settlement area is greater than 10 m2, the region qualifies as a mining-affected area. Subsequently, the boundary area and the center area of the subsidence basin were determined. The UAV can monitor the large deformation area at the center of the subsidence basin due to the high accuracy of InSAR in the outer edge area (Zhang et al., 2022). Therefore, based on the definition of the main influencing radius of coal mining subsidence (He et al., 1991), in the areas affected by mining, such as settlement edges, the settlement data monitored by SBAS-InSAR were used when the settlement range was from −1 m to 0.01 m, and the settlement data monitored by UAVs were used in the settlement center to fuse the image.
2.5 Radical Principles of Neural Network ModelsLSTM is a neural network designed to handle short- and long-term information memory, which has been developed to solve the problem of long-term dependence. The traditional RNN is a chain structure, and each node is determined by weight, bias, and activation function. The core concept of LSTM is cell state, and the concept of gate is used to control the input and output of features (Sbeity et al., 2023).
GA-BP (BP neural network optimized by GA; Wang et al., 2018) updates the weight threshold using forward propagation data and error reverse transmission during BP neural network training (Ding et al., 2011). On the one hand, this process involves determining the weight and threshold of the first forward propagation process, i.e., initializing these parameters. In deep learning, the initial weights and threshold parameters are obtained through randomization. On the other hand, after the initial parameters are selected, the gradient descent algorithm uses the initial parameter value as the starting point to optimize and update the parameters. Two types of algorithms are usually used for parameter optimization: deterministic and heuristic algorithms. The deterministic algorithm uses mathematical methods to solve the optimal problem. The main idea of the heuristic algorithm is to approach the optimal iteratively, and the optimal result is a variable value (infinitely close to the theoretical optimal value) that satisfies the accuracy requirements.
3 Results 3.1 UAV ResultsThis study used UAV and SBAS-InSAR technologies to express land subsidence. DEM differences were calculated using the model obtained from the UAV images, and the large-sized surface deformation was finally calculated. Next, small-sized deformation was obtained using SAR image calculations.
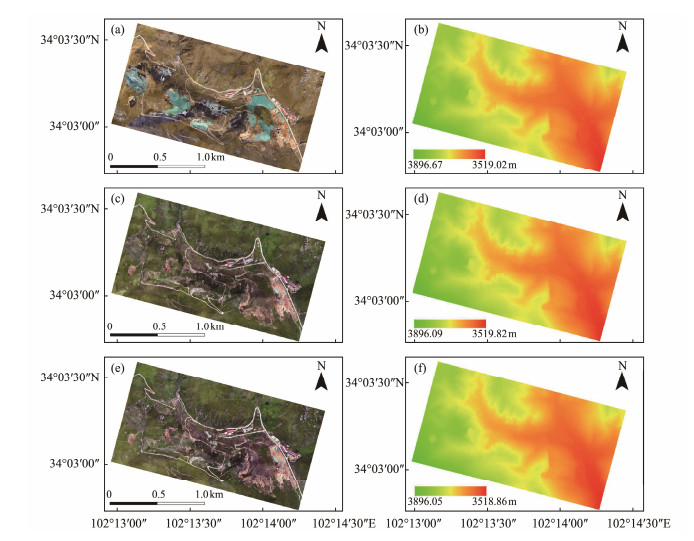
Fig.6 displays the DEM and DOM items generated by UAV image processing. DOM contains abundant information that could obviously and intuitively display the actual variations in the surface morphology of the research area, which offer a reliable foundation for disaster prevention and ecological restoration in the mining district. The ground settlement obtained by UAV follows the two-phase DEM subtraction method. The quality of DEM affects the accuracy of the last collaborative inversion of surface subsidence. Thus, the accuracy of DEM needs to be estimated.
|
Fig. 6 DOM and DEM generated by UAV image processing: (a), DOM of 2020; (b), DEM of 2020; (c), DOM of 2021; (d), DEM of 2021; (e), DOM of 2022; (f), DEM of 2022. |
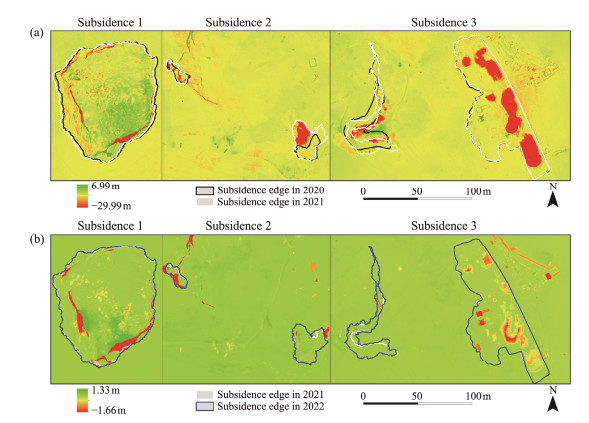
The high-precision DEM obtained from drone data can clearly identify the subsidence edges of ground deformation areas (Fig.7). The subsidence edges of each collapse area in 2020, 2021, and 2022 were marked using different colored lines, and significant changes were found. After the area of each subsidence for 3 years was calculated, the area of the No. 1 subsidence was approximately 8.19 km2 in 2020, 8.25 km2 in 2021, and 8.35 km2 in 2022. The area of No.2 collapse was nearly 8.68 km2 in 2020, 11.94 km2 in 2021, and 12.39 km2 in 2022. The area of No.3 collapse was around 6.89 km2 in 2020, 6.95 km2 in 2021, and 7.07 km2 in 2022. Overall, the area of each subsidence increased yearly, which made the collapse situation increasingly serious.
|
Fig. 7 Differential DEM results for (a) 2021 – 2020 and (b) 2021 – 2022. |
The change data of the study area from 2020 to 2021 and 2021 to 2022 were obtained by monitoring the changes in the DEM generated in 2020, 2021, and 2022, as shown in the differential value in Fig.7. The collapse in the research area from 2020 to 2021 was larger than that from 2021 to 2022. The maximum settlement change value from 2020 to 2021 could reach approximately −29.99 m and nearly −1.66 m from 2021 to 2022. An onsite investigation revealed the presence of natural collapses and manual excavation collapses. Other than collapsed areas and other areas with large deformation gradients, the maximum uplift height variation from 2020 to 2021 reached around 6.99 m from 2020 to 2021 and nearly 1.33 m from 2021 to 2022. The change detection data values in the two periods were relatively large.
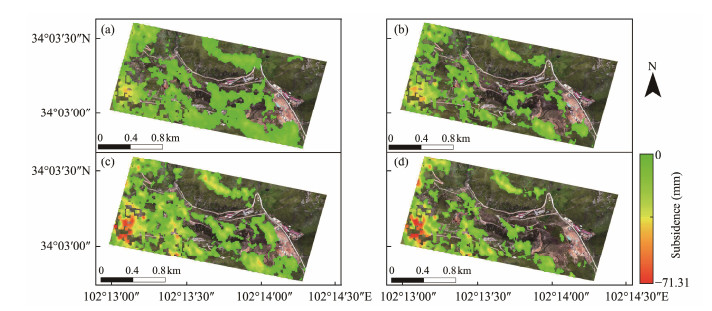
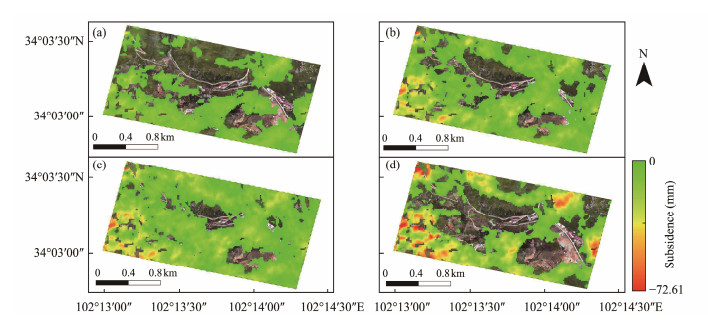
3.2 SBAS-InSAR ResultsBased on the data from January 4, 2020, the settlement in the direction of LOS in each period was obtained. The research period was from January 4, 2020, to October 20, 2022, with a study period of every 8 months to yield the settlement amount for four study periods (Figs.8 and 9).
|
Fig. 8 Deformation results of LOS ascending orbit for (a), 2020.08.31; (b), 2021.05.22; (c), 2022.02.10; (d), 2022.10.20. |
|
Fig. 9 Deformation results of LOS descending orbit for (a), 2020.08.31; (b), 2021.05.22; (c), 2022.02.10; (d), 2022.10.20. |
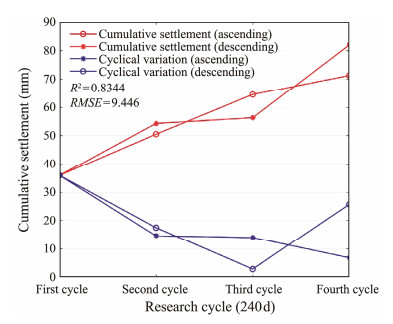
The cumulative settlements monitored by the ascending track in four periods were −35.9, −50.51, −64.51, and −71.31 mm, respectively (Fig.10). The cumulative settlements monitored by the descending track in four periods were −35.9, −53.41, −56.31, and −82.01 mm, respectively. A high correlation was found between the two tracks. Fig. 10 shows that the settlement rate in the entire study area was slowing down, which indicates that the ecological environmental protection measures implemented by the local government have been effective.
|
Fig. 10 Data correlation of ascending and descending tracks in four periods. |
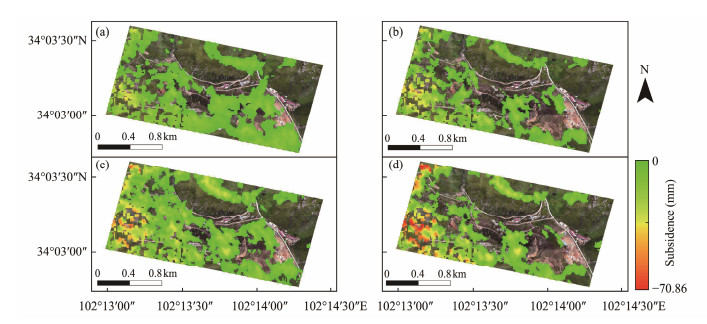
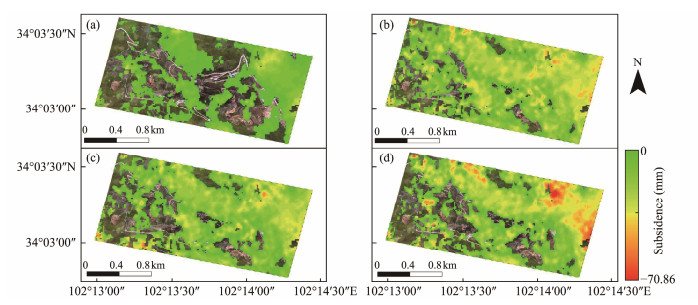
According to Eq. (1), the ascending and descending data could be utilized to establish a set of equations for solving the vertical and east-west settlements, as displayed in Figs. 11 and 12. The figures show that the distribution of vertical and LOS settlements was roughly the same. However, the vertical settlement distribution was more continuous than the single LOS result. The obtained settlement distribution corresponds to the underground mining scope of the mining scope, which solves the severe incoherence problem in some areas relative to the single-track data.
|
Fig. 11 Vertical deformation calculation results for (a), 2020.08.31; (b), 2021.05.22; (c), 2022.02.10; (d), 2022.10.20. |
|
Fig. 12 East-west deformation calculation results for (a), 2020.08.31; (b), 2021.05.22; (c), 2022.02.10; (d), 2022.10.20. |
Some typical points within the large deformation range were randomly selected in the research area for analysis. Fig.13 presents the vertical time-series settlement curve of typical points. The accumulative settlement increased with time, but the overall settlement rate was slow. The slopes of the straight fitting lines were −0.77, −0.55, −0.58, −0.64, and −0.53.

|
Fig. 13 Vertical time-series settlement curve of typical points. |
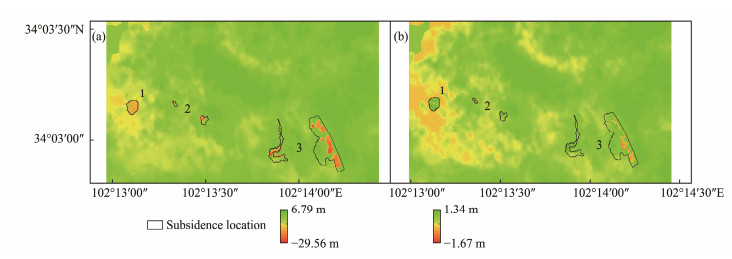
The vertical settlements obtained by the two-dimensional solution and the differential DEM obtained by UAV were fused based on the abovementioned data. Fig.14 shows the obtained fusion image. According to the UAV acquisition time, the settlement was divided into two phases: from October 2020 to August 2021 and from August 2021 to August 2022. The image was also used for vertical settlement. According to the field survey, the location of the collapse has been identified in the figure. Phase Ⅰ collapse was more severe than Phase Ⅱ. However, the settlement of the surrounding area in Phase Ⅱ was more evident because InSAR vertical settlement is a cumulative result, and the settlement increases with time. The fusion image solves the problem of incoherence caused by InSAR monitoring in areas with a large deformation gradient and addresses the generally large UAV differential DEM monitoring values. This change is more natural and consistent with the actual collapse law.
|
Fig. 14 InSAR/UAV fusion results for (a) 2021 – 2020 and (b) 2021 – 2022. |
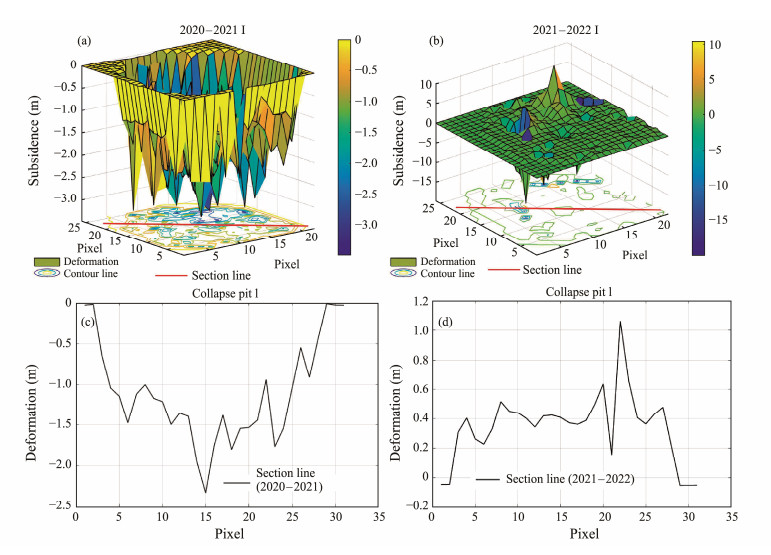
The collapsed areas of the mining area were comprehensively analyzed. Pit 1 collapsed severely from 2020 to 2021, with a maximum of −3 m, and the entire pit body exhibited a downward trend. The shape of the pit body was changed (Fig.15a), and a cross-section line was made through the pit body (Fig.15c). From 2021 to 2022, the pit gradually stabilized, and the overall change was insignificant except for some falling active stones. The shape of the pit changed (Fig.15b), and a cross-section line was drawn through the pit (Fig.15d).
|
Fig. 15 Collapse 1 fitting effect diagram during 2020 – 2021 (a) and 2021 – 2022 (b); collapse 1 sectional drawing during 2020 – 2021 (c) and 2021 – 2022 (d). |
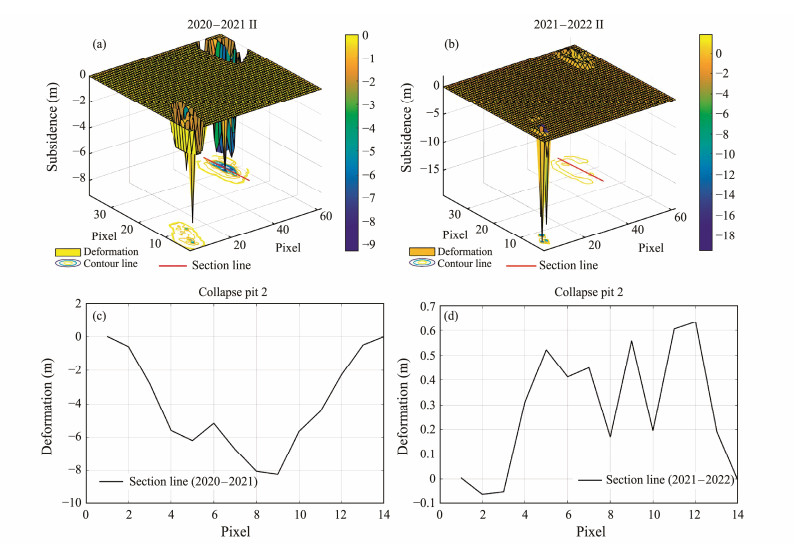
Pit 2 comprised a collapsed pit and a collapsed landslide (Figs.16a, b). From 2021 to 2020, collapses were relatively severe, with a maximum of −8 m (Fig.16c). Insignificant changes were observed from 2021 to 2022, with some areas experiencing uplift (Fig.16d).
|
Fig. 16 Collapse 2 fitting effect diagram during 2020 – 2021 (a) and 2021 – 2022 (b); collapse 2 sectional drawing during 2020 – 2021 (c) and 2021 – 2022 (d). |
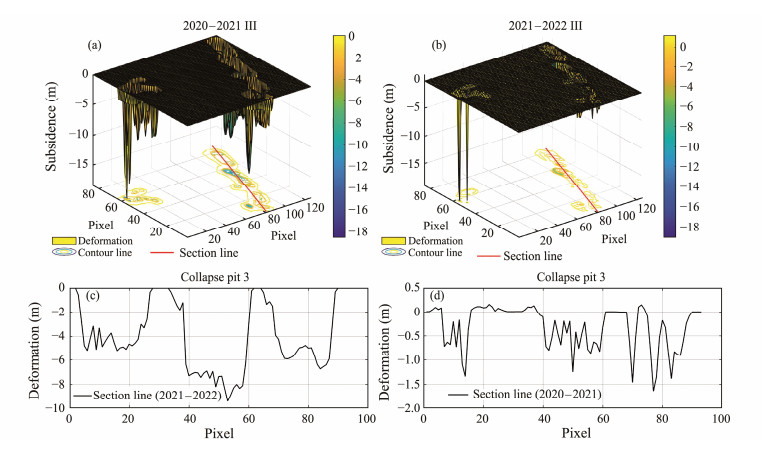
During the period of 2021 – 2020, No. 3 collapses were relatively severe, with a maximum of −8 m and a large range (Figs.17a, c). The collapse was not obvious during the period of 2021 – 2022, and some areas were uplifted (Figs.17b, d).
|
Fig. 17 Collapse 3 fitting effect diagram during 2020 – 2021 (a) and 2021 – 2022 (b); collapse 3 sectional drawing during 2021 – 2022 (c) and 2020 – 2021 (d). |
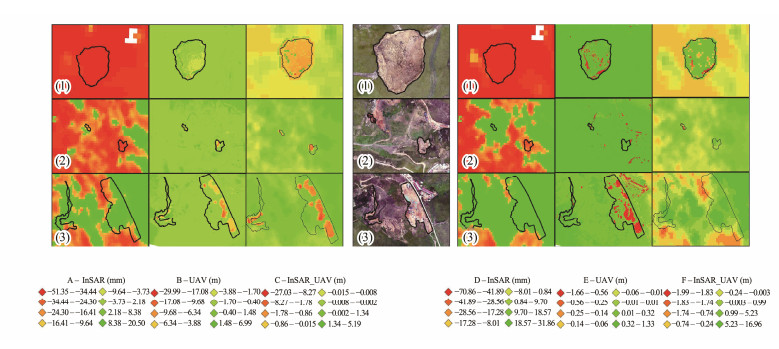
Fig.18 displays the accumulative subsidence acquired by InSAR and UAV and the accumulative subsidence acquired by the fusion approach. The InSAR method showed that the maximum settlement was −51.35 mm from 2020 to 2021 and −70.86 mm from 2021 to 2022. The UAV method demonstrated that the maximum settlement was −29.99 mm from 2020 to 2021 and −1.66 mm from 2021 to 2022. The fusion method combined with UAV data revealed that the maximum settlement was −27.03 m from 2020 to 2021 and −1.99 m from 2021 to 2022, which are consistent with the range of the collapse pit circled by the DOM. The cumulative settlement obtained by InSAR technology was very small, which is not the actual settlement value of a region. However, this technology can identify the edge of a subsidence basin. By contrast, although UAV technology may determine large subsidence in the subsidence basin, it cannot determine small subsidence at the edge of the basin. Therefore, it cannot precisely locate the edge of the subsidence basin. Under the monitoring of high-resolution UAV data, the maximum subsidence of the basin was determined to be −29.99 m. The fused data fill the gap in InSAR monitoring data and correct the edge values of subsidence basins in UAV data monitoring. This study demonstrates a combination of InSAR and UAV monitoring methods to leverage the advantages of the two methods for obtaining high-precision subsidence basins in the entire mining area.
|
Fig. 18 Comparison among InSAR, UAV, and fusion data for (A, B, C) 2021 – 2020 and (D, E, F) 2021 – 2022. |
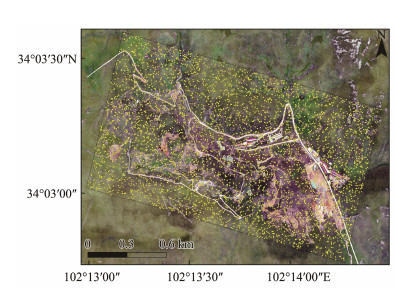
Given that the Gesar gold mine is currently in the mine environmental governance stage, monitoring and predicting future collapse pits significantly impact subsequent works. Therefore, this study proposed using settlement data from SBAS-InSAR to predict collapse pits in mining areas. Fused data were not used for prediction because only three phases of drone images were available. The amount of data was insufficient to support the implementation of the prediction method. Therefore, this study combined the subsidence data from multiple SBAS-InSAR periods with deep learning algorithms to predict collapse pits. One period of data was used for validation. This study proposed the GA-BP algorithm and the initial weights and thresholds of LSTM for screening. First, the SBAS-InSAR technology was applied to determine the scope and value of surface subsidence in the Gesar mining area. Then, the findings were used as the training samples of the GA-BP algorithm to build the prediction mode parameters. According to the surface subsidence range and subsidence value monitored by the fusion of UAV information and InSAR information in the previous article, 5000 random points were generated on the entire map of the research area. Next, the values were extracted to the points. Finally, NaN values were removed, which resulted in 4520 random points (Fig.19).
|
Fig. 19 Random point selection chart. |
The 4000 points were used as the training samples of the GA-BP and LSTM algorithms. The remaining 520 samples were predicted, and the functional model between the monitored samples and the future settlement values was established. The prediction results were compared with the SBAS-InSAR monitoring results.
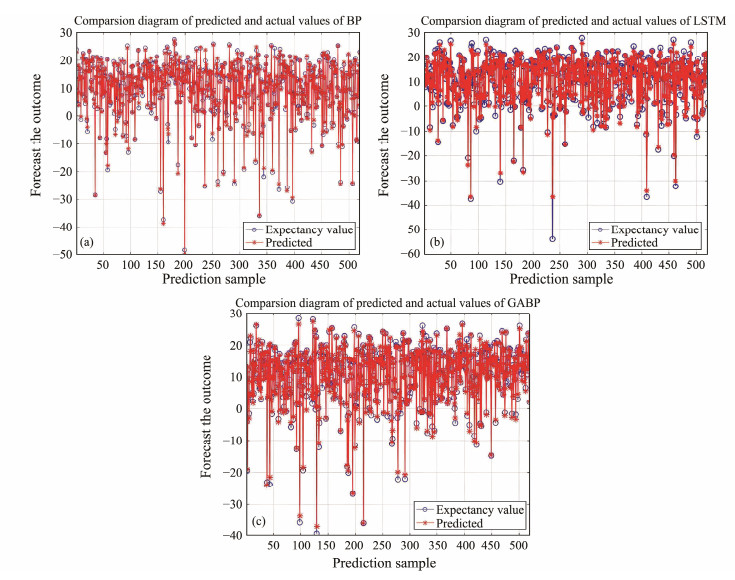
Fig.20 shows the prediction findings. The red circle represents the predicted value, and the blue asterisk represents the InSAR monitoring value. Furthermore, the abscissa stands for the predicted settlement point, and the ordinate stands for the settlement value in the LOS. The prediction consequences of the GA-BP algorithm and those of SBAS-InSAR monitoring were generally consistent. The GA-BP algorithm exhibited the best prediction effect and the smallest residual.
|
Fig. 20 Prediction results of the three algorithms. |
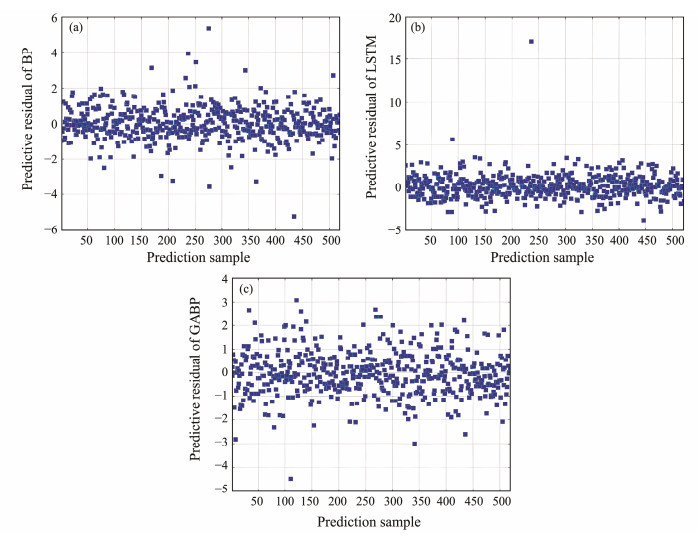
The residual values of the prediction outcomes of the three algorithms and the SBAS-InSAR monitoring consequences were calculated using the residual calculation method described in Fig.21. The maximum residuals of the BP algorithm, the LSTM algorithm, and the GA-BP algorithm were 5.8, 17, and 3.1 mm, respectively. The mean squared errors of the BP, LSTM, and GA-BP algorithms were 13.24, 1.7922 and 1.3433, respectively. With the same training samples, the residual error of GA-BP was the smallest. A smaller mean square error between the prediction results of the GA-BP neural network and the InSAR monitoring value indicates that the GA-BP neural network model exhibits a better prediction effect and performance for mining district surface subsidence when more settlement points are used as training samples. Therefore, in the subsequent mining environmental management work of the Gesar gold mine, the GA-BP neural network model will be applied to subsidence prediction to provide a foundation for the restoration and treatment of mining subsidence.
|
Fig. 21 Residual scatter plots of the three algorithms. |
Common ocean-land technologies, including SBAS-InSAR technology, UAV three-dimensional reconstruction technology, and InSAR/UAV fusion technology, were used to analyze the deformation of the Gesar mining district. The GA-BP neural network algorithm was combined with InSAR data to predict subsidence in collapsed areas. The results were obtained as follows:
1) The vertical settlement of the research area can be obtained based on the two-dimensional solution technology of the lifting track. Compared with the LOS settlement, the settlement information of the mining area can be more accurately understood. However, SBAS-InSAR cannot easily yield information on large gradient deformation at the center of subsidence basins. A significant settlement of the collapsed area was obtained by stacking and subtracting the two DEMs of the drone. However, monitoring small edge settlement deformations is difficult.
2) The integration of SBAS-InSAR technology and UAV technology can monitor the large area of surface subsidence in the mining area and determine the location and scope of the surface subsidence in the mining area. This feature compensates for the shortcomings of the SBAS-InSAR method in large gradient deformation decoherence and drone technology in small deformation edge monitoring. Compared with traditional measurement technology, this strategy can more directly and clearly reflect the surface subsidence in the mining field. Its accuracy can reach the centimeter level, which can be efficiently used in the monitoring of mining area subsidence.
3) The neural network mode was used to predict the settlement of the study area and compare it with the monitoring value of InSAR for guiding the restoration of mining subsidence in the future. The BP neural network, LST, and GA-BP algorithms were compared. The feasibility and reliability of the GA-BP neural network mode were verified by calculating the residual value of the prediction results. As observed, the GA-BP neural network mode effectively predicts the surface subsidence of the mining area. It also addresses the issue of the traditional BP algorithm of dependency on the original weight and threshold values, which lowers the prediction accuracy.
AcknowledgementsWe thank the Maqu Branch of Gannan Tibetan Autonomous Prefecture Ecological Environment Bureau of Gansu Province, China for its support for the article. This research was funded by the Project from the Maqu Branch of Gannan Tibetan Autonomous Prefecture Ecological Environment Bureau, China (No. 33412021021).
Author Contributions
Xuewei Chen: conceptualization, method, formal analysis, writing original draft, writing review and editing. Jianping Chen: conceptualization, method, writing review and editing. Genhou Wang: conceptualization, writing review and editing. Qian Zhang: method, data curation, formal analysis. Yanwei Zheng: data curation. All writers read and agreed to the published version of the manuscript.
Data Availability
All data generated and analyzed during this study are included in this published article and its additional files.
Declarations
Ethics Approval and Consent to Participate
This article does not contain any studies with human participants or animals performed by any of the authors.
Consent for Publication
Informed consent for publication was obtained from all participants.
Conflict of Interests
The authors declare that they have no conflict of interests.
Abdikan, S., Arıkan, M., Sanli, F. B., and Cakir, Z., 2014. Monitoring of coal mining subsidence in peri-urban area of Zonguldak City (NW Turkey) with persistent scatterer interfero-metry using ALOS-PALSAR. Environ Earth Sciences, 71: 4081-4089. DOI:10.1007/s12665-013-2793-1 (  0) 0) |
Bell, F. G., and Donnelly, L. J.,, 2006. Mining and Its Impact on the Environment. 1st edition. CRC Press, London, 1-560.
(  0) 0) |
Caló, F., Notti, D., Galve, J. P., Abdikan, S., Görüm, T., Pepe, A., et al., 2017. DInSAR-based detection of land subsidence and correlation with groundwater depletion in Konya Plain, Turkey. Remote Sensing, 9(1): 83. DOI:10.3390/rs9010083 (  0) 0) |
Chen, Y., and Wu, Y., 1964. Development of mine surveying instruments and methods. Bulletin of Surveying and Mapping, 8: 19-26. (  0) 0) |
Choi, J. K., Kim, K. D., Lee, S., and Won, J. S., 2010. Application of a fuzzy operator to susceptibility estimations of coal mine subsidence in Taebaek City. Korea Environmental Earth Sciences, 59(5): 1009-1022. DOI:10.1007/s12665-009-0093-6 (  0) 0) |
Cigna, F., and Tapete, D., 2021. Present-day land subsidence rates, surface faulting hazard and risk in Mexico City with 2014 – 2020 Sentinel-1 IW InSAR. Remote Sensing of Environment, 253: 112161. DOI:10.1016/j.rse.2020.112161 (  0) 0) |
Cucchiaro, S., Cavalli, M., Vericat, D., Crema, S., Llena, M., Beinat, A., et al., 2018. Monitoring topographic changes through 4D-structure-from-motion photogrammetry: Application to a debris-flow channel. Environmental Earth Sciences, 77: 632. DOI:10.1007/s12665-018-7817-4 (  0) 0) |
Ćwiąkała, P., Gruszczyński, W., Stoch, T., Puniach, E., Mrocheń, D., Matwij, W., et al., 2020. UAV applications for determination of land deformations caused by underground mining. Remote Sensing, 12: 1733. DOI:10.3390/rs12111733 (  0) 0) |
Ding, S., Su, C., and Yu, J., 2011. An optimizing BP neural network algorithm based on genetic algorithm. Artificial Intelligence Review, 36: 153-162. DOI:10.1007/s10462-011-9208-z (  0) 0) |
Du, Q., Li, G., Chen, D., Zhou, Y., Qi, S., Wu, G., et al., 2021. SBAS-InSAR-based analysis of surface deformation in the eastern Tianshan Mountains, China. Frontiers in Earth Science, 9: 729454. DOI:10.3389/feart.2021.729454 (  0) 0) |
Fan, J. C., Wang, D. Y., Zhao, J. H., Song, D. R., Han, M., and Jiang, D. W., 2017. National sea area use dynamic monitoring based on GF-3 SAR imagery. Journal of Radars, 6(5): 456-472. (  0) 0) |
Gao, H., Shi, X., Chen, C., Yin, Y., and Dai, K., 2022a. Two-dimensional surface deformation extraction of Yangbi earthquake in Yunnan. Journal of Kunming University of Science and Technology (Natural Science), 47(2): 57-64 (in Chinese with English abstract). (  0) 0) |
Gao, Y., Zhou, D., An, S., Wang, L., Zhang, D., and Zhan, S., 2022b. Study on surface subsidence in coal mining by UAV-photogrammetry monitoring technology. Coal Science and Technology, 50(5): 57-65. (  0) 0) |
Ge, L., Chang, H. C., and Rizos, C., 2007. Mine subsidence monitoring using multi-source satellite SAR images. Photogrammetric Engineering and Remote Sensing, 73(3): 259-266. DOI:10.14358/PERS.73.3.259 (  0) 0) |
Genevois, R., and Tecca, P. R., 1993. The tailings dams of Stava (northern Italy): An analysis of the disaster. Proceedings of Environmental Management Geo-Water and Engineering Aspects, 1: 8-11. (  0) 0) |
González-Aguilera, D., Fernández-Hernández, J., Mancera-Taboada, J., Rodríguez-Gonzálvez, P., Hernández-López, D., Felipe-García, B., et al., 2012. 3D modelling and accuracy assessment of granite quarry using unmmanned aerial vehicle. ISPRS Annals of the Photogrammetry, Remote Sensing and Spatial Information Sciences, I-3: 37-42. (  0) 0) |
Han, S., Zhu, H., Huang, Z., and Ma, J., 2021. Two-dimensional deformation acquisition of mining area using the ascending and descending orbit InSAR. Journal of Lanzhou University: Natural Sciences, 57(1): 47-53 (in Chinese with English abstract). (  0) 0) |
Harwin, S., and Lucieer, A., 2012. Assessing the accuracy of georeferenced point clouds produced via multi-view stereopsis from unmanned aerial vehicle (UAV) imagery. Remote Sensing, 4: 1573-1599. DOI:10.3390/rs4061573 (  0) 0) |
He, G., Yang, L., Ling, G., Jia, F., and Hong, D.,, 1991. Mining Subsidence Science. China University of Mining and Technology Press, Beijing, 42-44.
(  0) 0) |
Hu, W. J., Peng, W., Liu, B., Xing, X. M., Zhu, J., and Lin, D. F., 2024. The tidal effect on the coastal ground deformation monitoring of multi-strips InSAR time series. Chinese Journal of Geophysics, 67(4): 1342-1355 (in Chinese with English abstract). (  0) 0) |
Huang, F., Duan, S. S., Zhou, Z., and Wang, Z. J., 2023. Application of time-series InSAR technology for settlement monitoring of hydraulic artificial island-reef. Journal of Geodesy and Geodynamics, 43(7): 696-702 (in Chinese with English abstract). (  0) 0) |
Ignjatović Stupar, D., Rošer, J., and Vulić, M., 2020. Investigation of unmanned aerial vehicles-based photogrammetry for large mine subsidence monitoring. Minerals, 10: 196. (  0) 0) |
Kouame, K. J. A., Yao, K. A., Jiang, F., Feng, Y., and Zhu, S., 2017. Dynamic analysis of deep mining disaster control in China and its application in the Ivory Coast's mining activities. Engineering Journal, 21(4): 65-71. DOI:10.4186/ej.2017.21.4.65 (  0) 0) |
Kršák, B., Blišťan, P., Pauliková, A., Puškárová, P., Kovanič, Ľ., Palková, J., et al., 2016. Use of low-cost UAV photogrammetry to analyze the accuracy of a digital elevation model in a case study. Measurement, 91: 276-287. DOI:10.1016/j.measurement.2016.05.028 (  0) 0) |
Laliberte, A. S., and Rango, A., 2009. Texture and scale in object-based analysis of subdecimeter resolution unmanned aerial vehicle (UAV) imagery. IEEE Transactions on Geoscience and Remote Sensing, 47: 761-770. DOI:10.1109/TGRS.2008.2009355 (  0) 0) |
Li, N., Yang, L., Groves, D., Li, H., Liu, X., Liu, J., et al., 2020. Tectonic and district to deposit-scale structural controls on the Ge'erke orogenic gold deposit within the Dashui-Zhongqu District, West Qinling Belt, China. Ore Geology Reviews, 120: 103436. DOI:10.1016/j.oregeorev.2020.103436 (  0) 0) |
Li, S. W., Xu, W. B., and Li, Z. W., 2022. Review of the SBAS-InSAR time-series algorithms, applications, and challenges. Geodesy and Geodynamics, 13: 114-126. DOI:10.1016/j.geog.2021.09.007 (  0) 0) |
Mahboob, M. A., Genc, B., Celik, T., Ali, S., and Atif, I., 2020. Modeling and analysis of Lily gold mine disasters using geoinformatics. GeoJournal, 85: 837-862. DOI:10.1007/s10708-019-09995-z (  0) 0) |
Massonnet, D., and Feigl, K. L., 1998. Radar interferometry and its application to changes in the Earth's surface. Reviews of Geophysics, 36(4): 441-500. DOI:10.1029/97RG03139 (  0) 0) |
Members, M. C., 2017. Mine subsidence: Adaptive innovation for managing challenges. The Proceedings of the Tenth Triennial Conference. Mine Subsidence Technological Society.
(  0) 0) |
Meng, Q., Li, W., Raspini, F., Xu, Q., Peng, Y., Ju, Y., et al., 2021. Time-series analysis of the evolution of large-scale loess landslides using InSAR and UAV photogrammetry techniques: A case study in Hongheyan, Gansu Province, Northwest China. Landslides, 18: 251-265. DOI:10.1007/s10346-020-01490-8 (  0) 0) |
Miller, M. M., and Shirzaei, M., 2022. Spatiotemporal characterization of land subsidence and uplift in Phoenix using InSAR time series and wavelet transforms. Journal of Geophysical Research: Solid Earth, 120(8): 5822-5842. (  0) 0) |
Müezzinoğlu, A., 2023. A review of environmental considerations on gold mining and production. Critical Reviews in Environmental Science and Technology, 33: 45-71. (  0) 0) |
Norgate, T., and Lovel, R., 2006. Sustainable water use in minerals and metal production. Australasian Institute of Mining and Metallurgy Publication Series. Australia, 133-141.
(  0) 0) |
Ohenhen, L, O., and Shirzaei, M., 2022. Land subsidence hazard and building collapse risk in the coastal city of Lagos, West Africa. Earth's Future, 10(12): e2022EF003219. DOI:10.1029/2022EF003219 (  0) 0) |
Pal, A., Rošer, J., and Vulić, M., 2020. Surface subsidence prognosis above an underground longwall excavation and based on 3D point cloud analysis. Minerals, 10: 82. (  0) 0) |
Palamà, R., Crosetto, M., Rapinski, J., Barra, A., Cuevas-González, M., Monserrat, O., et al., 2022. A multi-temporal small baseline interferometry procedure applied to mining-induced deformation monitoring. Remote Sensing, 14(9): 2182. DOI:10.3390/rs14092182 (  0) 0) |
Riba, I., DelValls, T. A., Reynoldson, T. B., and Milani, D., 2006. Sediment quality in Rio Guadiamar (SW, Spain) after a tailing dam collapse: Contamination, toxicity and bioavailability. Environment International, 32(7): 891-900. DOI:10.1016/j.envint.2006.05.011 (  0) 0) |
Sammarco, O., 2004. A tragic disaster caused by the failure of tailings dams leads to the formation of the Stava 1985 foundation. Mine Water and the Environment, 23(2): 91-95. DOI:10.1007/s10230-004-0045-z (  0) 0) |
Samsonov, S., 2019. Three-dimensional deformation time series of glacier motion from multiple-aperture DInSAR observation. Journal of Geodesy, 93: 2651-2660. DOI:10.1007/s00190-019-01325-y (  0) 0) |
Sbeity, I., Villien, C., Combettes, C., Denis, B., Belmega E. V., and Chafii, M., 2023. A novel satellite selection algorithm using LSTM neural networks for single-epoch localization. 2023 IEEE/ION Position, Location and Navigation Symposium (PLANS). Monterey, 105-112.
(  0) 0) |
Shi, W. Q., and Zhang, B., 2018. Prospecting indicators and potential of the Dashui gold ore concentration area in southern Gansu Province. Geology and Exploration, 54: 490-500 (in Chinese with English abstract). (  0) 0) |
Šílený, J., and Milev, A., 2006. Seismic moment tensor resolution on a local scale: Simulated rockburst and mine-induced seismic events in the Kopanang gold mine, South Africa. Pure and Applied Geophysics, 163(8): 1495-1513. DOI:10.1007/s00024-006-0089-z (  0) 0) |
Šílený, J., and Milev, A., 2008. Source mechanism of mining induced seismic events-resolution of double couple and nondouble couple models. Tectonophysics, 456(1-2): 3-15. DOI:10.1016/j.tecto.2006.09.021 (  0) 0) |
Tavus, B., Kocaman, S., and Nefeslioglu, H. A., 2022. Landslide detection using InSAR time series in the Kalekoy dam reservoir: Bingol, Türkiye. Image and Signal Processing for Remote Sensing XXVIII. Berlin, 218-226.
(  0) 0) |
Tong, X., Liu, X., Chen, P., Liu, S., Luan, K., Li, L., et al., 2015. Integration of UAV-based photogrammetry and terrestrial laser scanning for the three-dimensional mapping and monitoring of open-pit mine areas. Remote Sensing, 7: 6635-6662. DOI:10.3390/rs70606635 (  0) 0) |
Turner, D., Lucieer, A., and De Jong, S. M., 2015. Time series analysis of landslide dynamics using an unmanned aerial vehicle (UAV). Remote Sensing, 7: 1736-1757. DOI:10.3390/rs70201736 (  0) 0) |
Uysal, M., Toprak, A. S., and Polat, N., 2015. DEM generation with UAV Photogrammetry and accuracy analysis in Sahitler hill. Measurement, 73: 539-543. DOI:10.1016/j.measurement.2015.06.010 (  0) 0) |
Wang, B., Tan, Z., and Deng, K., 2022a. Time series monitoring and analysis of surface subsidence in western mining areas based on DS-InSAR. Metal Mine, 5: 160-169. (  0) 0) |
Wang, H., Li, R., Qin, Y., Liu, Z., and Gu, J., 2022b. Application of time series InSAR technology in monitoring ground deformation of mining area: A case study at Huolinhe open pit mining area in Inner Mongolia. The Chinese Journal of Geological Hazard and Control, 33(2): 71-78. (  0) 0) |
Wang, R., Wu, K., He, Q., He, Y., Gu, Y., and Wu, S., 2022c. A novel method of monitoring surface subsidence law based on probability integral model combined with active and passive remote sensing data. Remote Sensing, 14: 299. DOI:10.3390/rs14020299 (  0) 0) |
Wang, W., Tang, R., Li, C., Liu, P., and Luo, L., 2018. A BP neural network model optimized by mind evolutionary algorithm for predicting the ocean wave heights. Ocean Engineering, 162: 98-107. DOI:10.1016/j.oceaneng.2018.04.039 (  0) 0) |
Wang, Z., and Zhou, W., 2021. Monitoring two-dimensional surface deformation with radar interferometry in Jinchuan West No. 2 Mine. Mine Surveying, 49(6): 77-81. (  0) 0) |
Yang, W., He, Y., Zhang, L. F., Wang, W. H., Chen, Y. D., and Chen, Y., 2022. InSAR monitoring of 3D surface deformation in Jinchuan mining area, Gansu Province. Remote Sensing for Natural Resources, 34(1): 177-188 (in Chinese with English abstract). (  0) 0) |
Zhao, J., Yang, X., Zhang, Z., Niu, Y., and Zhao, Z., 2023. Mine subsidence monitoring integrating DS-InSAR with UAV photogrammetry products: Case studies on Hebei and Inner Mongolia. Remote Sensing, 15: 4998. DOI:10.3390/rs15204998 (  0) 0) |
Zhang, J., Fu, M., Chen, J., Chu, P., and Zhang, C., 2018. Variations in mine subsidence-disturbed residential land price: Case study of critical determinants and spatial relationships in the Nanhu Ecoregion of Tangshan. China Journal of Urban Planning and Development, 144(3): 05018012. DOI:10.1061/(ASCE)UP.1943-5444.0000457 (  0) 0) |
Zhang, L., Lu, Z., Ding, X., Jung, H. S., Feng, G., and Lee, C. W., 2012. Mapping ground surface deformation using temporarily coherent point SAR interferometry: Application to Los Angeles Basin. Remote Sensing of Environment, 117(1): 429-439. (  0) 0) |
Zhang, Y., Lian, X., Ge, L., Liu, X., Du, Z., Yang, W., et al., 2022. Surface subsidence monitoring induced by underground coal mining by combining DInSAR and UAV photogrammetry. Remote Sensing, 14: 4711. DOI:10.3390/rs14194711 (  0) 0) |
Zhou, D., Qi, L., Zhang, D., Zhou, B., and Guo, L., 2020. Unmanned aerial vehicle (UAV) photogrammetry technology for dynamic mining subsidence monitoring and parameter inversion: A case study in China. IEEE Access, 8: 16372-16386. DOI:10.1109/ACCESS.2020.2967410 (  0) 0) |
Zhou, D., Wang, L., An, S., Wang, X., and An, Y., 2022. Integration of unmanned aerial vehicle (UAV)-based photogrammetry and InSAR for mining subsidence and parameters inversion: A case study of the Wangjiata Mine, China. Bulletin of Engineering Geology and the Environment, 81: 343. DOI:10.1007/s10064-022-02845-2 (  0) 0) |
Zhu, J., Yang, Z., and Li, Z., 2019. Recent progress in retrieving and predicting mining-induced 3D displacements using InSAR. Acta Geodaetica et Cartographica Sinica, 48(2): 135-144. (  0) 0) |
Zhu, M. F., Yu, X. X., Tan, H., and Yuan, J. J., 2024. Integrated high-precision monitoring method for surface subsidence in mining areas using D-InSAR, SBAS, and UAV technologies. Scientific Reports, 14: 12445. DOI:10.1038/s41598-024-63400-5 (  0) 0) |
 2025, Vol. 24


