2) CNOOC China Ltd., Shanghai 200335, China;
3) School of Earth Sciences, China University of Geosciences, Wuhan 430074, China;
4) College of Marine Geosciences, Ocean University of China, Qingdao 266100, China;
5) College of Geological Science and Engineering, Shandong University of Science and Technology, Qingdao 266590, China
The calculation of the erosion thickness is always difficult, and it is a hot spot in sedimentary basin researches. The calculation of the denudation thickness based on identification of unconformities and subdivision of tectonic periods in formations represents the key to the recovery of the prototype basin and is also the foundation for the researches on oil and gas evolution, fluid migration and accumulation (Zhang et al., 2014). If the denuded thickness is small, we can ignore its impact on the generation, migration and accumulation of oil and gas. However, if the erosion is serious, tectonic uplift will have a strong denudation effect on the original filling sequences in the basin. In particular, denudation will damage the reservoir and cap formations, resulting in the leakage of oil and gas (Li et al., 2000; Huang et al., 2006; Cao et al., 2007; Li et al., 2010; Zhang et al., 2015b; Tian et al., 2016).
Early methods proposed for the restoration of the denuded thickness were mainly stratigraphic correlation methods, sedimentation rate methods, acoustic time difference (AC) methods, vitrinite reflectance (Ro%) methods and wave equation methods (Magara, 1976; Dow, 1977; Katz et al., 1988; He and Wang, 1989; Liu et al., 1995), which have been continuously improved and developed since being proposed (Chen et al., 1999; Hu et al., 1999; Tong et al., 2005; Tong and Zhu, 2006). New methods for the recovery of the denudation thickness include the apatite fission track (AFT) technique, the temperature recovery of inclusions and the synthetic analysis of sedimentary structures (Liu and Zhou, 1997; Hu, 2004; Zhao et al., 2006; Shi et al., 2011). Milankovitch cycle theory is often applied to recover the erosion characteristics of marine carbonate rocks, and researchers have consequently provided new ideas for the recovery of the denudation thickness (Yu et al., 2013; Yuan et al., 2014; Guo et al., 2015; Wu et al., 2015; Yang et al., 2016). However, all of these methods rely on logging data and geochemical data. Therefore, it is difficult to obtain reliable results using above methods in new exploration areas with little drilling data. For restoring the eroded thickness in new exploration areas, some scholars proposed a thickness analysis method of sedimentary stratigraphic trends based on seismic data (Li et al., 2007; Liang et al., 2009; Mao et al., 2010).
Under low oil prices, the Lishui Sag of the East China Sea Shelf Basin (ECSSB) is facing great pressures related to exploration and development; thus, it is urgent to find alternative reserves. However, there is no clear understanding of the erosion thickness in this area. The stratum trend comparison technique, mudstone acoustic time difference method, vitrinite reflectance and fluid inclusions were used to calculate the denudation of the ECSSB, and the influence of tectonic denudation on the accumulation of oil and gas was analyzed briefly (Zhang et al., 2015a). But previous researches were mainly concentrated on the Xihu depression (Maruyama et al., 2007; Ni et al., 2011; Li et al., 2015, 2016). The study area is in the southern Lishui Sag. New, high-quality three-dimensional (3D) seismic data are applied to the recovery of the erosion thickness in this paper. The methods used in the study area to determine the eroded thicknesses of key unconformities are the mudstone acoustic time difference (AC) method, vitrinite reflectance (Ro%) method and stratigraphic trend comparison method. On the basis of the regional structural evolution, the restoration of the paleogeomorphology is carried out to provide a basis for the optimization of the favorable oil and gas formation zone. First, the formation mechanism of denudation in the study area is analyzed, and the mudstone acoustic time difference method and vitrinite reflectance method are used to calculate the erosion thickness of the area; however, these two methods are not very effective because of the poor quality of the logging data. In this area, the application of seismic stratigraphic trend is considered to delineate the extent of denudation.
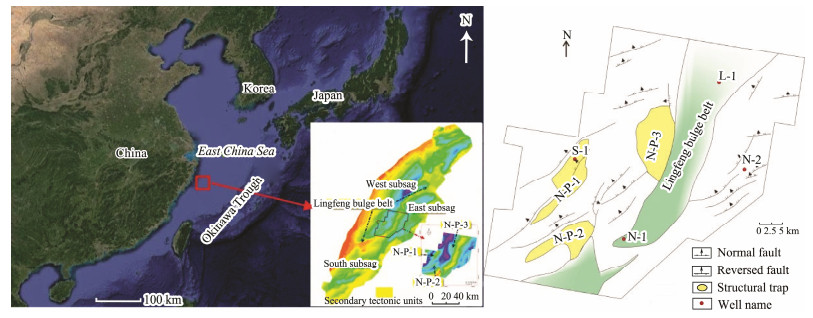
2 Geological SettingThe East China Sea Shelf Basin is located along the southeastern margin of the Eurasian plate, to the north of the southern China plate, and it is a part of the western Pacific tectonic system (Zhu et al., 2012; Zhao et al., 2016; Zhu et al., 2016). The Lishui Sag is located in the East China Sea Shelf Basin in the western depression belt confined by the the southwest Fujian and Zhejiang uplift zones to the west, the Jiaojiang Sag to the north, and the southeast Yandang uplift (Luan et al., 2001; Liu et al., 2004; Chough et al., 2010; Li et al., 2011; Chen et al., 2012; Dai et al., 2014; Sun et al., 2017). The Lishui Sag trends in NE direction. Its length from north to south is 110–150 km, and it has an average east-west width of 70–100 km. The area ranges from 0.99×10⁴ to 1.5×10⁴ km2 (Fig.1). The Lishui Sag is characterized by a concave interphase structural framework. It can be divided into a series of secondary tectonic units (Fig.1): the west subsag, east subsag, south subsag and Lingfeng bulge belt. Among them, the west subsag is located on the western side of the Lingfeng depression belt from Lishui (now Tg). 3D visualization image (Fig.1) shows that the maximum formation burial depth in the west subsag buried depth is 9000– 10000 m. The east subsag is located in the eastern Lingfeng depression belt with a maximum stratigraphic buried depth of 5000 – 6000 m in the north, while the maximum stratigraphic buried depth in the south is more than 5000 m. The south subsag is located in the south of Lingfeng depression belt, and the maximum stratum buried depth is 3500 – 4500 m. In 2015, broadband cable technology was used to acquire 3D seismic data in the central and southern part of the Lishui Sag (the area in red box, Fig.1). This new 3D exploration area is the key research area.
|
Fig. 1 Substructural units of the Lishui Sag. The study area is the new exploration area with 3D seismic method (S-3D), and outlined in the red box. |
The related drilling data shows that the sedimentary basement in the Lishui Sag is Mesozoic volcanic rock, intrusive rock and Mesoproterozoic metamorphic rock. The strata encountered by drilling at present are the Cretaceous Shimentan formation (K2s) in addition to Paleogene, Neogene and Quaternary units. The target strata are Paleogene strata, including the Yueguifeng formation (E1y), Lingfeng formation (E1l), Mingyuefeng formation (E1m), Oujiang formation (E2o) and Wenzhou formation (E2w), lacking upper Eocene and Oligocene formations (Flower et al., 1977; Hilde et al., 1977; Isozaki, 1977). The dark mudstone in each formation is thick and widely distributed.
3 Materials and MethodsThe research data include seismic data, log data, and core analysis data, including log and geochemical data from 5 wells. The area of 3D seismic data used can reach 1000–1200 km2. The 3D seismic data were obtained by wideband oblique acquisition. Many domestic and foreign methods are available to calculate the erosion thickness, although each method has its own advantages, disadvantages, and scope of application. In view of the data in the study area (i.e., seismic data, log data, and core analysis data), the main method employed is the seismic stratigraphic trend contrast method, and the mudstone acoustic time difference method and the vitrinite reflectance method are used as auxiliary methods. The basic idea is as follows: in a well area, the vitrinite reflectivity method and mudstone sonic time difference method are used to restore the thickness of erosion in various layers of drilling, but seismic data are used in well-free areas. On the basis of explicit interface contact relationships and erosion types, the stratigraphic denudation thickness in the study area is restored by extending the trend of the denuded strata thickness. This method is suitable for the areas with a large amount of seismic data and a small amount of drilling data and has the ability to combine the data from from point and surface measurement. It takes into account both the lateral resolution of seismic data and the vertical resolution of drilling data.
3.1 Mudstone Acoustic Time Difference MethodThe mudstone compaction extrapolation method, which was proposed by Magara (1976), considers a certain relationship between the sonic time difference (Δt) of the mudtionship between the sonic time difference (Δt) of the mudstone and the buried depth (H). The formula is as follows:
| $\Delta t = \Delta {t_0}{{\rm{e}}^{ - CH}}.$ | (1) |
The value of Δt is the acoustic time difference of any buried mudstone. The value of t0 is the acoustic time difference of the unconsolidated mudstone. C is the slope of the normal compaction curve. H is the buried depth of mudstone. A theoretical value of Δt0 is in the range of 188–198 μs ft−1. In this study, we adopt 188 μs ft−1 as Δt0.
If the compaction law of strata under the unconformity surface does not change, the standard exponential relationship between the depth and the sonic time difference of rocks will not change due to erosion. Therefore, it is possible to establish a fitting curve for the sonic time difference and depth. The curve is extended to the point that Δt equals Δt0, and the corresponding depth is the level of primary surface. The distance between the primary surface and the unconformable surface is the thickness of the denudation.
Therefore, the AC of mudstone with a thickness greater than 5 m is acquired for wells L-1, L-2, N-1, S-1, and N-2. However, the relationship between the AC and depth can not be built (Fig.2), because the data are insufficient to synthesize a curve. Consequently, the thickness of the eroded strata cannot be restored by the mudstone acoustic time difference method.

|
Fig. 2 The relationship diagram between AC and depth for L-1 well (A) and L-2 well (B). |
Based on the single well data and the application of this method in the study area, we drew the following two conclusions. First, this method requires the data on the well to be as complete as possible. Second, the mudstone section needs to alternate with a sandstone section. This method is not suitable for all wells, and this method is ineffective for the Lishui Sag.
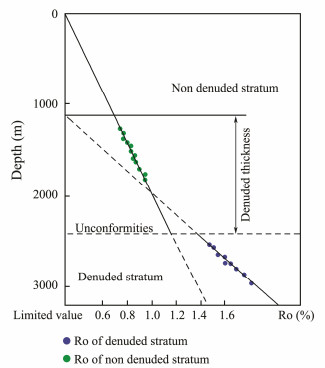
3.2 Vitrinite Reflectance MethodThe principle and method of the vitrinite reflectance method are shown in Fig.3 (Tong et al., 2005). According to previous studies, the Ro% value of the paleo surface in the Lishui Sag is 0.2%. The trend line of the Ro% with depth is extended to 0.2%, and intersects with the depth axis. The depth corresponding to the value of 0.2% represents the ancient burial depth. The difference between the ancient burial depth and the present burial depth is the erosion thickness. The restrictive conditions of the vitrinite reflectance method are similar to those of the mudstone acoustic time difference method.
|
Fig. 3 The diagram of vitrinite reflectance (Ro%) vs. depth to be used to calculate the denudation depth, after Tong et al. (2005). |
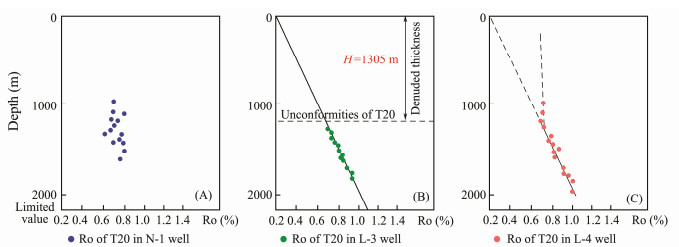
Ro% values from the 3 wells in the study area are collected, and the relationship between the Ro% and depth is analyzed (Fig.4). It can be seen that the method must be carried out in the experimental section, and the data are more insufficient than those of the mudstone acoustic time difference method. The accuracy of the data is questionable, so the operability of this method in the study area is poor. In Fig.4A, there is no linear relationship between the depth and Ro% for T20 in well N-1. The relationship between the depth and Ro% for T20 in well L-4 changes with the direction. The thickness of T20 can only be calculated in well L-3, and the result is quite different from the reality.
|
Fig. 4 Application of the vitrinite reflectance method in different wells. (A), Ro% of T20 in well N-1; (B), Ro% of T20 in well L-3; (C), Ro% of T20 in well L-4. |
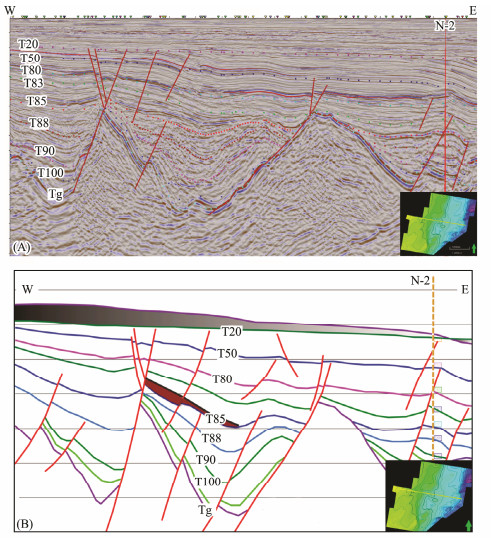
The assumption of the stratigraphic trend comparison method is that the thickness of the strata is uniform or that the thickness varies evenly before erosion. Under this assumption, the thickness of the denuded strata can be estimated by interpolation and extrapolation. Interpolation is carried out according to the thicknesses and sedimentary boundaries (where the thickness is zero) of non-eroded strata. In addition, extrapolation is based on the thickness of a two-point formation that has not been denuded. In the case of the erosion of local tectonic formations, the thickness of the denudation obtained by this method is more accurate (Fig.5). A specific discussion will be provided in Chapter 4.
|
Fig. 5 Application of the stratigraphic trend comparison method. (A), West-east-oriented new 3D seismic section showing the important horizons and faults; (B), denudation of the T20 and T85 horizons; the gray area is the eroded stratum on T20, and the red area is the eroded stratum on T85. |
According to previous research results and existing data (Zheng et al., 2005), since the Mesozoic, the ECSSB has experienced multiple tectonic movements, which produced a large number of regionaland local-scale unconformities that play an important role in the internal tectonic evolution, structural pattern, structural form, fracture combination and oil and gas accumulation in the depression. From early to late, these movements include the Keelung movement during the early Jurassic Period (Tg), the Yandang movement at the end of the late Cretaceous (T100), the Mingyuefeng movement during the late Paleocene (T85), the Oujiang movement during the late Paleocene (T80), and the Huagang movement at the end of the Oligocene (T20). Due to the different modes, effects, time and scales of these tectonic movements, the paleoen-vironment and paleoclimate conditions during each event were different. Unconformities formed in different periods have different structural features. In the study area, there are three obvious unconformities, including the unconformity at the bottom of the lower Mingyuefeng formation (E1m) caused by the Mingyuefeng movement, the unconformity at the bottom of the Oujiang formation (E2o) caused by the Oujiang movement, and the unconformity at the bottom of the lower Longjing formation (N1l) caused by the Huagang movement.
1) The unconformity at the bottom of E1m (T85) caused by the Mingyuefeng movement
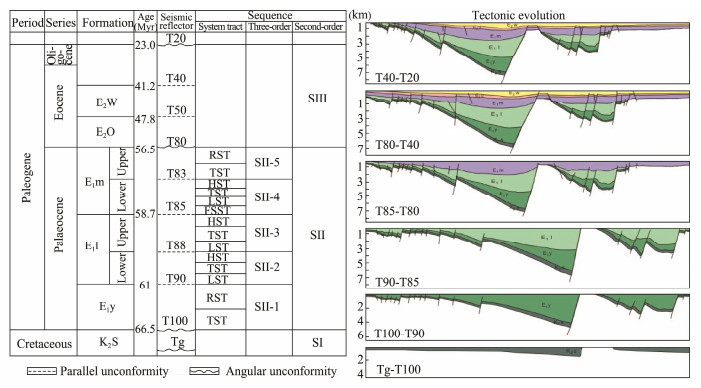
The Mingyuefeng movement occurred during the middle and late Paleocene corresponding to the period of fault depression formation in the basin evolution stage. During this period, the dextral tensile stress still had a controlling effect on the tectonics, but the strength greatly weakened. The fault depression is not obvious in the industrial exploration area, and the main fault activities either weakened or stopped entirely. Some areas experienced tilting and folding, and the strata have been subjected to partial denudation. The late developed strata overlay these strata, forming a typical super-unconformity (Fig.6).
|
Fig. 6 The stratigraphic units of Paleocene in Lishui Sag. |
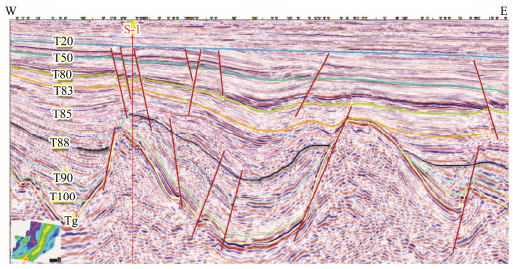
In addition, the T88 seismic reflection interface at the bottom of the upper E1l is characterized by unconformities in the area around the well S-1 (Fig.7). According to the analysis, the main fault in N-P-1 (drilled well S-1) has been active until the early stage of sedimentary formation in the upper E1l, which caused the upthrown block of the fault to be lifted. Then, the strata suffered partial erosion. In the southern part of the work area (N-P-2), the T88 interface is characterized by the bottom boundary of an overlying unconformity (Fig.7). These findings show that the area was firstly controlled by fault-related tectonic tilting to form a local high point, then it was overlain by the upper part of the strata.
|
Fig. 7 Inline of the S-3D. Line drawings show the seismic interpretation results, including the layers and fault. |
2) The unconformity at the bottom of E2o (T80) caused by the Oujiang movement
This movement occurred during the late Paleocene and the early Eocene. The tensile stress in the working area was weakened, and a compressive stress developed corresponding to the forming stage of depression during the evolution of the basin. The main faults formed in the faulting period basically weakened or stopped altogether, and the Lingfeng Bulge was submerged. During this movement, the east and west subsag were joined together. In the slope area of basin, the strata are obviously uplifted and eroded, forming a parallel unconformity in the sedimentary sag.
3) The unconformity at the bottom of Lower N1l (T20) caused by the Yuquan movement
The Yuquan movement occurred during the late Eocene and the early Oligocene, and the basin exhibits a depositional break about 17 Myr. The movement shows the characteristics of extrusion, which is the result of the processes of folding, uplifting, erosion and isostatic equilibrium, and magmatic activities. This movement resulted in an obvious angular unconformity between the upper and lower strata (Fig.7). In the western part of the shelf basin, the Yuquan movement is characterized by uplift, denudation and magmatic activities due to the boundary conditions of the Zhejiang Fujian uplift. The central part of the basin is mainly characterized by wide folding. The T20 interface marks the end of the Yuquan movement. During the Neogene Period, the basin entered the stage of regional subsidence, and the sedimentary stratigraphic relationship was parallel and subparallel.
In summary, in the study area, the three key unconformities controlling the formation and evolution of the Lishui depression are T85, T80 and T20. However, because the research area is mainly in a depression area, the T80 interface is characterized by a parallel unconformity, and thus, the erosion of the layers cannot be recovered. Based on the single well and seismic data, the two critical unconformities of T85 and T20 are calculated.
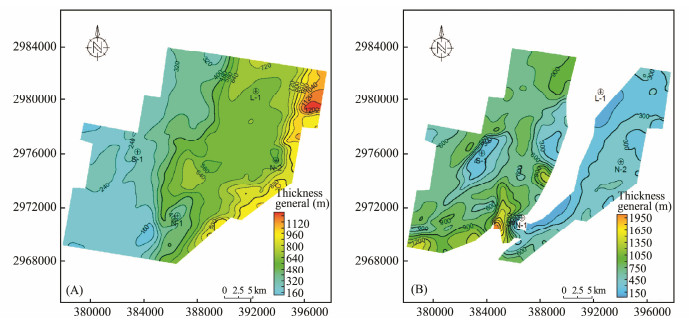
4.2 Calculation of the Denudation Thickness by the Stratigraphic Trend Comparison Method 4.2.1 Thickness of the residual strataThe top and bottom boundary of the target strata in the time domain is obtained by 3D seismic data. The seismic data are converted into a contour map in the depth domain through a time-depth fitting formula and corrected by drilling data. The present residual thickness can be expressed as the depth difference between the top and bottom layers (Fig.8).
|
Fig. 8 The residual thickness of the strata E2w (A) and upper E1l (B). |
The erosion thickness is calculated by the stratigraphic trend method, and the missing strata are determined by the trend of the residual strata.
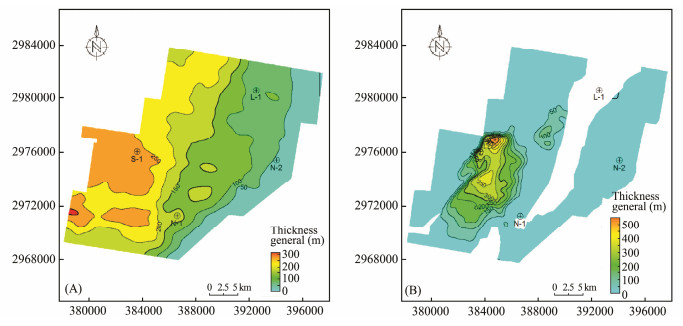
Based on the regularities of the thickness in the horizontal direction for the sedimentary strata in the same era, the original sedimentary layers in E2w and E1l are interpreted from the seismic data. The original deposition thickness is then determined, and the erosion thicknesses of the E2w and Upper E1l formations are obtained by subtracting the residual thickness from the original deposition thickness (Fig.9).
|
Fig. 9 The eroded thickness of the strata E2w (A) and upper E1l (B). |
The E2w stata in the work area were basically denuded, as shown in Fig.9A. The total denudation thickness is 0– 550 m, and the denudation magnitude becomes gradually smaller from west to east. The thickness of erosion in the west is more than 200 m. The largest amount of erosion is observed around well S-1. All 5 wells were denuded, and the denudation thickness near well S-1 was the largest. The denudation around well N-2 was the smallest with a thickness of less than 100 m.
The denudation area of the upper E1l strata is located in N-P-1, N-P-2, and N-P-3, as shown in Fig.9B. Among them the area of denudation in N-P-1 (near well S-1) ad N-P-2 is 200–230 km2, and the denudation thickness is 0 – 600 m, increasing from south to north, up to 200 – 400 m around the well S-1. In N-P-3, the extent of denudation is 30 – 50 km2, and the denudation thickness is 0 – 400 m.
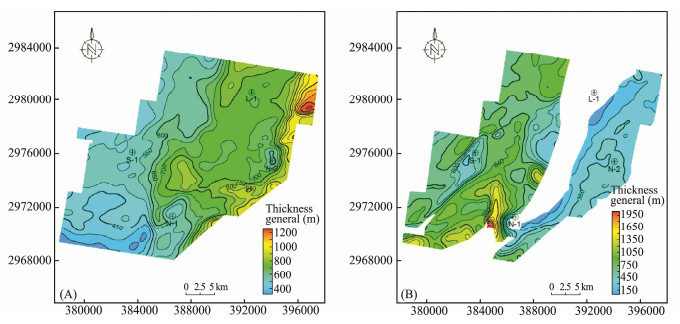
4.2.3 Thickness of the original strataThe thickness of the original strata is the sum of the thickness of the strata being denuded and the thickness of the remaining strata, as shown in Fig.10. However, this is not the final thickness, which needs to be corrected by decompaction.
|
Fig. 10 The thickness of the E2w (A) and upper E1l (B) strata. |
The paleo deposition or burial thicknesses of strata can be restored from the measured thickness in a certain area. There are many mathematical models for paleo-thickness restoration, but all of them are based on the following three hypotheses:
1) In compacted strata, the volume of formation skeleton is always the same, and the formation volume can decrease because of the decrease of pore volume. 2) In the compaction process, the lateral width of the strata remains unchanged, and the thickness decreases with the floor volume. 3) The degree of formation compaction is determined by the depth of embedment, which is irreversible. That is, when the buried depth does not exceed the maximum buried depth, the degree of formation compaction is constant.
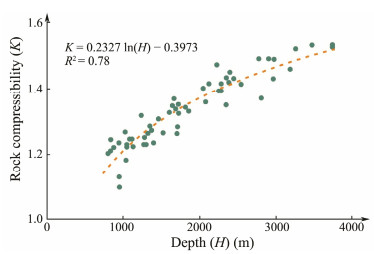
Collecting data from the five wells, the relationship between the depth and compaction coefficient is determined, and the compaction coefficient-depth mathematical model is established. Based on the drilling data in the study area, the equation of the regional compaction curve is shown in Fig.11. The relationship between the depth (H) and rock compressibility (K) is expressed as follows:
|
Fig. 11 The relationship between depth and rock compressibility. |
| $H = 11.667{{\rm{e}}^{3.728K}}, $ | (2) |
| $K = 0.2327\ln (H) - 0.3973.$ | (3) |
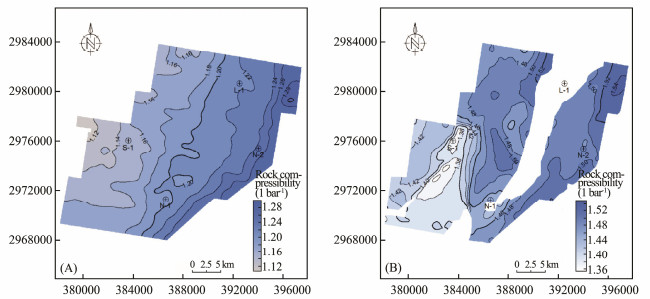
Using the above empirical formula, we can calculate the rock compressibility of the E2w (Fig.12A) and upper E1l (Fig.12B) strata.
|
Fig. 12 The rock compressibility of the E2w (A) and upper E1l strata (B). |
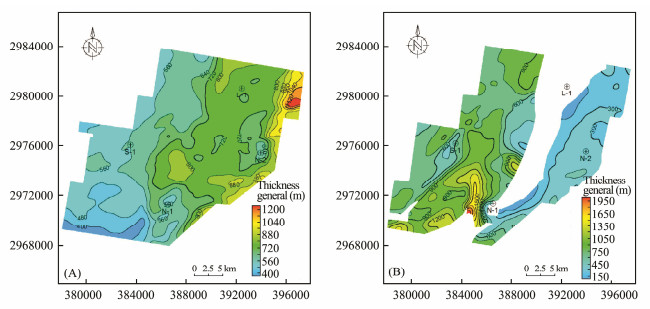
With the residual stratum as the main frame, the compaction correction is carried out based on the rock compressibility. The denudation thickness above the unconformable surface is compensated. Finally, the thickness of the original sediments is obtained (Fig.13). After the denudation correction, it can be seen from the original thickness contours that the thickness of the original strata is quite different from the residual thickness, but their distribution pattern and development rules are consistent with those of the residual strata.
|
Fig. 13 The thickness of original strata after the compaction correction for the E2w (A) and upper E1l strata (B). |
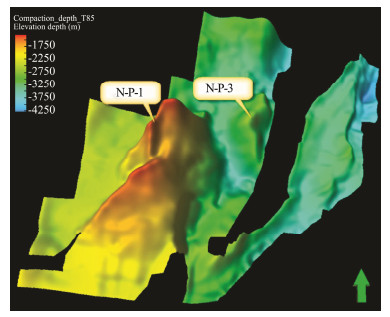
The paleogeomorphology is the result of tectonic activities, sedimentary filling, differential compaction, weathering and denudation in the basin. As a fundamental control on the sequence development, the paleogeomorphology controls the formation and distribution of later sequences and sedimentary systems. According to the principle of sedimentary compensation, the sedimentary strata are the result of filling and polishing the strata, and the thickness of the original strata can reflect the paleogeomorphology in the basin. Thicker sedimentary strata correspond to lower elevations of the paleogeomorphology. Therefore, with the principle of a negative correlation between the stratigraphic thickness and paleogeomorphic elevation, combined with the original thickness of the restoration area, the paleo-geomorphological features of the study area can be obtained. Taking the upper E1l as an example, in the early stage, one north-south strike slip fault began to develop in the southern study area. Affected by this fault, the southern Lingfeng bulge was offset, forming a gorge. The eastern and western sides of the concave belt connected to each other. On the basis of the paleo-geomorphological characteristics, it can be inferred that the sedimentary center of the west subsag began to migrate to the south. Further, the N-P-2 area was transformed from a slope to a deposition center. Due to the influence of a north-east compressive stress, the compressive anticline structure in N-P-3 began to form. In the highland, the strata was thin, and the thick strata was overlain in the low area on the flank of the structure (Fig.14).
|
Fig. 14 Palaeo-geomorphic map in the upper Paleocene in the southern part of the Lishui Sag. |
1) In the study area, the erosion and denudation above three unconformable surfaces (T85, T80 and T20) were studied by the formation trend method. The entire E2w in the study area has been denuded. The total denudation thickness is in the range of 0–550 m, and the denudation becomes gradually smaller from west to east. The erosion thickness in the west is more than 200 m. The eroded zone of the upper E1l is mainly located in N-P-1, the N-P-2 and the N-P-3. The erosion area in N-P-1 and N-P-2 is about 200 – 230 km2, and the denudation thickness is in the range of 0 – 600 m, which increases from south to north, up to 200 – 400 m in the area around the well S-1. In N-P-3, the extent of denudation is 30 – 50 km2, and the denudation thickness is 0 – 400 m.
2) In the early stage of the upper E1l, one north-south strike slip fault began to develop and offset the Lingfeng bulge to form gorge. Then the sedimentary center of the west subsag began to migrate to the south.
3) The characteristics of paleo faults were determined by the new 3D seismic data in the central and southern Lishui Sag. At the observed time scale, the paleo depression in the rifting period (Tg-T80) was first enhanced and then weakened, as discerned in the new 3D seismic data from the Lishui Sag. The fault depression reached its maximum during the sedimentary period of the E1l. At the spatial scale, the paleo fault depression is largest in the southern part of the study area, followed by the northern part, and it is the smallest in the middle.
AcknowledgementThis study was supported by the National Science and Technology Major Projects (No. 2016ZX05027-001-006).
Cao, Q., Ye, J.R. and Wang, W., 2007. Methods of eroded strata thickness restoration in sedimentary basins and its advancement. China Petroleum Exploration, 6: 41-46 (in Chinese with English abstract). (  0) 0) |
Chen, J.T., Chough, S.K., Lee, J.H. and Han, Z.Z., 2012. Se-quence-stratigraphic comparison of the upper Cambrian series 3 to Furongian succession between the Shandong region, China and the Taebaek area, Korea:High variability of bounding surfaces in an epeiric platform. Geosciences Journal, 16(4): 357-379. DOI:10.1007/s12303-012-0040-5 (  0) 0) |
Chen, Z.Z., Liu, G.D. and Hao, S.S., 1999. A corrected me-thod of using vitrinite reflectance data to estimate the thickness of sediment removed at an unconformity. Acta Sedimentologica Sinica, 17(1): 141-144. (  0) 0) |
Chough, S.K., Lee, H.S., Woo, J.S., Chen, J.T., Choi, D.K., Lee, S.B., Kang, I., Park, T.Y. and Han, Z.Z., 2010. Cambrian stratigraphy of the north China platform:Revisiting principal sections in Shandong Province, China. Geosciences Jour-nal, 14(3): 235-268. (  0) 0) |
Dai, L.M., Li, S.Z., Lou, D., Liu, X., Suo, Y.H. and Yu, S., 2014. Numerical modeling of late Miocene tectonic inversion in the Xihu Sag, East China Sea Shelf Basin, China. Journal of Asian Earth Sciences, 86(2): 25-37. (  0) 0) |
Dow, W.G., 1977. Kerogen studies and geological interpretations. Journal of Geochemical Exploration, 7: 79-99. DOI:10.1016/0375-6742(77)90078-4 (  0) 0) |
Flower, M.F.J., Tamaki, K. and Hoang, N., 1977. Mantle extrusion:A model for dispersed volcanism and DUPAL like asthenosphere in East Asia and the western Pacific. Geodynamic, 27: 67-88. (  0) 0) |
Guo, Y., Tang, L.J., Yue, Y., Chen, G., Long, Y. and Xie, X.T., 2015. Application of cycle analysis method estimate the denuded strata thickness:A case study of middle-lower Ordovician Yingshan formation of the eastern Yubei area, Tarim Basin. Journal of China University of Mining & Technology, 44(4): 664-672. (  0) 0) |
He, S. and Wang, Q.L., 1989. The eroded thickness reconstru-cted by vitrinite reflectance. Geological Review, 35(2): 119-126. (  0) 0) |
Hilde, T.W.C., Uyeda, S. and Kroenke, L., 1977. Evolution of the western Pacific and its margin. Tectonophysics, 38(1-2): 145-165. DOI:10.1016/0040-1951(77)90205-0 (  0) 0) |
Hu, S.B., Wang, J.S. and Zhang, R.Y., 1999. Estimation of the amount of uplift and erosion across an unconformity using vitrinite reflectance data. Petroleum Exploration and Development, 26(4): 42-46 (in Chinese with English abstract). (  0) 0) |
Hu, S.H., 2004. Integrative structural-sedimentary analysis me-thod based on seismic data:A new method for restoring denuded thickness. Oil Geophysical Prospecting, 39(4): 478-483 (in Chinese with English abstract). (  0) 0) |
Huang, H.D., Luo, Q., Wang, C.Y., Jiang, X.J. and Zhu, Z.J., 2006. Mesozoic group denudation recover and its petroleum geologic significations in the west Qaidam Basin. Petroleum Exploration and Development, 33(1): 44-48 (in Chinese with English abstract). (  0) 0) |
Isozaki, Y., 1977. Jurassic accretion tectonics of Japan. Island Arc, 6(1): 25-51. (  0) 0) |
Katz, B.J., Phelfer, R.N. and Schunk, D., 1988. Interpretation of discontinuous vitrinite reflectance profiles. AAPG Bulletin, 72(8): 926-931. (  0) 0) |
Li, D.Y., Dong, B.J., Jiang, X.D. and Xing, J.H., 2016. Geochemical evidence for provenance and tectonic background from the Palaeogene sedimentary rocks of the East China Sea Shelf Basin. Geological Journal, 51(S1): 209-228. (  0) 0) |
Li, D.Y., Guo, T.Y., Jiang, X.D., Zhao, H.Q. and Wang, H.P., 2015. Erosion thickness recovery and tectonic evolution cha-racterization of southern East Sea Shelf Basin. Oil & Gas Geo- logy, 36(6): 913-923 (in Chinese with English abstract). DOI:10.11743/ogg20150606 (  0) 0) |
Li, K., Zhao, X.K., Shen, Z.M., He, J.J. and Zhang, X.B., 2007. Application of trend thickness method in denudation recovery in the Akekule lobe of Tarm Basin. Computing Techniques for Geophysical and Geochemical Exploration, 29(5): 415-419. DOI:10.1016/S1872-5813(07)60034-6 (  0) 0) |
Li, L.T., Pang, X.Q., Xiong, L., Deng, K. and Zhang, J.H., 2010. Recovery of structural trap evolution by mean of denudation value:A case of upper Triassic Xujiahe formation layer in middle section of west Sichuan depression. Natural Gas Geoscience, 21(3): 441-448 (in Chinese with English abstract). (  0) 0) |
Li, P.L., Hou, H. and Ma, H.F., 2000. Tectonics and petroleum potential of the East China Sea Shelf Rift Basin. Acta Geologica Sinica, 74(3): 651-660. (  0) 0) |
Li, X.P., Yang, Z.Y., Zhao, G.C., Rodney, G. and Guo, J.H., 2011. Geochronology of khondalite-series rocks of the Jining complex:Confirmation of depositional age and tectono-me-tamorphic evolution of the North China craton. International Geology Review, 53(10): 1194-1211. DOI:10.1080/00206810903548984 (  0) 0) |
Liang, Q.S., Liu, Z., He, X.H. and Han, J., 2009. Study of stratigraphic denudation recovery by seismic data in new exploration area. Xinjiang Petroleum Geology, 30(1): 103-105 (in Chinese with English abstract). (  0) 0) |
Liu, G.C., Jin, Z.J. and Li, J.C., 1995. A new method on the quantitative study of depositional and erosional processed of sedimentary basins:An application of wave process analysis during basin evolution. Acta Sedimentologica Sinica, 13(3): 23-31. (  0) 0) |
Liu, M., Cui, X.J. and Liu, F.T., 2004. Cenozoic rifting and volcanism in eastern China:A mantle dynamic link to the Indo-Asian collision. Tectonophysics, 393(1): 29-42. (  0) 0) |
Liu, Y.Q. and Zhou, L.F., 1997. Discussion on a method about eroded strata thickness references with Turpan and Hami Basin. Journal of Northwest University (Natural Science Edition), 27(4): 64-66 (in Chinese with English abstract). (  0) 0) |
Luan, X.W., Gao, D.Z., Yu, P.Z. and Zhao, J.H., 2001. The crust velocity structure of a profile in the area of East China Sea and its vicinity. Progress in Geophysics, 2: 28-34. (  0) 0) |
Magara, K., 1976. Thickness of removed sedimentary rocks, paleo-pore pressure and paleotemperature, southwestern part of Western Canada Basin. AAPG Bulletin, 60(4): 54-566. (  0) 0) |
Mao, G.Z., Hua, R.M., Gao, J.F., Zhao, K.D., Long, G.M., Lu, H.J. and Yao, J.M., 2010. Rare earth element and trace element features of gold-bearing pyrite in the Jinshan gold deposit, Jiangxi Province. Acta Geologica Sinica, 84(3): 614-623. DOI:10.1111/j.1755-6724.2010.00077.x (  0) 0) |
Maruyama, S., Santosh, M. and Zhao, D., 2007. Superplume, supercontinent, and post-perovskite:Mantle dynamics and anti-plate tectonics on the core-mantle boundary. Gondwana Research, 11(1-2): 7-37. DOI:10.1016/j.gr.2006.06.003 (  0) 0) |
Ni, J.L., Guo, Y., Wang, Z.M., Liu, J.L., Lin, Y.X. and Li, Y., 2011. Tectonics and mechanisms of uplift in the central uplift belt of the Huimin depression. Journal of Earth Science, 22(3): 299-315. DOI:10.1007/s12583-011-0183-8 (  0) 0) |
Shi, C.L., Ji, Y.L., Li, Q.S. and Liu, D.H., 2011. Using a new method based on homogeneity temperature of fluid inclusion to restore the thickness of eroded strata of CheMo paleo-uplift in Jungger Basin. Journal of Jilin University (Earth Science Edition), 41(1): 64-70. (  0) 0) |
Sun, W.J., Fu, L.Y., Wei, W., Lin, Y. and Tang, Q.Y., 2017. The crust-mantle transition structures beneath eastern China. Chinese Journal of Geophysics, 61(3): 845-855. (  0) 0) |
Tian, T., Ren, Z.L., Yang, P., Cao, Z.P. and Yang, F., 2016. Application of multi-methods for recovering denuded strata thickness of Jurassic and Cretaceous in Yabrai Basin of Inner Mongolia and its geological significance. Journal of Palaeogeography, 18(6): 1002-1011 (in Chinese with English abstract). (  0) 0) |
Tong, Y.M. and Zhu, G.H., 2006. Several important problems of using vitrinite reflectance to restore the amount of denudation. Journal of Oil and Gas Technology, 28(3): 197-199. (  0) 0) |
Tong, Y.M., Song, L.J., Zeng, S.J., Cheng, T. and Wei, N.N., 2005. A new method by vitrinite reflectance to estimate thickness of eroded strata. Journal of Palaeogeography, 7(3): 417-424 (in Chinese with English abstract). (  0) 0) |
Wu, T., Wu, C.X., Qi, Y.P., Yao, A.G., Zhang, S.C., Xu, Y. and Shi, J., 2015. Quantitative resumption method of stratum denudation thickness and its application in Junggar Basin:A case study on the Permian lower Urho formation in block 8 of Karamay Oilfield. Journal of Palaeogeography, 17(1): 81-90 (in Chinese with English abstract). (  0) 0) |
Yang, C.S., Li, S.Z. and Li, G., 2016. Tectonic units and proto-basin of the East China Sea Shelf Basin:Correlation to Meso-zoic subduction of the palaeo-Pacific Plate. Geological Journal, 51(S1): 149-161. DOI:10.1002/gj.2776 (  0) 0) |
Yu, C.H., Xiao, K.Y., Xiao, G.J., Zhang, G.L., Yuan, Z.Y., Hu, Y. and Du, Y.B., 2013. Mesozoic erosion thickness restoration and its implication in Bongor inverted rift basin, Chad. China Petroleum Exploration, 18(5): 45-53 (in Chinese with English abstract). (  0) 0) |
Yuan, Y.S., Lin, J.H., Cheng, X.Y. and Li, S.J., 2014. Yanshan-Himalayan denudation in western Hubei eastern Chongqing area. Chinese Journal of Geophysics, 57(09): 2878-2884. DOI:10.1002/cjg2.20144 (  0) 0) |
Zhang, J.P., Zhang, T. and Tang, X.J., 2014. Basin type and dynamic environment in the East China Sea Shelf Basin. Acta Geologica Sinica, 88(11): 2033-2043. (  0) 0) |
Zhang, M., Zhang, J.L., Xu, F., Li, J.Z., Liu, J.S., Hou, G.W. and Zhang, P.H., 2015a. Paleocene sequence stratigraphy and depositional systems in the Lishui Sag, East China Sea Shelf Basin. Marine and Petroleum Geology, 59: 390-405. DOI:10.1016/j.marpetgeo.2014.09.015 (  0) 0) |
Zhang, S., Chen, S.Y., Wu, Z.P., Wang, Y.S., Li, W., Luo, Y., Hou, X.B. and Zhang, L., 2015b. The application of the erosion thickness restoration method to red beds in the western part of the south slope in Dongying depression. Geology in China, 42(2): 720-736 (in Chinese with English abstract). (  0) 0) |
Zhao, L.B., Huang, Z.L., Gao, G. and Li, J., 2006. A new method for estimating the removed thickness of sediment using homogenization of fluid inclusions. Journal of Xi'an Shiyou University (Natural Science Edition), 21(1): 15-19 (in Chinese with English abstract). (  0) 0) |
Zhao, Z.G., Wang, P., Qi, P. and Guo, R., 2016. Regional background and tectonic evolution of East China Sea Shelf Basin. Earth Science, 41(3): 546-554. (  0) 0) |
Zheng, Q.G., Zhou, Z.Y., Cai, L.G., Lu, Y.D. and Cao, Q.G., 2005. Meso-Cenozoic tectonic setting and evolution of East China Sea Shelf Basin. Oil & Gas Geology, 2: 197-201 (in Chinese with English abstract). DOI:10.3321/j.issn:0253-9985.2005.02.012 (  0) 0) |
Zhu, D.C., Lu, D.W., Shen, X.L., Yang, Q., Li, D.D., Ren, T.L. and Yang, S.P., 2016. Discovery and geological significance of Neoproterozoic metamorphic granite in Jimo, Shandong Province, Eastern China. Acta Geologica Sinica, 90(6): 2080-2096. DOI:10.1111/1755-6724.13023 (  0) 0) |
Zhu, J.J., Wang, Q., Liang, J.S., Wang, H., Tian, B. and Hao, L.W., 2012. Cenozoic geological structure and tectonic evolution of southern East China Sea Shelf Basin. Natural Gas Geoscience, 23(2): 222-229 (in Chinese with English abstract). (  0) 0) |
 2020, Vol. 19


