2) Laboratory for Marine Ecology and Environmental Science, Pilot National Laboratory for Marine Science and Technology (Qingdao), Qingdao 266237, China;
3) College of Environmental Science and Engineering, Ocean University of China, Qingdao 266100, China
Bioaerosols are airborne particles with vital activity or plasmids released into the air by living organisms, including bacteria, fungi, viruses, pollen, plant or animal debris (Mandrioli, 1998; Ariya and Amyot, 2004). Aerosols are important carriers of microorganisms that participate in the biogeochemical cycle, and both terrestrial and marine aerosols are vital components (Ma et al., 2019). The ocean accounts for approximately 70% of the Earth's surface and is the main source of bioaerosols. In marine environments, two main sources of bioaerosols have been identified: marine particles and transported continental particles (Kellogg and Griffin, 2006). The sea-surface microlayer (SML) is the main source of microorganisms entering the atmosphere, and marine aerosols play important roles in the air-sea transport and longdistance transport of microorganisms, climate change and marine ecosystems (Aller et al., 2005). On the one hand, bioaerosols mainly affect the global climate by changing the balance of solar radiation (Xu et al., 2017). Clarke et al. (2006) estimated that the sea salt aerosol flux potentially contributes 5%–90% of marine cloud condensation nuclei in marine regions with little continental effect. On the other hand, bioaerosols affect marine ecosystems. The components in bioaerosols enter the ocean mainly through the atmospheric deposition, which affects marine primary productivity (Pryor et al., 2000). Seitzinger and Sanders (1999) found that the biomass of marine bacteria and phytoplankton altered in a similar manner to the changes in atmospheric organic and ammonia nitrogen contents, but the biomass of dinoflagellates in phytoplankton increased to a greater extent than that of diatoms.
Significant differences have been documented between marine and terrestrial environments, and these differences are responsible for the differences in the distribution characteristics and influencing factors of microorganisms in the marine atmosphere compared with those in the terrestrial atmosphere. The abundance of microorganisms in aerosols of marine environments ranges from 104 to 105 cells m−3, which is 100 to 1000 times lower than that in inland and coastal areas (Bowers et al., 2011; Cho et al., 2011; Hu et al., 2017). The bacterial diversity in aerosols may be related to the source of an air mass. According to the trajectory of air masses, Archer et al. (2020) found that the most abundant bacteria were Burkholderia, Ralstonia and Sphingomonas, which accounted for 28%, 14.4% and 5.5%, respectively, of the marine air masses and 37%, 0.5% and 20%, respectively, of the terrestrial air masses. High-throughput sequencing technology shows that the bacterial communities in marine aerosols are more complex and diverse than those in previous studies (Ma et al., 2019); bacterial communities in the atmosphere over the remote ocean are vulnerable to the source of an air mass, and differences in the dominant genera of bacterial communities have been detected in different sea areas (Xia et al., 2015). For example, aerosols over the Sea of Japan are dominated by Gammaproteobacteria and Bacteroidetes (Cho and Hwang, 2011). The dominant bacteria detected over the Bohai Sea are Bacteroides, Prevotella, and Paracoccus; the dominant bacteria observed over the Yellow Sea are Bacteroides, Prevotella, Pseudomonas, and Sphingomonas; and the dominant bacteria identified over the northwestern Pacific Ocean are Alistipes, Prevotella, and Barnesiella (Ma et al., 2019).
The microbial concentrations and community characteristics of aerosols with different particle sizes are different in the marine environment. Ma et al. (2019) observed a higher bacterial community diversity of coarse particles (> 2.1 μm) than that of fine particles (< 2.1 μm) in aerosols over the Yellow Sea and the northwestern Pacific Ocean; however, the bacterial community diversity of coarse and fine particles in aerosols over the Bohai Sea showed the opposite trend. According to Yu et al. (2013), the concentrations of fungi were mainly distributed in the size range of 2.1 – 3.3 μm in aerosols over the regions of offshore China, the North Pacific Ocean, the central Arctic Ocean and the Canada Basin, but the lowest concentration of fungi was observed in aerosols with a size range of 0.65 – 1.1 μm. In marine environments, the coarse particles in aerosols are not suitable for long-distance transmissions, and under the unfavorable conditions of low temperature, ultraviolet light and relative humidity, microorganisms are often protected by being wrapped with sea salt. However, most microorganisms in fine particles are transported over long distances and suspended in the atmosphere for a period of time, and many of them may not be able to adapt to changes in the environment, resulting in a decrease in community abundance and diversity (Yu et al., 2013; Veron, 2015). Simultaneously, the distance, height and velocity of air mass transmissions affect the geographic distribution of microorganisms in aerosols of different particle sizes and processes of microorganisms serving as cloud condensation nuclei (CCN) and ice nucleating particles (INP) (Jones and Harrison, 2004). Therefore, microorganisms in aerosols with different particle sizes may affect ecology.
Currently, the number of reports on the microbial community structure of aerosols with different particle sizes in marine environments is still limited. Thus, extensive research is needed to reveal the characteristics of the microbial community structures in aerosols of different particle sizes, influencing factors, and ecological significance of microorganisms in the aerosols of marine environments. In this study, we used aerosol samples with different particle sizes collected from northern Chinese marginal seas and the northwestern Pacific Ocean in autumn as the objects and studied the bacterial abundance, community composition and distribution in aerosols using Illumina high-throughput sequencing based on 16S rRNA genes and quantitative real-time PCR (qPCR), combined with the analysis of backward trajectory and environmental factors. The purposes of the present study were as follows: 1) to determine the abundance, diversity, and composition of the bacterial community in aerosols from coastal waters to the distant ocean and 2) to reveal potential links between the abundance and community composition of bacteria and environmental factors.
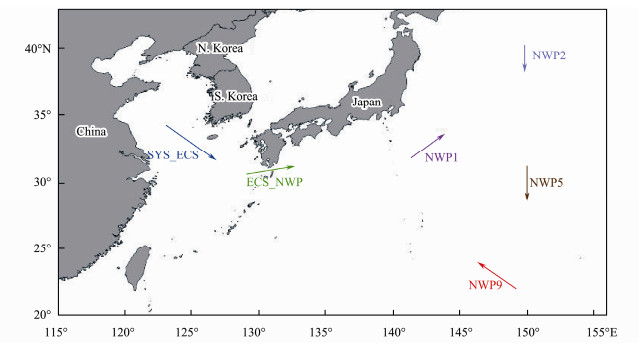
2 Materials and Methods 2.1 Sample CollectionFrom 1 to 23 November 2019, six sets of aerosol samples were collected during a cruise on R/V Dongfanghong 3 from the Chinese marginal seas (SYS_ECS and ECS_ NWP) to the northwestern Pacific Ocean (NWP1, NWP2, NWP5 and NWP9) (Fig.1), and each site represented the sampling area. Size-segregated aerosol samples were collected on 0.22-μm polycarbonate membrane filters (Shenghechengxin Membrane Science and Technology Development Center of Beijing, China) for approximately 12 h with a sampling flow rate of 28.3 L min−1 using a six-stage microorganism FA-1 cascade impactor (Applied Technical Institute of Liaoyang, China). The six particle sizes of the sampler were 0.65 – 1.1, 1.1 – 2.1, 2.1 – 3.3, 3.3 – 4.7, 4.7 – 7.0, and > 7.0 μm, which were referred to as classes 1 to 6, respectively, in this study. Particles larger than 2.1 μm in diameter were considered coarse particles, and particles smaller than 2.1 μm in diameter were considered fine particles. Total suspended particulate (TSP) samples were collected on Whatman cellulose membranes (Whateman, Britain) using a KC-1000 high-volume aerosol sampler (Qingdao Laoshan Electronics Co., Ltd., China) during this cruise (Fig.1). These TSP samples were continuously collected for 12 h at a flow rate of 1.05 m3 min−1.
|
Fig. 1 Sampling transects of bioaerosols over the northern Chinese marginal seas and the northwestern Pacific Ocean in autumn 2019. |
The sampler was fixed in front of the uppermost deck (15 m above sea level), and samples were collected only when the ship was in transit to avoid contaminants from pollutants discharged by the ship. After sampling, the filters were stored at −80℃ for future analysis. The meteorological parameters (temperature, relative humidity, wind speed and atmospheric pressure) (Table 1) were recorded through the meteorological observatory onboard during sampling.
|
|
Table 1 Meteorological conditions during the sampling of bioaerosols over the northern Chinese marginal seas and the northwestern Pacific Ocean in autumn 2019 |
After sampling, the loaded membranes were stored at −20℃ for future analysis. After ultrasonic extraction with ultrapure water, the concentrations of water-soluble ions (F−, Cl−, Br−, NO3−, SO42−, PO43−, Na+, NH4+, K+, Mg2+ and Ca2+) were determined using an ICS-1100 ion chromatograph (Thermo Fisher Scientific, USA). A field blank membrane was also analyzed for correction (Qi et al., 2011).
2.3 DNA Extraction and Illumina High-Throughput SequencingFor aerosol samples of each particle size, genomic DNA was extracted using the DNeasy Power Water Kit (Qiagen, Germany) according to the manufacturer's instructions. The extracted DNA was stored at −80℃ until further analysis.
The genomic DNA concentration and purity were measured using a Nanodrop NC-2000 spectrophotometer (Thermo Scientific, USA). The extracted DNA was then used as the template for PCR amplification. The primer pairs 341F (5'-CCTACGGGRSGCAGCAG) and 806R (5'-GGACTACCAGGGTATCTAAT) (Roggenbuck et al., 2014) were used to amplify the V3-V4 regions of the bacterial 16S rRNA gene. The PCR cycles started with a 2-min initial denaturation at 98℃, followed by 30 cycles of denaturation at 98℃ for 15 s, annealing at 55℃ for 30 s, and extension at 72℃ for 30 s; a final extension step at 72℃ for 5 min was included before holding at 4℃. Then, the PCR products were analyzed by electrophoresis on 2% agarose gels and purified using a PCR Purification Kit (Axygen Bio, USA). Finally, paired-end sequencing of bacterial amplicons was performed using the Illumina NovaSeq PE250 platform at Personal Biotechnology Co., Ltd. (Shanghai, China). Raw sequences were submitted to the Sequence Read Archive (SRA) of the National Center for Biotechnology Information (NCBI) database under accession number PRJNA675968.
2.4 Analysis of Sequencing DataThe original sequencing data were stored in paired-end FASTQ format and analyzed using QIIME2 software (Version 2019.4) and the DADA2 (Divisive Amplicon Denoising Algorithm 2) method (Callahan et al., 2016). First, the primer fragments of sequences were removed, and sequences without matching primers were discarded. Then, quality control, denoising, splicing and the removal of all potential chimeric sequences were performed. Each deduplication sequence generated was called an amplicon sequence variant (ASV) and classified using the Silva Database (Release132, http://www.arb-silva.de) (Quast et al., 2013) and the classify-sklearn algorithm of QIIME2 software (Bokulich et al., 2018). The ASVs were used as a basis for calculating metrics associated with alpha diversity and beta diversity. We used QIIME2 (Version 2019.4) to analyze alpha diversities (including Chao 1, Shannon, Simpson and Good's coverage indices) (Bolyen et al., 2019), and a clustering analysis was performed based on the unweighted pair-group method with arithmetic means (UPGMA). R software (Version 3.5.1) was used to analyze biological information, and the relationship between environmental factors and bacterial community structure was determined using a canonical correspondence analysis (CCA).
2.5 Quantification of Bacterial 16S rRNAThe extracted DNA was used as the template for qPCR with the primers 341F and 806R to obtain the bacterial abundance. The qPCR assays were performed in triplicate with an Applied Biosystems 7500 Real Time PCR System (Life Technologies, USA). The amplification followed a two-step PCR: 50℃ for 2 min and 95℃ for 10 min, followed by 40 cycles of 15 s at 95℃ and 2 min at 58℃. A melting stage was added after amplification to obtain a melting curve. A standard curve was created using serial ten-fold dilutions of plasmids containing the V3-V4 region of the bacterial 16S rRNA gene. An average of 3.98 copies of 16S rRNA genes in the bacterial genome was obtained (van Doorn et al., 2007), and the bacterial abundance was calculated.
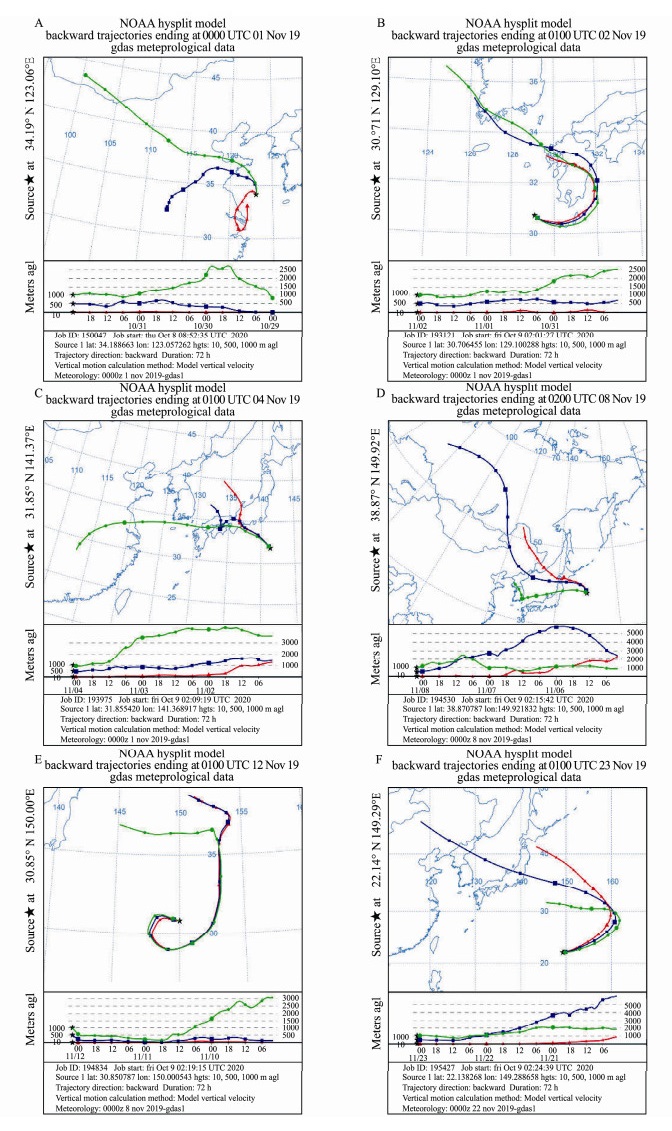
2.6 Backward Trajectory AnalysisBackward trajectories were created using the Hybrid Single-Particle Lagrangian Integrated Trajectory model (HYSPLIT, http://ready.arl.noaa.gov/HYSPLIT.php) (Stein et al., 2015) to trace the source of the air mass. Seventytwo-hour backward trajectories were calculated for air parcels from the 10-m, 500-m and 1000-m layers based on the GDAS1 meteorological dataset and the model vertical velocity motion method (Singh et al., 2002; Seifried et al., 2015).
3 Results 3.1 Backward Trajectory AnalysisFrom 1 to 23 November 2019, the backward trajectory analysis of air masses showed that samples from the NWP5 site were substantially affected by the transmission of oceanic air masses (Fig.2E), and vertical transmission was observed at an altitude of 1000 m. Other samples were affected by the transmission of mixed continental and oceanic air masses from northwestern regions. Among them, the NWP2 and NWP9 samples exhibited obvious vertical transmission at an altitude of 500 m, respectively, and other samples showed vertical transmission at an altitude of 1000 m.
|
Fig. 2 Air mass backward trajectory during sampling of bioaerosols at the (A) SYS_ECS, (B) CS_NWP, (C) NWP1, (D) NWP2, (E) NWP5 and (F) NWP9 sites. |
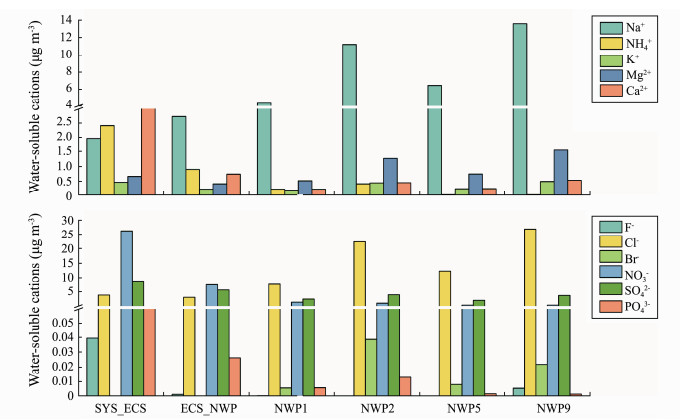
The concentrations of NO3−, SO42− and NH4+ in bioaerosol samples over northern Chinese marginal seas (SYS_ECS and ECS_NWP) were higher than those from the northwestern Pacific Ocean, and the sum of the NO3−, SO42− and NH4+ concentrations exceeded 65% of the total concentrations of water-soluble ions in samples collected over northern Chinese marginal seas. The concentration of Br− in samples from the northwestern Pacific Ocean was higher than that in the other samples, which might be due to the greater effect of oceanic air masses from the distant ocean (northwestern Pacific Ocean) than that of oceanic air masses from the offshore ocean (northern Chinese marginal seas) (Fig.3). As shown in Table 2, a significant correlation was observed between the concentrations of water-soluble ions. For example, the concentrations of Cl− and Br− were significantly positively correlated with the concentrations of Na+ and Mg2+, respectively (P < 0.05), and the concentration of NO3− was significantly positively correlated with the concentration of NH4+ (P < 0.05). These results indicated that these water-soluble ions, such as Cl−, Br− and Na+, Mg2+, might be derived from the same or similar sources.
|
Fig. 3 Concentrations of water-soluble ions in bioaerosols collected over northern Chinese marginal seas and the northwestern Pacific Ocean in autumn 2019. |
|
|
Table 2 Spearman's correlation coefficients among water-soluble ions in bioaerosols collected over northern Chinese marginal seas and the northwestern Pacific Ocean in autumn 2019 |
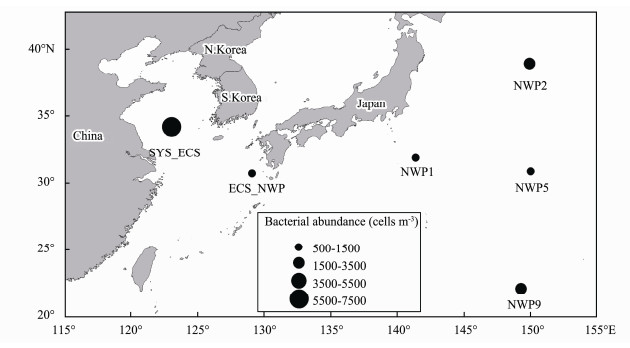
The average bacterial abundance was 2.54×10³ cells m−3 (ranging from 8.23×10² to 7.44×10³ cells m−3) at the six sites. The bacterial abundance at the SYS_ECS site was significantly higher than that at the other sea areas (P < 0.05), and the lowest bacterial abundance was observed at the ECS_NWP site (Fig.4). However, significant correlations between environmental factors (meteorological factors and water-soluble ions) and bacterial abundance were not observed (P > 0.05).
|
Fig. 4 Distribution of bacterial abundance in aerosols collected over northern Chinese marginal seas and the northwestern Pacific Ocean in autumn 2019. |
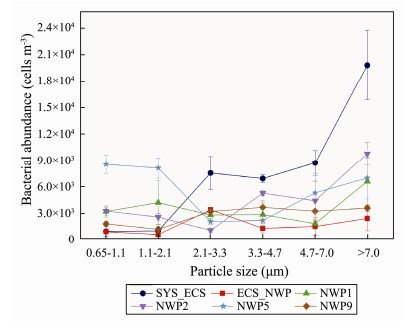
The variations in the different particle size distributions of the six sites are shown in Fig.5. Except for the NWP5 site, the peaks in bacterial abundance at other sites were all in the range of coarse particle sizes (> 2.1 μm). For example, the highest bacterial abundance was mainly distributed in aerosols with particle sizes larger than 7.0 μm in the SYS_ECS, NWP1 and NWP2 samples, presenting a unimodal distribution. The highest bacterial abundance was mainly distributed in aerosols with a size range of 2.1 to 3.3 μm at the ECS_NWP site, showing an approximately normal distribution. The highest bacterial abundance was mainly distributed in aerosols with a size range of 3.3 to 4.7 μm at the NWP9 site and presented an approximately normal distribution. However, the bacterial abundance in aerosols with different particle size distributions presented a unimodal distribution at the NWP5 site; specifically, the highest bacterial abundance was observed in aerosols with a size range of 0.65 to 1.1 μm, and the lowest abundance was observed in the size range of 2.1 to 4.7 μm (Fig.5).
|
Fig. 5 Bacterial abundance in aerosols of different particle sizes collected over northern Chinese marginal seas and the northwestern Pacific Ocean in autumn 2019. |
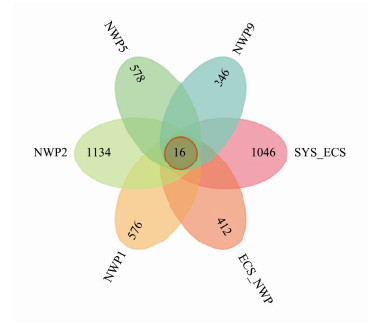
In the present study, 3905719 high-quality sequences were obtained from 36 aerosol samples, and the number of high-quality sequences in each sample ranged from 74998 to 125880. Using the cutoff, these sequences were divided into 4593 ASVs. Sixteen shared ASVs were identified among the samples from the six sites, accounting for 0.35% of the total ASVs and 1.28%–3.15% of each sample (Fig.6). The highest proportion of shared ASVs was detected in the SYS_ECS sample, but the lowest proportion was observed in the NWP9 sample. Based on this result, the number of shared species in each sample was low.
|
Fig. 6 Venn diagram of bacterial ASVs in aerosols collected over the northern Chinese marginal seas and the northwestern Pacific Ocean in autumn 2019. |
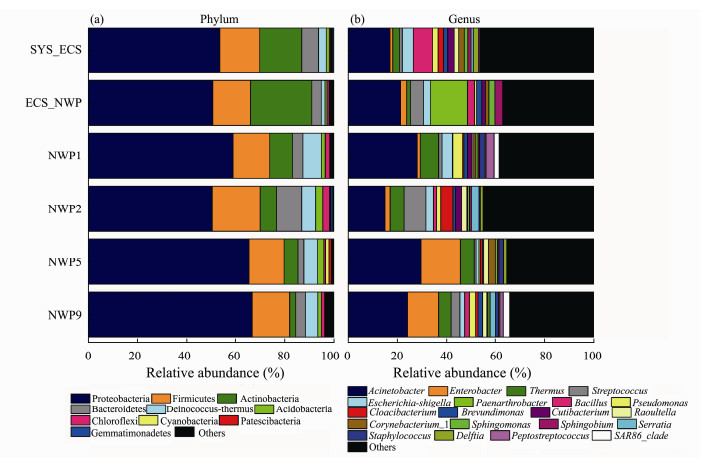
Proteobacteria (57.58%), Firmicutes (15.93%), Actinobacteria (10.99%), Bacteroides (5.26%) and Deinococcus-Thermus (4.73%) were the dominant phyla present in aerosols (Fig.7a), and the total relative abundances of these five phyla were greater than 90% in all samples. Significant differences in the relative abundances of Proteobacteria and Firmicutes were not observed (P > 0.05). The relative abundances of Actinobacteria in the ECS_ NWP sample, Bacteroidetes in the NWP2 sample, and Deinococcus-Thermus in the NWP2 sample were significantly higher than those in the other samples (P < 0.05). At the genus level of taxonomic criteria (Fig.7b), Acinetobacter was the common dominant bacterial genus detected in all samples, with a relative abundance greater than 14%. In addition, Bacillus (7.77%) and Escherichia-Shigella (4.78%) were dominant at the SYS_ECS site; Paenarthrobacter (15.06%) was dominant at the ECS_ NWP site; Thermus (7.50%) was dominant at the NWP1 site; Streptococcus (8.90%), Thermus (5.68%) and Cloacibacterium (4.98%) were dominant at the NWP2 site; and Enterobacter was dominant at the NWP5 (16.03%) and NWP9 (12.68%) sites.
|
Fig. 7 Relative abundance of bacterial groups at the (a) phylum and (b) genus levels in aerosols collected over northern Chinese marginal seas and the northwestern Pacific Ocean in autumn 2019. |
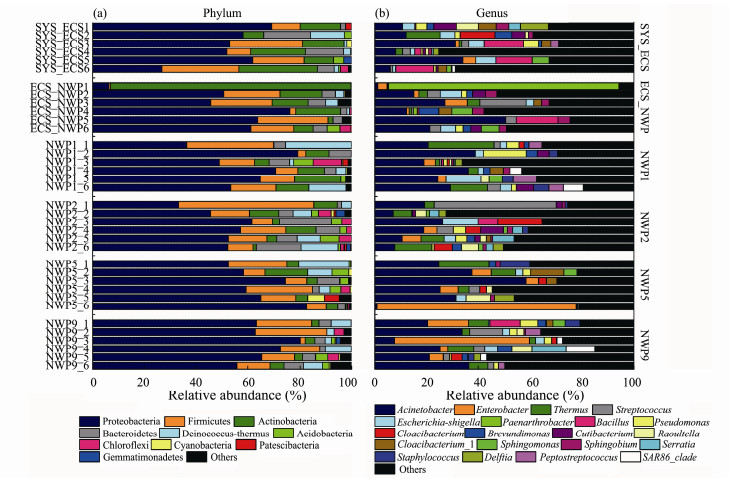
The dominant phyla in aerosols of different particle sizes collected at the six sites were Proteobacteria, Firmicutes, Actinobacteria and Bacteroides (Fig.8a), and the total relative abundances of these four phyla were greater than 70% for different particle sizes. However, the relative abundance of each dominant bacterial phylum was different for all particle sizes. At the genus level, Acinetobacter was the common genus identified (Fig.8b). In addition, different dominant genera were detected in all sea areas. For example, Paenarthrobacter (88.89%) in aerosols with a particle size of 0.65 to 1.1 μm and Acinetobacter (50.52%) in aerosols with a particle size of 4.7 to 7.0 μm were the clearly dominant genera identified at the ECS_NWP site. Streptococcus (47.08%) in aerosols with particle sizes of 0.65 to 1.1 μm at the NWP2 site and Enterobacter in aerosols with particle sizes of > 7.0 μm at the NWP5 site and aerosols with sizes of 2.1 to 3.3 μm at the NWP9 site were also clearly dominant.
|
Fig. 8 Relative abundance of bacterial groups at the phylum (a) and genus (b) levels in aerosols of different particle sizes collected over northern Chinese marginal seas and the northwestern Pacific Ocean in autumn 2019. |
The sequencing capacity was sufficiently large to cover most of the species in these samples, which was confirmed by Good's coverage, with a value greater than 99.9% (Table 3). The Chao1 index indicated the richness of bacterial communities, and the Shannon and Simpson indices indicated the diversity of bacterial communities. Significant differences in the richness and diversity were observed between the six sites (P < 0.05). The numbers of ASVs and the richness and diversity of the bacterial communities in the SYS_ECS and NWP2 samples were higher than those in the other samples. However, the richness of the bacterial communities at the NWP9 site was lower than that at the other sites (Table 3). A significant negative correlation was observed between bacterial community richness and temperature (P < 0.05), and a significant positive correlation was observed between the bacterial community diversity and the concentration of K+ (P < 0.05).
|
|
Table 3 Diversity of bacterial communities in aerosol samples collected over northern Chinese marginal seas and the northwestern Pacific Ocean in autumn 2019 |
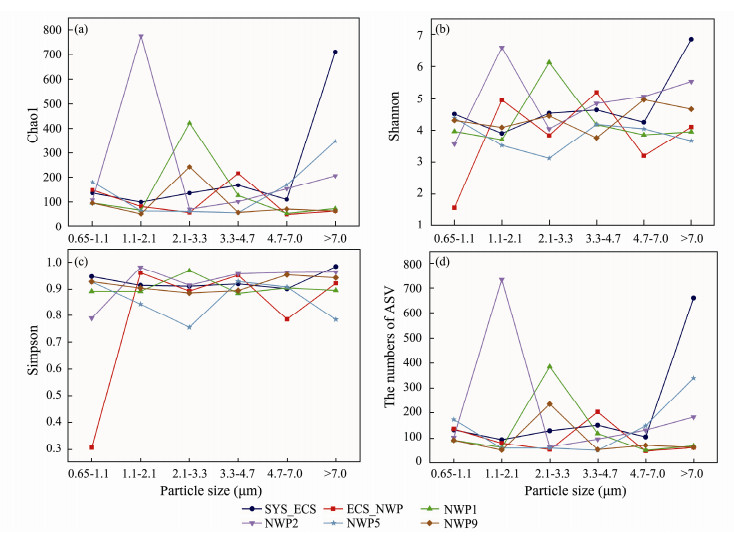
The community characteristics of aerosol samples with different particle sizes at different sites are shown in Fig. 7. The Chao1 index ranged from 49.5 to 775.9, the Shannon index ranged from 1.563 to 6.855, the Simpson index ranged from 0.3056 to 0.9849, and the numbers of ASVs ranged from 48 to 600 (Fig.9). Significant differences in the richness and diversity of bacterial communities were observed between aerosols with different particle sizes (P < 0.01). The highest richness of bacterial communities was observed in aerosols with sizes ranging from 1.1 to 2.1 μm at the NWP2 site, but the lowest richness of bacterial communities was observed for aerosols with sizes ranging from 4.7 to 7.0 μm at the ECS_NWP site (Fig.9a). The highest diversity of bacterial communities was detected in the SYS_ECS sample with particle sizes larger than 7.0 μm, and the lowest diversity was detected in the ECS_NWP sample with particle sizes ranging from 0.65 to 1.1 μm (Figs.9b and 9c).
|
Fig. 9 The numbers of ASVs and diversity of bacterial communities in aerosols of different particle sizes collected over northern Chinese marginal seas and the northwestern Pacific Ocean in autumn 2019. (a), Chao1 index; (b), Shannon index; (c), Simpson index; (d), ASV numbers. |
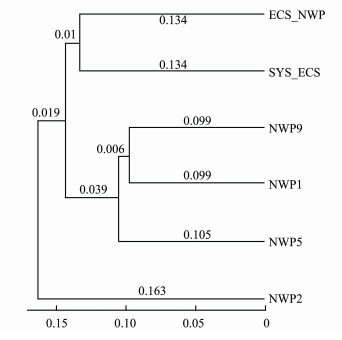
A UPGMA clustering analysis based on weighted UniFrac distance was performed to further analyze the bacterial community structure in aerosols collected at different sites (Fig.10). All the samples were divided into three branches. The bacterial community structures in the aerosols of the northern Chinese marginal seas (SYS_ ECS and ECS_NWP) were similar. Among samples from the northwestern Pacific Ocean, the sample at the NWP2 site was clustered into one group, which had a quite different bacterial community structure from the other samples.
|
Fig. 10 Clustering analysis of bacterial community structures in aerosols collected over northern Chinese marginal seas and the northwestern Pacific Ocean in autumn 2019. |
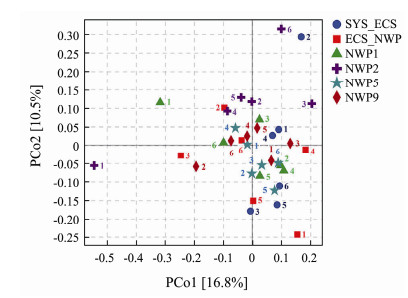
Principal coordinate analysis (PCoA) was conducted to reflect the similarity or difference in microbial community structure among samples (Fig.11). Samples with different particle sizes collected from other sea areas were clustered together, indicating that the bacterial community structure of aerosols was affected by both the marine region and particle size. For example, the bacterial community structure in the SYS_ECS sample with particle sizes ranging from 1.1 to 2.1 μm was significantly different from that in the other samples. However, the analysis of ANOSIM similarities showed that the effects of different sea areas on the bacterial community structure were greater than those of different particle sizes (r = 0.0568, P > 0.05).
|
Fig. 11 PCoA of bacterial community structures in aerosols of different particle size samples collected over northern Chinese marginal seas and the northwestern Pacific Ocean in autumn 2019. |
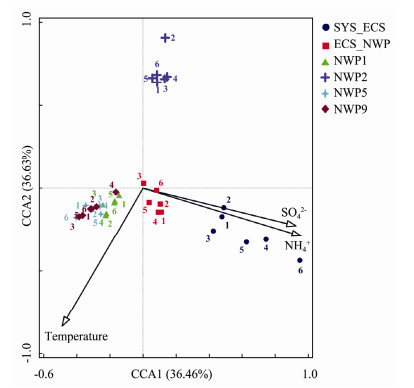
Detrended correspondence analysis (DCA) showed that CCA was more suitable for analyzing the relationship between the bacterial community structure of aerosols and environmental factors (meteorological factors and water-soluble ions) (Fig.12). Using the vegan package BIOENV for analysis in R, temperature, the NH4+ concentration and SO42− concentration were the main factors influencing the bacterial community structure in aerosols. Among these three environmental factors, the NH4+ concentration exerted the greatest effect on the bacterial community structure, and the temperature, NH4+ concentration and SO42− concentration exerted significant effects on the bacterial community structure (P < 0.01). Among them, NH4+ and SO42− concentrations exerted greater effects on the bacterial community structure in samples from northern Chinese marginal seas than in samples from the northwestern Pacific Ocean. The bacterial community structures in the northwestern Pacific Ocean were substantially affected by temperature.
|
Fig. 12 Correlation between environmental factors and the bacterial community structure in aerosols of different particle sizes collected over northern Chinese marginal seas and the northwestern Pacific Ocean in autumn 2019. |
In general, the concentrations of bacterial communities in aerosols over northern Chinese marginal seas and the northwestern Pacific Ocean were 102 to 103 times lower than those in terrestrial aerosols (Bowers et al., 2011). In the present study, the bacterial abundance in marine aerosols determined using qPCR ranged from 8.23×10² to 7.44×10³ cells m−3 and averaged 2.54×10³ cells m−3. The results from this study were lower than the values reported in other studies. For example, the bacterial abundance in aerosols over the Sea of Japan was distributed in the range of 6.0×10³ to 2.1×10⁴ cells m−3 (Cho and Hwang, 2011). Using epifluorescence enumeration, the concentrations of total bacteria ranged from 1.0×10⁴ to 2.5×10⁵ cells m−3 in another study (Hu et al., 2017). Based on these results, the bacterial concentrations in the aerosols over the northern Chinese marginal seas and the northwestern Pacific Ocean indicated that the aerosols were relatively few in this survey. According to the backward trajectory analysis, samples from the SYS_ECS site collected at the junction of the South Yellow Sea and the East China Sea were mainly affected by continental air masses and had the highest bacterial abundance (P < 0.05); additionally, the bacterial abundance in coarse particles (> 2.1 μm) was significantly higher than that in fine particles (< 2.1 μm) (P < 0.05). However, aerosols collected from oceanic air masses at the NWP5 site were almost unaffected by continental air masses, and the bacterial abundance in coarse particles was significantly lower than that in fine particles (P < 0.01). Previous studies also showed that aerosols were more affected by continental air masses, and a higher bacterial abundance was observed in coarse particle samples than in fine particle samples (Li et al., 2011; Dong et al., 2016).
4.2 Bacterial Community Diversity and Composition in AerosolsIn the present study, the richness and diversity of bacterial communities in samples from marine environments were lower than those in samples collected from land (Serrano-Silva et al., 2018; Ma et al., 2020), the Bohai Sea, the Yellow Sea and the northwestern Pacific Ocean (Ma et al., 2019) (Table 4). With the development of sequencing methods, the richness and diversity of bacterial communities were higher than those reported in previous studies of aerosols collected over the western Pacific Ocean, the northern Pacific Ocean and the Norwegian Sea (Xia et al., 2015) (Table 4). The richness and diversity of bacterial communities at the SYS_ECS and NWP2 sites were higher than those at the other sites, and the richness of bacterial communities at the NWP9 site and the diversity of bacterial communities at the NWP5 site were the lowest. The richness of bacterial communities showed a significant negative correlation with temperature (P < 0.05). Bacterial communities in both terrestrial and marine aerosols may be substantially affected by temperature (Seifried et al., 2015; Zhen et al., 2017). When the temperature was lower than 7.5℃, the bacterial concentration in aerosols was positively correlated with the temperature, while when the temperature was higher than 7.5℃, the temperature did not lead to higher microbial aerosol concentrations (Kowalski and Pastuszka, 2018). In our study, the temperature of all sea areas ranged from 12.3 to 26.8℃. The richness and diversity of bacterial communities in coarse particles were higher than those in fine particles in the present study, consistent with the results of a study on marine aerosols from the Bohai Sea, the Yellow Sea and the Pacific Ocean (Ma et al., 2019). Most microorganisms are attached to coarse particles, allowing bacteria to be protected from environmental damage. In contrast, fine particles have a smaller surface area than coarse particles, and microorganisms do not easily adhere to them (Lu et al., 2018). Therefore, the bacterial communities in coarse particle aerosols are more adaptable to environmental changes than those in fine particle aerosols. However, the bacterial community richness in the coarse particles of the NWP2 sample was lower than that in the fine particles, indicating that the bacterial community structure of fine particles in aerosols of the NWP2 sample was more complex and diverse. The average temperature of the NWP2 sample was lower than that of the other samples. According to the backward trajectory analysis, the transmissions of air masses were mainly derived from Russia and northeastern China during the sampling period and air masses were transported a long distance. The long-distance transmission of air masses might promote the spread of microorganisms in fine particles (Dueker et al., 2011; Kowalski and Pastuszka, 2018) due to the longer residence time in fine particles than in coarse particles. Meanwhile, the K+ concentration displayed a significant positive correlation with the diversity of the bacterial community (P < 0.05). K+ is usually derived from human activities (including industrial sources, transportation sources, biomass combustion, etc.) (Horvath et al., 1996). In the present study, the concentrations of K+ in the SYS_ECS and NWP2 samples affected by transmissions of continental air masses were higher than those in other samples. Therefore, anthropogenic sources, especially biomass combustion, might increase the richness of the bacterial communities in the SYS_ ECS and the NWP2 samples compared to the other samples.
|
|
Table 4 Comparison of bacterial community diversity in aerosols collected over northern Chinese marginal seas and the northwestern Pacific Ocean in autumn 2019 |
The aerosol samples from the six sites had 16 shared ASVs, accounting for 1.28% – 3.15% of each sample. Based on these results, more unique species than shared species were present in aerosols over the northern Chinese marginal seas and the northwestern Pacific Ocean. Proteobacteria, Firmicutes, Actinobacteria, Bacteroides and Deinococcus-Thermus were the dominant phyla identified in the samples at six sites, consistent with the results of previous studies (Seifried et al., 2015; Ma et al., 2019), and they were also the common dominant bacterial phyla in the atmosphere. Acinetobacter, Enterobacter, Thermus, Streptococcus, Escherichia-Shigella, Bacillus, Pseudomonas, and Sphingomonas were the dominant genera detected in the present study. These bacteria, such as Acinetobacter, Pseudomonas and Escherichia-Shigella, were also the dominant genera reported in other aerosol studies of marine or coastal ecosystems (Xia et al., 2015; Ma et al., 2019; Archer et al., 2020). Studies have shown that several dominant bacterial genera might be present in the atmosphere (Gandolfi et al., 2013), and these bacteria might be derived from areas such as tropical rainforests, large grasslands or soil. Meanwhile, these bacteria are potentially continuously distributed and mixed during long-distance transmission (Seifried et al., 2015).
Due to the continuous mixing of bacteria during transportation and the effects of changes in atmospheric conditions, the relative abundance of the dominant bacterial genera in aerosols with different particle sizes was constantly changing. Acinetobacter was the common dominant genus detected in the bacterial communities of aerosols from different sites. In addition, different dominant genera were observed in different sea areas. For example, at the SYS_ECS site, Bacillus and Escherichia-Shigella were the dominant genera, and the relative abundance of Bacillus in aerosols from the northwestern Pacific Ocean was extremely low. According to a previous study, Bacillus is the dominant bacterial genus identified under dusty weather conditions in Seoul (Jeon et al., 2011). Bacillus was also the dominant genus detected in aerosol samples of outdoor air and indoor dust (Hanson et al., 2016). Bacillus was the main bacteria identified in Asian marine aerosols, and it was easily transferred to South Korea, Japan, and even farther from North America (Hua et al., 2007; Smith et al., 2013; An et al., 2015). According to the results of the backward trajectory analysis, the effect of air mass transmission might contribute to the changes in the relative abundance of dominant bacteria in different sea areas. Furthermore, differences in the composition of bacterial communities in aerosols of different particle sizes were observed at the same sampling site. For example, Bacillus, a member of the phylum Firmicutes, showed an obvious increase in abundance in coarse particles (> 2.1 μm) at the SYS_ECS site, but the abundance of Paenarthrobacter, a member of the phylum Actinobacteria, increased in fine particles (< 2.1 μm), especially in particle sizes ranging 0.65 to 1.1 μm at the ECS_NWP site. Firmicutes dominated large particle sizes, whereas Actinobacteria gradually increased in abundance in aerosols of fine particle sizes (Polymenakou et al., 2008). Streptococcus exhibited the highest relative abundance in aerosols with a size range from 0.65 to 1.1 μm at the NWP2 site, and the relative abundance of Enterobacter in coarse particles was higher than that in fine particles at the NWP5 and NWP9 sites. Xia et al. (2015) found that Streptococcus and Enterobacter were also detected in aerosols from the Norwegian Sea and the Western Pacific, respectively, and they were potential human pathogens present in marine aerosol samples. The backward trajectory analysis showed that transmissions of continental and oceanic air masses were derived from northwestern regions at the NWP5 and NWP9 sites. Researchers also detected potential pathogens in the marine atmosphere far from land, indicating that the long-distance transmission of aerosols might be one of the mechanisms of human disease transmission (Polymenakou et al., 2008). Ku et al. (2000) found that Acinetobacter lwoffii was only present on 0.55–1.00 μm particles and was linked to bacteremia and meningitis, whereas Sphingomonas was widely distributed in the natural environment, induced several nosocomial infections and was most abundant in > 7.9 μm particles (Ammendolia et al. 2004). Therefore, aerosols with different particle sizes have different potentials for long-distance transmission, suggesting their effects on human health and ecosystems.
4.3 Bacterial Community Structure in AerosolsThe analysis of ANOSIM similarities showed that the effects of different sea areas on bacterial community structure were greater than those of different particle sizes (r = 0.0568, P > 0.05). In the present study, each sea area was affected by long-distance transmissions of air masses, which contributed to differences in the structure and composition of the bacterial community in aerosols. Clustering analysis showed that the bacterial community structures of the samples (SYS_ECS and ECS_NWP) were similar over the northern Chinese marginal seas. According to the backward trajectory analysis, these two sampling sites were close to land, and the samples were mainly affected by continental air masses. However, among aerosol samples collected over the northwestern Pacific Ocean, the bacterial community structure of the NWP2 sample was quite different from that of other samples. The average temperature during sampling at the NWP2 site was lower than that at the other sites. The backward trajectory analysis showed that air masses were mainly derived from Russia and northeastern China, and the continental air masses underwent long distance transmission. Therefore, these processes might lead to the difference in the bacterial community structure of the NWP2 sample from that of the other samples. Overall, the bacterial community structure in the atmosphere over the ocean is affected by the sampling region, the source of air mass and the weather conditions (Seifried et al., 2015).
4.4 Effects of Environmental Factors on Bacterial CommunitiesCCA indicated that temperature, the NH4+ concentration and SO42− concentration exerted significant effects on the bacterial community structures in aerosols of different particle sizes (P < 0.01). NH4+ and SO42− are mainly derived from automobile exhaust emissions and biomass and coal combustion (Lu et al., 2018). Within the tolerance range of microorganisms, water-soluble ions in the atmosphere may provide the necessary environment for the growth and reproduction of microorganisms. However, if the concentrations of water-soluble ions are too low, the growth of microorganisms may be inhibited (Xie et al., 2018; Zhang et al., 2019), causing decreases in the richness and diversity of the microbial community structure and changes in the community structure (Kõljalg et al., 2013; Zhang et al., 2019). Previous studies have also shown that NH4+ and SO42− concentrations are the main factors influencing the bacterial community in aerosols (Wei et al., 2019; Ma et al., 2020). Therefore, NH4+ and SO42− concentrations exert a substantial effect on samples from northern Chinese marginal seas, which are mainly affected by continental air masses. The main effects of temperature on bacterial community structure were as follows: an increase in temperature might accelerate air flow, thus promoting the diffusion and spread of bacteria in the air (Zhen et al., 2017). However, an excessively high temperature will cause cell dehydration and protein denaturation in microorganisms, and then microorganisms lose biological activity in the atmosphere (Lighthart and Shaffer, 1995). In the current study, the temperature of the NWP2 sample ranged from 9.7 to 14.9℃, and this suitable temperature was beneficial to promote the spread of bacteria in the NWP2 sample. This condition might be responsible for the lower bacterial community richness in the coarse particles of the NWP2 sample than that in the fine particles. Due to the multiple mechanisms of individual environmental factors and the diversity of microbial species in the environment, the effects of environmental factors on the microbial community structure in the atmosphere are different in different regions (Yu et al., 2013; Lu et al., 2018). Therefore, synergistic effects were observed between environmental factors and the microbial community structure.
Among the environmental factors, secondary pollutants such as NH4+ and SO42− in the marine atmosphere are mainly derived from the input of terrestrial air masses. The samples from the northern Chinese marginal seas were substantially affected by the terrestrial air masses, which might have resulted in greater effects of water-soluble ions on the bacterial community structure in the samples from the northern Chinese marginal seas than on those in samples from the northwestern Pacific Ocean. The bacterial community structures in the northwestern Pacific Ocean were mainly affected by natural conditions, such as temperature.
5 ConclusionsAs shown in the present study, the transmission of air mass affected the bacterial abundance and community structure in aerosols. The bacterial abundance in aerosols collected at the junction of the South Yellow Sea and the East China Sea that were most affected by transmissions of continental air masses was higher than that in other samples, and the bacterial abundance in coarse particle (> 2.1 μm) samples was significantly higher than that in fine particle (< 2.1 μm) samples. The bacterial community structure in the atmosphere over the ocean was affected by the sampling region, the source of the air mass and the weather conditions, and the bacterial community structure in the NWP2 sample was different from that in the other samples. Meanwhile, differences in the species of dominant bacteria present in different sea areas and aerosols with different particle sizes of the same sample were observed. For example, Bacillus was the dominant bacterial genus detected in the samples from northern Chinese marginal seas, and its relative abundance in coarse particles was higher than that in fine particles, but its relative abundance in the northwestern Pacific Ocean was extremely low. Enterobacter was the dominant bacterial genus in the samples from the northwestern Pacific Ocean, and its relative abundance in coarse particles was lower than that in fine particles. Finally, by analyzing the effects of environmental factors on bacterial community structure, water-soluble ions exerted greater effects on the bacterial community structure in samples from the northern Chinese marginal seas. The bacterial community structures in the northwestern Pacific Ocean were mainly affected by temperature.
AcknowledgementsThis work was supported by grants from the National Natural Science Foundation of China (No. 41775148), the Fundamental Research Funds for the Central Universities (No. 201762006), and the Shandong Provincial Natural Science Foundation, China (No. ZR2016CB47). Data acquisition and sample collections were obtained from the shared cruise organized by the Global Ocean Fleet of Pilot National Laboratory for Marine Science and Technology (Qingdao) and conducted onboard R/V 3 Dongfanghong by the Ocean University of China. We express our appreciation to Dr. Yidan Yin for assisting with sampling.
Aller, J. Y., Kuznetsova, M. R., Jahns, C. J., and Kemp, P. F., 2005. The sea surface microlayer as a source of viral and bacterial enrichment in marine aerosols. Journal of Aerosol Science, 36(5-6): 801-812. DOI:10.1016/j.jaerosci.2004.10.012 (  0) 0) |
Ammendolia, M. G., Bertuccini, L., Minelli, F., Meschini, S., and Baldassarri, L., 2004. A Sphingomonas bacterium interacting with epithelial cells. Research in Microbiology, 155(8): 636-646. DOI:10.1016/j.resmic.2004.05.009 (  0) 0) |
An, S., Sin, H. H., and DuBow, M. S., 2015. Modification of atmospheric sand-associated bacterial communities during Asian sandstorms in China and South Korea. Heredity, 114(5SI): 460-467. (  0) 0) |
Archer, S. D. J., Lee, K. C., Caruso, T., King-Miaow, K., Harvey, M., and Huang, D., 2020. Air mass source determines airborne microbial diversity at the ocean-atmosphere interface of the Great Barrier Reef marine ecosystem. ISME Journal, 14(3): 871-876. DOI:10.1038/s41396-019-0555-0 (  0) 0) |
Ariya, P. A., and Amyot, M., 2004. New directions: The role of bioaerosols in atmospheric chemistry and physics. Atmospheric Environment, 38(8): 1231-1232. DOI:10.1016/j.atmosenv.2003.12.006 (  0) 0) |
Bokulich, N. A., Kaehler, B. D., Rideout, J. R., Dillon, M., Bolyen, E., Knight, R., et al., 2018. Optimizing taxonomic classification of marker-gene amplicon sequences with QIIME 2's q2-feature-classifier plugin. Microbiome, 6(90): 1-17. (  0) 0) |
Bolyen, E., Rideout, J. R., Dillon, M. R., Bokulich, N. A, Abnet, C. C., Al-Ghalith, G. A., et al., 2019. Reproducible, interactive, scalable and extensible microbiome data science using QIIME 2. Nature Biotechnology, 37(8): 852-857. DOI:10.1038/s41587-019-0209-9 (  0) 0) |
Bowers, R. M., McLetchie, S., Knight, R., and Fierer, N., 2011. Spatial variability in airborne bacterial communities across land-use types and their relationship to the bacterial communities of potential source environments. ISME Journal, 5(4): 601-612. DOI:10.1038/ismej.2010.167 (  0) 0) |
Callahan, B. J., McMurdie, P. J., Rosen, M. J., Han, A. W., Johnson, A. J. A., and Holmes, S. P., 2016. DADA2: Highresolution sample inference from Illumina amplicon data. Nature Methods, 13(7): 581-583. DOI:10.1038/nmeth.3869 (  0) 0) |
Cho, B. C., and Hwang, C. Y., 2011. Prokaryotic abundance and 16S rRNA gene sequences detected in marine aerosols on the East Sea (Korea). FEMS Microbiology Ecology, 76(2): 327-341. DOI:10.1111/j.1574-6941.2011.01053.x (  0) 0) |
Clarke, A. D., Owens, S. R., and Zhou, J. C., 2006. An ultrafine sea-salt flux from breaking waves: Implications for cloud condensation nuclei in the remote marine atmosphere. Journal of Geophysical Research-Atmospheres, 111(D6): 1-14. (  0) 0) |
Dong, L., Qi, J., Shao, C., Zhong, X., Gao, D., Cao, W., et al., 2016. Concentration and size distribution of total airborne microbes in hazy and foggy weather. Science of the Total Environment, 541: 1011-1018. DOI:10.1016/j.scitotenv.2015.10.001 (  0) 0) |
Dueker, M. E., Weathers, K. C., Mullan, G. D., Juhl, A. R., and Uriarte, M., 2011. Environmental controls on coastal coarse aerosols: Implications for microbial content and deposition in the near-shore environment. Environmental Science & Technology, 45(8): 3386-3392. (  0) 0) |
Gandolfi, I., Bertolini, V., Ambrosini, R., Bestetti, G., and Franzetti, A., 2013. Unravelling the bacterial diversity in the atmosphere. Applied Microbiology and Biotechnology, 97(11): 4727-4736. DOI:10.1007/s00253-013-4901-2 (  0) 0) |
Gong, J., Qi, J., Yin, Y., and Gao, D., 2020. Concentration, viability and size distribution of bacteria in atmospheric bioaerosols under different types of pollution. Environmental Pollution, 257: 1-11. (  0) 0) |
Harrison, R. M., Jones, A. M., Biggins, P., Pomeroy, N., Cox, C. S., Kidd, S. P., et al., 2005. Climate factors influencing bacterial count in background air samples. International Journal of Biometeorology, 49(3): 167-178. DOI:10.1007/s00484-004-0225-3 (  0) 0) |
Horvath, H., Kasaharat, M., and Pesava, P., 1996. The size distribution and composition of the atmospheric aerosol at a rural and nearby urban location. Journal of Aerosol Science, 27(3): 417-435. DOI:10.1016/0021-8502(95)00546-3 (  0) 0) |
Hu, W., Murata, K., Fukuyama, S., Kawai, Y., Oka, E., Uematsu, M., et al., 2017. Concentration and viability of airborne bacteria over the Kuroshio extension region in the northwestern Pacific Ocean: Data from three cruises. Journal of Geophysical Research-Atmospheres, 122(23): 12892-12905. (  0) 0) |
Hua, N., Kobayashi, F., Iwasaka, Y., Shi, G., and Naganuma, T., 2007. Detailed identification of desert-originated bacteria carried by Asian dust storms to Japan. Aerobiologia, 23(4): 291-298. DOI:10.1007/s10453-007-9076-9 (  0) 0) |
Jeon, E. M., Kim, H. J., Jung, K., Kim, J. H., Kim, M. Y., Kim, Y. P., et al., 2011. Impact of Asian dust events on airborne bacterial community assessed by molecular analyses. Atmospheric Environment, 45(25): 4313-4321. DOI:10.1016/j.atmosenv.2010.11.054 (  0) 0) |
Jones, A. M., and Harrison, R. M., 2004. The effects of meteorological factors on atmospheric bioaerosol concentrations – A review. Science of the Total Environment, 326(1-3): 151-180. DOI:10.1016/j.scitotenv.2003.11.021 (  0) 0) |
Kellogg, C. A., and Griffin, D. W., 2006. Aerobiology and the global transport of desert dust. Trends in Ecology & Evolution, 21(11): 638-644. (  0) 0) |
Kõljalg, U., Nilsson, R. H., Abarenkov, K., Tedersoo, L., Taylor, A. F. S., Bahram, M., et al., 2013. Towards a unified paradigm for sequence-based identification of fungi. Molecular Ecology, 22(21): 5271-5277. DOI:10.1111/mec.12481 (  0) 0) |
Kowalski, M., and Pastuszka, J. S., 2018. Effect of ambient air temperature and solar radiation on changes in bacterial and fungal aerosols concentration in the urban environment. Annals of Agricultural and Environmental Medicine, 25(2): 259-261. DOI:10.26444/aaem/75877 (  0) 0) |
Ku, S. C., Hsueh, P. R., Yang, P. C., and Luh, K. T., 2000. Clinical and microbiological characteristics of bacteremia caused by Acinetobacter lwoffii. European Journal of Clinical Microbiology and Infectious Diseases, 19(7): 501-505. DOI:10.1007/s100960000315 (  0) 0) |
Li, M., Qi, J., Zhang, H., Huang, S., Li, L., and Gao, D., 2011. Concentration and size distribution of bioaerosols in an outdoor environment in the Qingdao coastal region. Science of the Total Environment, 409(19): 3812-3819. DOI:10.1016/j.scitotenv.2011.06.001 (  0) 0) |
Lighthart, B., and Shaffer, B. T., 1995. Viable bacterial aerosol particle size distributions in the midsummer atmosphere at an isolated location in the high desert chaparral. Aerobiologia, 11(1): 19-25. DOI:10.1007/BF02136140 (  0) 0) |
Lu, R., Li, Y., Li, W., Xie, Z., Fan, C., Liu, P., et al., 2018. Bacterial community structure in atmospheric particulate matters of different sizes during the haze days in Xi'an, China. Science of the Total Environment, 637-638: 244-252. DOI:10.1016/j.scitotenv.2018.05.006 (  0) 0) |
Ma, M., Zhang, B., Chen, Y., Feng, W., Mi, T., Qi, J., et al., 2020. Characterization of bacterial communities during persistent fog and haze events in the Qingdao coastal region. Frontiers of Environmental Science & Engineering, 15(3): 1-13. (  0) 0) |
Ma, M., Zhen, Y., and Mi, T., 2019. Characterization of bacterial communities in bioaerosols over northern Chinese marginal seas and the northwestern Pacific Ocean in spring. Journal of Applied Meteorology and Climatology, 58(4): 903-917. DOI:10.1175/JAMC-D-18-0142.1 (  0) 0) |
Mandrioli, P., 1998. Basic aerobiology. Aerobiologia, 14(2-3): 89-94. DOI:10.1007/BF02694191 (  0) 0) |
Polymenakou, P. N., Mandalakis, M., Stephanou, E. G., and Tselepides, A., 2008. Particle size distribution of airborne microorganisms and pathogens during an intense African dust event in the eastern Mediterranean. Environmental Health Perspectives, 116(3): 292-296. DOI:10.1289/ehp.10684 (  0) 0) |
Qi, J. H., Gao, H. W., Yu, L. M., and Qiao, J. J., 2011. Distribution of inorganic nitrogen-containing species in atmospheric particles from an island in the Yellow Sea. Atmospheric Research, 101(4): 938-955. DOI:10.1016/j.atmosres.2011.06.003 (  0) 0) |
Quast, C., Pruesse, E., Yilmaz, P., Gerken, J., Schweer, T., Yarza, P., et al., 2013. The SILVA ribosomal RNA gene database project: Improved data processing and web-based tools. Nucleic Acids Research, 41(D1): D590-D596. (  0) 0) |
Roggenbuck, M., Bærholm, S. I., Blom, N., Bælum, J., Bertelsen, M. F., Sicheritz-Pontén, T., et al., 2014. The microbiome of new world vultures. Nature Communications, 5(1): 1-7. (  0) 0) |
Seifried, J. S., Wichels, A., and Gerdts, G., 2015. Spatial distribution of marine airborne bacterial communities. Microbiology Open, 4(3): 475-490. DOI:10.1002/mbo3.253 (  0) 0) |
Seitzinger, S. P., and Sanders, R. W., 1999. Atmospheric inputs of dissolved organic nitrogen stimulate estuarine bacteria and phytoplankton. Limnology and Oceanography, 44(3): 721-730. DOI:10.4319/lo.1999.44.3.0721 (  0) 0) |
Serrano-Silva, N., and Calderón-Ezquerro, M. C., 2018. Metagenomic survey of bacterial diversity in the atmosphere of Mexico City using different sampling methods. Environmental Pollution, 235: 20-29. DOI:10.1016/j.envpol.2017.12.035 (  0) 0) |
Singh, H. B., Anderson, B. E., Avery, M. A., Viezee, W., Chen, Y., Tabazadeh, A., et al., 2002. Global distribution and sources of volatile and nonvolatile aerosol in the remote troposphere. Journal of Geophysical Research: Atmospheres, 107(D11): ACH 7-1-ACH 7-10. DOI:10.1029/2001JD000486 (  0) 0) |
Smith, D. J., Timonen, H. J., Jaffe, D. A., Griffin, D. W., Birmele, M. N., Perry, K. D., et al., 2013. Intercontinental dispersal of bacteria and archaea by transpacific winds. Applied and Environmental Microbiology, 79(4): 1134-1139. DOI:10.1128/AEM.03029-12 (  0) 0) |
Stein, A. F., Draxler, R. R., Rolph, G. D., Stunder, B. J. B., Cohen, M. D., and Ngan, F., 2015. NOAA's hysplit atmospheric transport and dispersion modeling system. Bulletin of the American Meteorological Society, 96(12): 2059-2077. DOI:10.1175/BAMS-D-14-00110.1 (  0) 0) |
van Doorn, R., Szemes, M., Bonants, P., Kowalchuk, G. A., Salles, J. F., Ortenberg, E., et al., 2007. Quantitative multiplex detection of plant pathogens using a novel ligation probe-based system coupled with universal, high-throughput real-time PCR on OpenArrays (TM). BMC Genomics, 8(276): 1-14. (  0) 0) |
Veron, F., 2015. Ocean spray. Annual Review of Fluid Mechanics, 47(1): 507-538. DOI:10.1146/annurev-fluid-010814-014651 (  0) 0) |
Wei, M., Xu, C., Xu, X., Zhu, C., Li, J., and Lv, G., 2019. Characteristics of atmospheric bacterial and fungal communities in PM2.5 following biomass burning disturbance in a rural area of North China Plain. Science of the Total Environment, 651: 2727-2739. DOI:10.1016/j.scitotenv.2018.09.399 (  0) 0) |
Xia, X., Wang, J., Ji, J., Zhang, J., Chen, L., and Zhang, R., 2015. Bacterial communities in marine aerosols revealed by 454 pyrosequencing of the 16S rRNA gene. Journal of the Atmospheric Science, 72(8): 2997-3008. DOI:10.1175/JAS-D-15-0008.1 (  0) 0) |
Xie, Z., Li, Y., Lu, R., Li, W., Fan, C., Liu, P., et al., 2018. Characteristics of total airborne microbes at various air quality levels. Journal of Aerosol Science, 116: 57-65. DOI:10.1016/j.jaerosci.2017.11.001 (  0) 0) |
Xu, C., Wei, M., Chen, J., Zhu, C., Li, J., Lv, G., et al., 2017. Fungi diversity in PM2.5 and PM1 at the summit of Mt. Tai: Abundance, size distribution, and seasonal variation. Atmospheric Chemistry and Physics, 17(18): 11247-11260. DOI:10.5194/acp-17-11247-2017 (  0) 0) |
Yu, J., Hu, Q., Xie, Z., Kang, H., Li, M., Li, Z., et al., 2013. Concentration and size distribution of fungi aerosol over oceans along a cruise path during the Fourth Chinese Arctic Research Expedition. Atmosphere, 4(4): 337-348. DOI:10.3390/atmos4040337 (  0) 0) |
Zhang, T., Li, X., Wang, M., Chen, H., and Yao, M., 2019. Microbial aerosol chemistry characteristics in highly polluted air. Science China Chemistry, 62(8): 1051-1063. DOI:10.1007/s11426-019-9488-3 (  0) 0) |
Zhen, Q., Deng, Y., Wang, Y., Wang, X., Zhang, H., Sun, X., et al., 2017. Meteorological factors had more impact on airborne bacterial communities than air pollutants. Science of the Total Environment, 601-602: 703-712. DOI:10.1016/j.scitotenv.2017.05.049 (  0) 0) |
 2023, Vol. 22


