2) First Institute of Oceanography, Ministry of Natural Resources, Qingdao 266061, China;
3) Function Laboratory for Ocean Dynamics and Numerical Modeling, Pilot National Laboratory for Marine Science and Technology, Qingdao 266237, China
Near inertial waves (NIWs) are high-frequency waves in the ocean, characterized by an energetic peak near the local inertial frequency (f=2Ωsinφ, where Ω and φ denote the angular velocity of the earth's rotation and latitude, respectively) in the continuum internal wave spectrum (Pollard, 1980; Baines, 1986). It has been estimated that the global wind work on inertial motions is comparable to the wind work on geostrophic motions (Alford, 2003). From a global perspective, NIWs are important because they are considered to be a major contributor to upperocean mixing, which can affect a variety of processes, including biogeochemistry and climate (Jochum et al., 2013). Munk and wunsch (1998) showed that NIWs provided substantial amounts of energy to the process of deep ocean mixing, which is very important for maintaining abyssal stratification and driving the overturning circulation in the deep ocean.
Previous studies found multiple NIW generation mechanisms, including wind forcing at the ocean surface, nonlinear wave–wave interactions, and lee-wave formation by geostrophic flow over the seafloor topography (e.g., Alford et al., 2016). The view that wind forcing is the main NIW excitation mechanism is supported by observational data (e.g., D'Asaro, 1985; Jaimes and Shay, 2010; Sanford et al., 2011; Pallàs-Sanz et al., 2016). Time-varying wind stress on the ocean surface can drive inertial motion in the surface mixed layer (Alford, 2001). Once this motion is excited, horizontal convergences and divergences could disturb the stratified base of the mixed layer, generating near-inertial internal waves near the local inertial frequency at the base of the mixed layer (Moehlis and Llewellyn Smith, 2001). After generation, the NIWs propagate downward into the stratified interior, draining energy from the mixed layer and ultimately depositing that energy in the form of turbulent mixing (Cuypers et al., 2013; Soares et al., 2016).
The South China Sea (SCS) is the largest semi-en-closed marginal sea with a large northeast–southwest oriented abyssal basin. The mixing process plays an important role in the formation and maintenance of the deep circulation in the SCS (Tian and Qu, 2012; Wang et al., 2016). The NIWs could drain the energy from the mixed layer to the ocean interior which may promote the mixing processes in the deep ocean. The SCS is vulnerable to tropical cyclones, with on average of 10.2 typhoons per year traversing this region (Wang et al., 2007). Recent studies showed that the passage of tropical cyclones can induce NIWs in the SCS (e.g., Sun et al., 2012; Chen et al., 2013; Yang et al., 2015; Shu et al., 2016; Zheng et al., 2017). The near inertial velocities following typhoons vary from 0.1 m s-1 to 1 m s-1 depending on the intensity and transition speed of the tropical cyclones. Previous studies based on in situ observations revealed some characteristics of NIWs caused by typhoons in the SCS. For example, Chen et al. (2013) examined large NIW events induced by tropical cyclones and found that the near inertial kinetic energy (NIKE) in the subsurface layer exhibited obvious seasonality. Guan et al. (2014) studied the interaction between diurnal tides and NIWs after Typhoon Megi, which transferred the energy from the inertial band to a higher frequency, resulting in rapid damping of the NIWs. Yang and Hou (2014) investigated the horizontal wavelength and vertical phase and group velocity of NIWs in the wake of Typhoon Nesat in 2011. Yang et al. (2015) investigated the typhoon-induced NIWs on the continental shelf of the northwestern SCS and found that the intensity of the tropical cyclones caused variation of NIWs in shallow water. The characteristic and propagation behaviour of NIWs were affected by local stratification and background vorticity.
The water-column structure and the diverse oceanographic processes in the SCS contribute substantially to the complex propagation and distribution of the NIWs. Our understanding regarding the vertical structure and vertical propagation process of NIWs in the SCS remains poor; therefore, the characteristics of NIWs should be further examined. To investigate the evolution of NIWs we deployed a mooring observation system southeast of Dongsha Island (20.3°N, 117.6°E) to record the water velocity over a one-year period. During the observation period (in July 2015), Typhoon Linfa passed the observation site. In this paper, the characteristics of NIWs induced by Typhoon Linfa are investigated. The observation system used in the study is described in Section 2. The methods are presented in Section 3. The results are presented in Section 4, and Section 5 presents a brief summary.
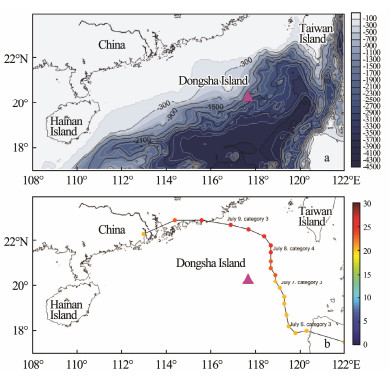
2 DataThe mooring was deployed at 20.3°N, 117.8°E in the northern SCS (red triangle in Fig. 1) from September 18, 2014 to September 16, 2015. The water depth at the site is 2224 m. The mooring station was equipped with an up-ward-looking 75 kHz Acoustic Doppler Current Profiler (ADCP) at a depth of 436 m and a downward-looking 75 kHz ADCP at a depth of 440 m. The velocity records used in this study cover the water column from the ocean surface to about 1000 m. The ADCPs measured the horizontal currents at a vertical interval of 8 m and a time interval of 1 h.
|
Fig. 1 (a) Bathymetry of the northern South China Sea based on the ETOPO-1 dataset (isobaths in meters). The triangle indicates the location of the mooring station. (b) the track of tropical storm Linfa (Joint Typhoon Warning Center, http://www.usno.navy.mil/JTWC), the color of dots indicates the intensify of wind speed. |
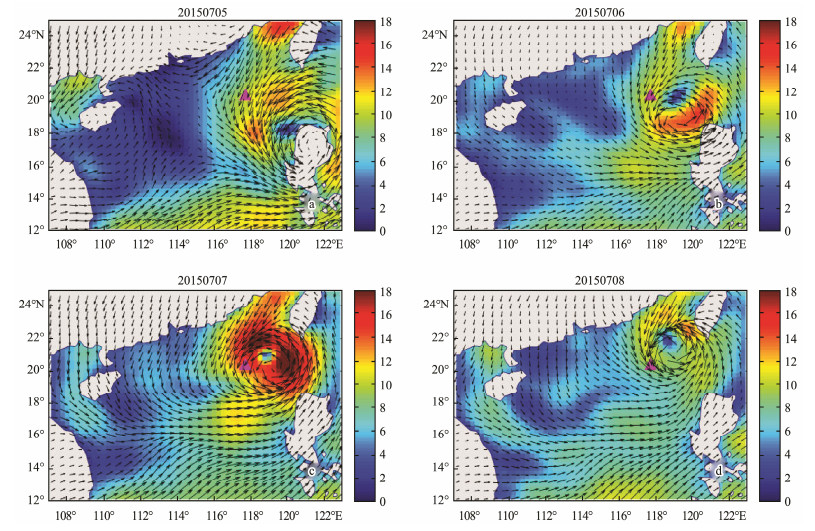
Linfa is a severe tropical storm developed on July 1 over in the Philippine Sea. After across the Philippines, Linfa turned northward toward southern China. On July 6, Linfa strengthened to typhoon intensity. The storm made landfall along the Chinese province of Guangdong on July 9. When it moved over the observation site, the maximum recorded wind speed was 50 knots (26 m s-1). The wind field in the study area during the passage of Typhoon Linfa is shown in Fig. 2.
|
Fig. 2 The wind field in the study area on July 5-8, during the passage of Typhoon Linfa. Data are from the CCMP (http://www.remss.com). |
The surface wind data used in our study is the Cross-Calibrated Multi-Platform (CCMP) data product provided by the Remote Sensing System (http://www.remss.com/). CCMP wind data are derived through cross-calibration and assimilation of ocean surface wind data from multi space-borne sensors. It has been evaluated and utilized extensively by the science community. The spatial resolution is 0.25 degree and the time resolution is 6 h. The sealevel anomaly and geostrophic current obtained from the Delayed-Time Reference Series provided by Archiving, Validation and Interpretation of Satellite Data in Oceanography (AVISO, http://www.aviso.altimetry.fr) were used to compute the background vorticity. The SLA data have a spatial resolution of 0.25 degree and time resolution of once per day.
3 Method 3.1 Wentzel-Kramers-Brillouin ScalingThe wavenumber and amplitude of a NIW change as the wave undergoes refraction in depth-varying stratification. To minimize this effect on the data we applied Wentzel-Kramers-Brillouin (WKB) scaling following Leaman and Sanford (1975).
The current profile is modified as:
| $ Current({u_{{\rm{WKB}}}}, {v_{{\rm{WKB}}}}) = \frac{{\bar N}}{{N(z)}}current(u, v), $ | (1) |
where N is the climatological buoyancy frequency derived from the World Ocean Atlas 2013 (WOA13) monthly temperature and salinity data at the mooring location.
The depth is WKB-stretched as:
| $ {z_{WKB}} = \int_0^H {\frac{{N(z)}}{{\bar N}}} {\rm{d}}z. $ | (2) |
The local Coriolis frequency (f0) is 0.6958 cycles per day (cpd), corresponding to a period of 34.5 hours. After WKB scaling, a fourth-order Butterworth filter (0.85– 1.15f0) was applied to the original currents to estimate the near-inertial horizontal profile (uWKB, vWKB). This band frequency (0.85– 1.15f0) could obtain the NIWs as much as possible while avoiding the contamination from other components such as the diurnal tidal currents. This frequency is consistent with that used in previous studies, e.g., Yang et al. (2015).
The NIKE for each profile was calculated by
| $ NIKE = \frac{1}{2}{\rho _0}(u_{{\rm{WKB}}}^2 + v_{{\rm{WKB}}}^2), $ |
where ρ0 = 1024 kg·m-3 is the reference water density.
3.3 Spectral AnalysisThe Weltch spectral method was used to analyze the energy distribution before and after the passing of Typhoon Linfa (Welch, 1967).
The rotary spectrum is used to interpret the inherent rotational characteristics of currents in different frequency bands. The rotary spectrum decomposes the complex velocity (u + iv) into clockwise (CW) and counter-clock-wise (CCW) rotating components (Gonella, 1972).
The rotary vertical wavenumber spectrum was used to explore the vertical energy propagation of the NIWs. Following the definition and method proposed by Leaman and Sanford (1975), the vertical distribution of the horizontal velocity vectors (u + iv) were divided into two parts: those with positive and negative wavenumbers. The positive and negative wavenumbers were then transformed into the clockwise and anticlockwise rotary components. The spectra of the CW and CCW components indicate how 'intensively' the wave energy is propagating downward and upward, respectively. The difference between the CW and CCW components indicates the energy propagation direction. A positive CW–CCW value indicates that the energy is propagating downward, and a negative CW–CCW value indicates that the energy is propagating upward.
3.4 Normal Mode AnalysisThe eastward and northward components of the near inertial current can be expressed as the sum of the vertical normal modes. Each mode has a vertical structure and its behavior in the horizontal dimension and in time is similar to that of a homogeneous fluid with a free surface (Gill, 1982). The normal mode equation of the internal gravity wave is
| $ \frac{{{d^2}{W_n}}}{{d{z^2}}} + \frac{{{N^2}}}{{c_n^2}}{W_n} = 0, $ |
where Wn and cn are the displacement (eigenfunction) and phase speed (eigenvalue) of the nth baroclinic mode. N is the climatological buoyancy frequency derived from the World Ocean Atlas 2013 (WOA13) monthly temperature and salinity data at the mooring location.
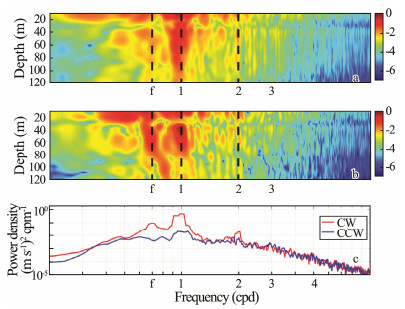
4 NIWs Induced by Typhoon Linfa 4.1 Spectral AnalysisThe power spectra of the northward current before and after the passage of Linfa are shown in Fig. 3. Before Linfa, the diurnal internal tides dominate the current with an energy density 10 times larger than that in the inertial band. After Linfa, an energy peak appears in the inertial band with an energy density more than 10 times larger than that before Linfa. The near inertial energy is mainly constrained in the upper 80 m. The power spectra of the eastward currents have similar characteristics to the northward currents and are not shown here. The rotary spectra of the CW and CCW components of the depth-integrated WKB-scaled current (Fig. 3c) demonstrate a significant circularly polarized characteristic in the inertial band, where the CW component is 10 times larger than the CCW component, indicating downward energy propagation of the NIWs.
|
Fig. 3 Power spectra of the northward current before (a) and after (b) the passage of Typhoon Linfa. The vertical dashed lines indicate (from left to right) the local inertial frequency (f0) and the diurnal (K1) and the semi-diurnal (M2) tidal frequencies. (c) The rotary spectra of the clockwise and counter-clockwise components of the depth-integrated current in the upper 120 m after the passing of Linfa. |
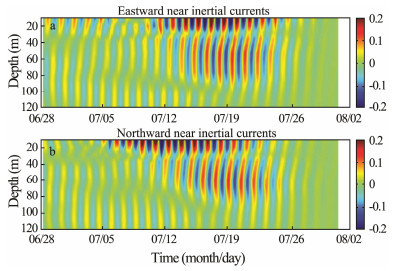
The band-pass-filtered (0.85–1.15f0) time-series of the near inertial current profiles from 28 June to 31 July are shown in Fig. 4. There are two NIW maximum layers: one is located at 15 m depth in the mixed layer and the other is located at 60 m depth in the ocean interior. The maximum amplitude of the oscillation reached 35 cm s-1 in the mixed layer and 20 cm s-1 in the ocean interior. The interior NIWs clearly lag behind the NIWs in the mixed layer. It is clearly that the NIWs in the ocean interior are the vertical propagation of the NIWs in the mixed layer. Typhoon Linfa passed the observation station in a relatively short time, transferring energy to the mixed layer; this energy was then transferred into the ocean interior by the NIWs. The NIWs experienced 180° phase shift during its propagation from mixed layer to the deep ocean. Note that the northward NIW component is ahead of the eastward component; this is because the wind changes first appeared in the northward direction as Linfa was approaching while the eastward changes occurred mainly when the typhoon was moving away from the observation site (Fig. 2).
|
Fig. 4 Depth profiles of (a) eastward and (b) northward components of the near inertial current induced by Typhoon Linfa in July 2015. |
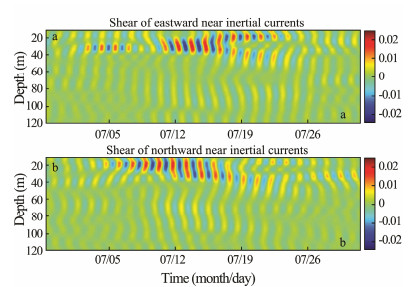
The vertical shear profiles indicate that the NIWs generated strong shear motion in the upper layer (Fig. 5). The strongest shear area is from the base of the mixed layer to the top of the thermocline, with a shear maxima around 0.02 s–1. The strong vertical shear indicates active momentum transfer between the mixed layer and the thermocline. Jochum et al. (2013) showed that the vertical shear instabilities induced by NIWs are a major contributor to upperocean mixing, which can affect a variety of processes including biogeochemistry and climate.
|
Fig. 5 Vertical shear depth profiles of the near inertial current in July 2015. (a) eastward component, (b) northward component. |
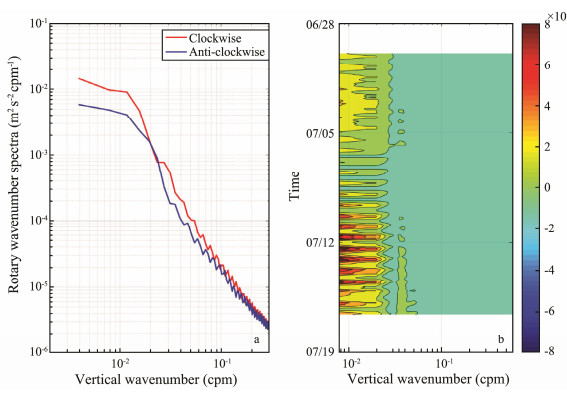
The vertical propagation of the NIKE was examined using the rotary vertical wavenumber spectra. The timemean rotary vertical wave number spectra of the CW and CCW components after Linfa are shown in Fig. 6. As the vertical wavenumber increases, the spectral energy declines. It is obvious that the CW components dominate, especially in the low-wavenumber range, indicating downward energy propagation. The CW component is 5 times stronger than the CCW component for wavenumbers smaller than 10-2 cycles per meter (cpm). The difference between the CW and CCW spectral energy decreases as the wavenumber increases, indicating that the NIW signals are most prominent for large-scale motions.
|
Fig. 6 (a) Rotary vertical wavenumber spectra after Typhoon Linfa. The red and blue lines represent the CW and CCW components, respectively. (b) Time evolution of CW–CCW (the difference between the vertical wavenumber spectra component of CW and CCW). |
We define the rotary vertical wavenumber spectrum difference as the CW component minus the CCW component, where a positive value indicates downward energy propagation and a negative value represents upward energy propagation. The time evolution of the spectrum difference is plotted in Fig. 6b and shows mostly positive values, especially for wavelengths larger than 80 m. Thus, the NIWs transport energy from the surface layer to the deep layer, suggesting that Typhoon Linfa injected a large fraction of the downward propagating energy into the ocean interior.
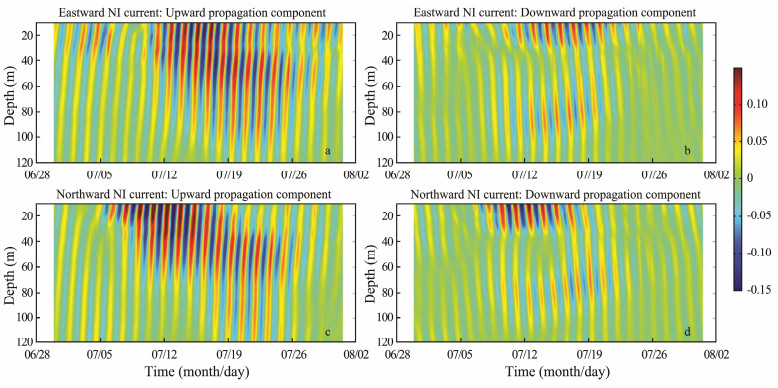
Following the method proposed by Pallàs-Sanz et al. (2016), we decomposed the original current profiles into the upward and downward propagation components. As shown in Figs. 7a and 7c, a set of discrete downward propagation NIWs are pronounced. The downward propagation component is evident for the whole profile from the sea surface to 120 m depth (Figs. 7a and 7c) while the upward propagation component appears only in the mixed layer (Figs. 7b and 7d). This indicates that the NIKE propagates downward from the surface to the deep ocean, transferring substantial energy into the deep ocean. This is consistent with the wavenumber spectral analysis results in Fig. 6. Based on the slope of the downward propagation component, the phase velocity is estimated to be 1.44 m h-1. With the period of 34.5 h estimated from the adjacent positive (or negative) phase, the vertical wavelength is about 49.7 m.
|
Fig. 7 (a) The downward propagation component of the eastward NIWs. (b) The upward propagation component of the eastward NIWs. (c) and (d) are same as (a) and (b), but for the northward components. |
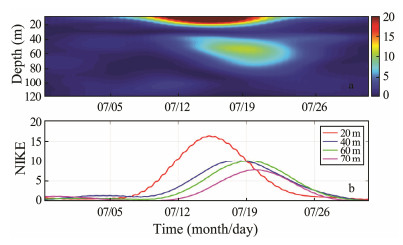
The temporal variability and vertical distribution of the NIKE is plotted in Fig. 8. The NIKE decreases rapidly with depth. The NIKE in the mixed layer is much larger than in the ocean interior. Two energy cores can be observed: in the mixed layer and in the ocean interior. The maximum NIKE reaches 35 J m-3 in the mixed layer energy core and 10 J m-3 in the ocean interior energy core. Considering the vertical distribution of NIWs (Fig. 4), the energy core in the ocean interior is the result of vertical propagation of NIWs. Time-varying wind stress during Linfa can drive inertial motion in the surface mixed layer. Once this motion is excited, horizontal convergences and divergences could disturb the stratified base of the mixed layer, generating near-inertial internal waves at the base of the mixed layer (Moehlis and Llewellyn Smith, 2001) and propagate downward into the stratified interior. The NIKE decays rapidly over time and almost disappears on July 24. The vertical group velocity Cgz is estimated to be 0.4 m d-1 by examining the time delay of the two a near inertial wave cores.
|
Fig. 8 (a) The temporal variability and vertical distribution of the NIKE (J m-3) in July 2015. (b) Time evolution of the NIKE at different depths. |
Given that the NIKE increases and attenuates exponentially with time, we utilize the e-folding time-scale to denote the persistence time-scale of the NIWs. The e-folding time-scale is defined as the time interval between the initial and final moments when the NIKE reaches 1/e of its maximum value. The e-folding decay timescale is 5 d and 7.5 d based on the NIKE time series in the mixed layer and at 60 m, respectively. This is consistent with previous studies that show that storm-generated NIWs usually persisted for over a week or even 10 days.
As documented in Oey et al. (2008), the damping of NIKE energy is usually related to lateral radiation, downward radiation and mixing in the form of internal waves breaking. Using a three-dimensional model, Zhai et al.(2009) demonstrated that the integrated energy flux through the open boundaries was indeed small compared with the downward radiation and could generally be neglected. In our case, there is no obvious downward energy radiation at depths deeper than 80 m. It is likely that local mixing contributed to the damping of the NIKE after July 24. It has been documented that the wave-wave interactions which may be associated with Parametric Subharmonic Instability (PSI) play an important role in the internal wave spectral cascade (Xie et al., 2011). For example, Lin et al. (2015) found interaction between NIWs and diurnal tides after Typhoon Hagupit. However, we obtained the fD1-band and fD2-band energy using the bandpass filter method after Typhoon Linfa and found no obvious energy enhancement around these bands. Thus, the direct breaking of small-scale waves may result in the loss of NIKE.
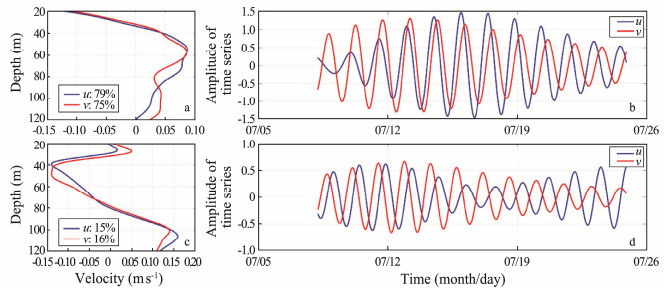
4.5 Vertical Mode AnalysisThe Empirical Orthogonal Function (EOF) decomposition method was adopted to analyze the NIWs after the passing of typhoon Linfa. The vertical modes are similar for the eastward and northward components. The first normal mode dominates with a variance contribution of 79% with a node around 30 m for eastward component (Fig. 9). The second normal mode dominates with a variance contribution of 15% and has two nodes around 30 m and 90 m, respectively. The other modes contribute little to the total variance. The first mode emerged simultaneously after the passing Linfa, then increased gradually, reaching its peak on July 17. After that, the first mode decreased gradually.
|
Fig. 9 (a) Vertical profiles of the first EOF mode and (b) the time series of the first mode. (c) and (d) are similar to (a) and (b) but for the second mode. |
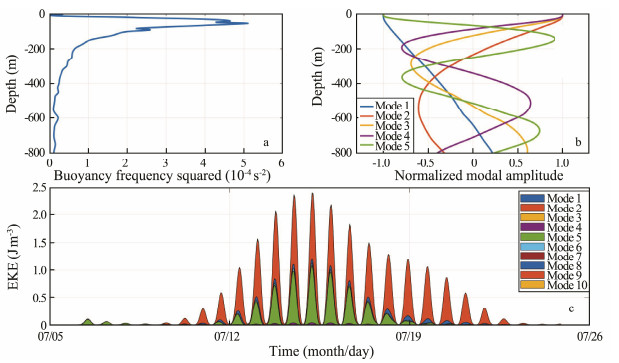
We also used the dynamic normal mode decomposition to analyze the vertical structure of the NIWs. Different from the EOF, the dynamic normal model decomposition has the physical meaning. The original current can be described by a superposition of discrete baroclinic modes by the normal mode decomposition. The method has been introduced in Section 2. Fig. 10 shows the results of the normal mode analysis. The depth-averaged NIKE from 50 to 120 m shows that this NIW event is largely contributed by the high vertical modes (mode 5 and mode 9). The vertical mode may play important roles in the decay period of NIW and the mixing process associated with the breaking of NIW.
|
Fig. 10 (a) Vertical profiles of buoyancy frequency and (b) the corresponding first five solutions. (c) The depth-averaged NIKE from 50 to 120 m for the first ten dynamical modes. Different colors represent different modes. |
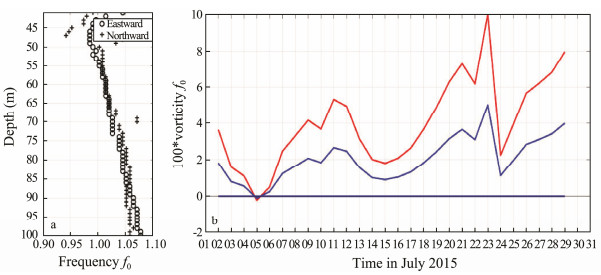
Because the frequency resolution of the estimated spectra is too low to finely resolve the peak frequency of the observed NIWs, we used an alternative method. We calculated the mean interval between two adjacent NIW peaks and then used this time interval to calculate the real near inertial frequency. The results are shown in Fig. 11. After Typhoon Linfa, the real frequency of the observed NIWs is larger than the local inertial frequency at depths of 60–100 m. The depth-mean frequency is about 1.03f0, i.e., a blue-shift of 0.03f0.
|
Fig. 11 (a) Vertical profiles of the frequency of the observed north and east NIWs after Typhoon Linfa. The horizontal axis is normalized by the local inertial frequency. (b) Time series of the background vorticity (red line) and half background vorticity (blue line) in July 2015. The vertical axis is normalized by 10-2f0 |
Kunze (1985) explored the influence of the mean flow shear on NIWs by examining a wave-mean flow interaction model and found that the background flow vorticity would modify the frequency of the NIWs. If the back-ground vorticity is small compared with the planetary vorticity, the frequency shift of the NIWs is
| $ {f_{{\rm{eff}}}} = {f_0} + \zeta /2 = {f_0} + \left({\frac{{\partial {V_0}}}{{\partial x}} - \frac{{\partial {U_0}}}{{\partial y}}} \right)/2, $ |
where feff is the effective Coriolis frequency and ζ is the vorticity of the mean flow (u0, v0).
The geostrophic current data of AVISO were adopted to calculate the background vorticity around the observation station. The half background vorticity increased gradually after July 6. The temporally averaged (July 16 to July 26) half background vorticity is positive after the passing of Linfa. The background vorticity is comparable with the aforementioned blue-shift, suggesting that the background vorticity contributed to the blue shift. It should be also noted that the NIWs could propagate horizontally after being generated in the mixed layer (Fu, 1981). The background plays important roles in modulating the propagation process of NIWs (Alford et al., 2016). Part of the observed NIWs is probably the remotely generated NIWs at high latitude. More in situ data are needed to investigate the spatial distribution of NIWs after the storms passing through.
5 SummaryIn July 2015, Typhoon Linfa (2015) passed over the northern SCS and our in situ observations indicated energetic NIWs along its wake. This study examined the amplitude, frequency, vertical propagation, and normal modes of the NIWs. The results demonstrate that Linfa induced near inertial currents with velocities up to 35 cm s-1 in the mixed layer and 20 cm s-1 in the ocean interior. The strong vertical shear between the base of the mixed layer and the top of the thermocline indicates momentum transfer between them.
The wavenumber spectrum and the downward/upward currents decomposition demonstrated that the near inertial oscillations and energy flux propagate mainly downward. These characteristics suggest that the energy injected into the mixed layer by Linfa spreads into the ocean interior mainly in the form of NIWs. Hence, the NIWs played a crucial role in the energy redistribution in the ocean after the passage of Linfa. The estimated vertical phase velocity and group velocity are 1.44 m h-1 and 0.4 m d-1 respectively, corresponding to a vertical wavelength of 49.7 m. The e-folding time scale is 7.5 d based on the near inertial energy in the ocean interior. The wave-wave interactions can transfer energy fluxes into and/or out of the nearinertial frequency band. However, in our case, there is no obvious wave-wave interaction during the decay process of the near inertial oscillations. The frequency is blueshifted, 0.03 times higher than the local inertial frequency. Previous studies show that the background vorticity and stratification may influence the NIW propagation and dissipation. The blue shift of the frequency is caused by the background vorticity. A normal mode analysis indicates that the high modes (mode 5 and mode 9) dominate NIKE as NIW propagate downward.
AcknowledgementsThe authors would like to thank the crew that con- ducted the field measurements. We would also like to thank the Remote Sensing System team (http://www.remss.com/) for the distribution of CCMP wind data, and AVISO (https://www.aviso.altimetry.fr/) for the distribution of sea surface anomaly data. This work was supported by the National Key Research and Development Program of China (No. 2017YFC1404201), the National Natural Science Foundation of China (Nos. 41706035, 41876027 and 41876029), the Laboratory for Regional Oceanography and Numerical Modeling, Qingdao National Laboratory for Marine Science and Technology (No. 2017A01), China Postdoctoral Science Foundation (No. 2017M622111), and the NSFC-Shandong Joint Fund for Marine Science Research Centers (No. U1606405).
Alford, M. H., 2001. Internal swell generation: The spatial distribution of energy flux from the wind to mixed layer near-inertial motions. Journal of Physical Oceanography, 31(8): 2359-2368. DOI:10.1175/1520-0485(2001)031<2359:ISGTSD>2.0.CO;2 (  0) 0) |
Alford, M. H., 2003. Improved global maps and 54-year history of wind-work on ocean inertial motions. Geophysical Research Letters, 30(8): 122-137. (  0) 0) |
Alford, M. H., Mackinnon, J. A., Simmons, H. L. and Nash, J. D., 2016. Near-inertial internal gravity waves in the ocean. Annual Review of Marine Science, 8(8): 95. DOI:10.1146/annurev-marine-010814-015746 (  0) 0) |
Baines, P. G., 1986. Internal tides, internal waves and near- inertial motions. Baroclinic Processes on Continental Shelves, 3: 19-31. (  0) 0) |
Chen, G., Xue, H., Wang, D. and Xie, Q., 2013. Observed near- inertial kinetic energy in the northwestern South China Sea: Near-inertial energy in the SCS. Journal of Geophysical Re- search: Oceans, 118(10): 4965-4977. DOI:10.1002/jgrc.20371 (  0) 0) |
Cuypers, Y., Le Vaillant, X., Bouruet-Aubertot, P., Vialard, J. and McPhaden, M. J., 2013. Tropical storm-induced near- inertial internal waves during the Cirene experiment: Energy fluxes and impact on vertical mixing: Storm-induced NIW during Cirene. Journal of Geophysical Research: Oceans, 118(1): 358-380. DOI:10.1029/2012JC007881 (  0) 0) |
D'Asaro, E. A., 1985. The energy flux from the wind to near- inertial motions in the surface mixed layer. Journal of Physical Oceanography, 15(8): 1043-1059. DOI:10.1175/1520-0485(1985)015<1043:TEFFTW>2.0.CO;2 (  0) 0) |
Fu, L. L., 1981. Observations and models of inertial waves in the deep ocean. Reviews of Geophysics, 19(1): 141-170. (  0) 0) |
Gill, A., 1982. Atmosphere-Ocean Dynamics. Academic Press, London.
(  0) 0) |
Gonella, J., 1972. A rotary-component method for analysing meteorological and oceanographic vector time series. Deep Sea Research and Oceanographic Abstracts, 19(12): 833-846. DOI:10.1016/0011-7471(72)90002-2 (  0) 0) |
Guan, S., Zhao, W., Huthnance, J., Tian, J. and Wang, J., 2014. Observed upper ocean response to Typhoon Megi (2010) in the northern South China Sea. Journal of Geophysical Research: Oceans, 119(5): 3134-3157. DOI:10.1002/2013JC009661 (  0) 0) |
Jaimes, B. and Shay, L. K., 2010. Near-inertial wave wake of hurricanes Katrina and Rita over mesoscale oceanic eddies. Journal of Physical Oceanography, 40(6): 1320-1337. DOI:10.1175/2010JPO4309.1 (  0) 0) |
Jochum, M., Briegleb, B. P., Danabasoglu, G., Large, W. G., Norton, N. J., Jayne, S. R., Alford, M. H. and Bryan, F. O., 2013. The impact of oceanic near-inertial waves on climate. Journal of Climate, 26(9): 2833-2844. DOI:10.1175/JCLI-D-12-00181.1 (  0) 0) |
Kunze, E., 1985. Near-inertial wave propagation in Geostrophic Shear. Journal of Physical Oceanography, 15(5): 544-565. DOI:10.1175/1520-0485(1985)015<0544:NIWPIG>2.0.CO;2 (  0) 0) |
Leaman, K. D. and Sanford, T. B., 1975. Vertical energy propaga- tion of inertial waves: A vector spectral analysis of velocity profiles. Journal of Geophysical Research, 80(15): 1975-1978. DOI:10.1029/JC080i015p01975 (  0) 0) |
Lin, F., Liang, C., Hou, Y., Liu, Y., Liu, Z. and Hu, P., 2015. Observation of interactions between internal tides and near- inertial waves after typhoon passage in the northern South China Sea. Chinese Journal of Oceanology and Limnology, 33(5): 1279-1285. DOI:10.1007/s00343-015-4253-0 (  0) 0) |
Moehlis, J. and Llewellyn, Smith S. G., 2001. Radiation of mixed layer near-inertial oscillations into the ocean interior. Journal of Physical Oceanography, 31(6): 1550-1560. DOI:10.1175/1520-0485(2001)031<1550:ROMLNI>2.0.CO;2 (  0) 0) |
Munk, W. and Wunsch, C., 1998. Abyssal recipes Ⅱ: Energetics of tidal and wind mixing. Deep Sea Research Part Ⅰ Oceano- graphic Research Papers, 45(12): 1977-2010. DOI:10.1016/S0967-0637(98)00070-3 (  0) 0) |
Oey, L. Y., Inoue, M., Lai, R., Lin, X. H., Welsh, S. E. and Rouse, L. J., 2008. Stalling of near-inertial waves in a cyclone. Geophysical Research Letters, 35(12): 150-152. (  0) 0) |
Pallàs-Sanz, E., Candela, J., Sheinbaum, J. and Ochoa, J., 2016. Mooring observations of the near-inertial wave wake of Hurricane Ida 2009. Dynamics of Atmospheres and Oceans, 76: 325-344. DOI:10.1016/j.dynatmoce.2016.05.003 (  0) 0) |
Pollard, R. T., 1980. Properties of near-surface inertial oscil- lations. Journal of Physical Oceanography, 10(3): 385-398. DOI:10.1175/1520-0485(1980)010<0385:PONSIO>2.0.CO;2 (  0) 0) |
Sanford, T. B., Price, J. F. and Girton, J. B., 2011. Upper-ocean response to hurricane Frances (2004) observed by profiling EM-APEX floats. Journal of Physical Oceanography, 41(6): 1041-1056. DOI:10.1175/2010JPO4313.1 (  0) 0) |
Shu, Y., Pan, J., Wang, D., Chen, G., Sun, L. and Yao, J., 2016. Generation of near-inertial oscillations by summer monsoon onset over the South China Sea in 1998 and 1999. Deep Sea Research Part Ⅰ: Oceanographic Research Papers, 118: 10-19. DOI:10.1016/j.dsr.2016.10.008 (  0) 0) |
Soares, S. M., Natarov, A. and Richards, K. J., 2016. Internal swells in the tropics: Near-inertial wave energy fluxes and dissipation during CINDY: Near-inertial waves in tropical oceans. Journal of Geophysical Research: Oceans, 121(5): 3297-3324. DOI:10.1002/2015JC011600 (  0) 0) |
Sun, L., Zheng, Q., Tang, T.-Y., Chuang, W.-S., Li, L., Hu, J. and Wang, D., 2012. Upper ocean near-inertial response to 1998 typhoon Faith in the South China Sea. Acta Oceanologica Sinica, 31(2): 25-32. DOI:10.1007/s13131-012-0189-9 (  0) 0) |
Tian, J. and Qu, T., 2012. Advances in research on the deep South China Sea circulation. Chinese Science Bulletin, 57(24): 3115-3120. DOI:10.1007/s11434-012-5269-x (  0) 0) |
Wang, D., Xiao, J., Shu, Y., Xie, Q., Chen, J. and Wang, Q., 2016. Progress on deep circulation and meridional overturning circulation in the South China Sea. Science China Earth Sciences, 59(9): 1827-1833. DOI:10.1007/s11430-016-5324-6 (  0) 0) |
Wang, G., Su, J., Ding, Y. and Chen, D., 2007. Tropical cyclone genesis over the South China Sea. Journal of Marine Systems, 68(3-4): 318-326. DOI:10.1016/j.jmarsys.2006.12.002 (  0) 0) |
Welch, P., 1967. The use of fast Fourier transform for the esti- mation of power spectra: A method based on time averaging over short, modified periodograms. IEEE Transactions on Audio and Electroacoustics, 15(2): 70-73. DOI:10.1109/TAU.1967.1161901 (  0) 0) |
Xie, X. H., Shang, X. D., Haren, H. V., Chen, G. Y. and Zhang, Y. Z., 2011. Observations of parametric subharmonic insta- bility-induced near-inertial waves equatorward of the critical diurnal latitude. Geophysical Research Letters, 38(5): 132-140. DOI:10.1029/2010GL046521 (  0) 0) |
Yang, B. and Hou, Y., 2014. Near-inertial waves in the wake of 2011 typhoon Nesat in the northern South China Sea. Acta Oceanologica Sinica, 33(11): 102-111. DOI:10.1007/s13131-014-0559-6 (  0) 0) |
Yang, B., Hou, Y., Hu, P., Liu, Z. and Liu, Y., 2015. Shallow ocean response to tropical cyclones observed on the continen- tal shelf of the northwestern South China Sea: Oceanic re- sponse to tropical cyclones. Journal of Geophysical Research: Oceans, 120(5): 3817-3836. DOI:10.1002/2015JC010783 (  0) 0) |
Zhai, X., Greatbatch, R. J., Eden, C. and Hibiya, T., 2009. On the loss of wind-induced near-inertial energy to turbulent mixing in the upper ocean. Journal of Physical Oceanography, 39(11): 3040-3045. DOI:10.1175/2009JPO4259.1 (  0) 0) |
Zheng, J., Tian, J. and Liang, H., 2017. Observation of near- inertial internal waves on the continental slope in the north- western South China Sea. Journal of Ocean University of China, 16(2): 184-190. DOI:10.1007/s11802-017-3153-7 (  0) 0) |
 2019, Vol. 18


