2) Key Laboratory of Estuary and Coast of Zhejiang Province, and Zhejiang Institute of Hydraulics and Estuary, Hangzhou 310020, China;
3) Shandong Provincial Key Laboratory of Ocean Engineering, and College of Engineering, Ocean University of China, Qingdao 266100, China;
4) Shandong Water Conservancy Vocational College, Rizhao 276826, China;
5) School of Mechanical and Energy Engineering, Ningbotech University, Ningbo 315211, China
Current-induced local scour around a pile-like structure is one of the most common hazards in coastal areas (Sumer and Nielsen, 2013; Hu, 2019; Gao et al., 2021, 2023; Du et al., 2023) as it can uncover the foundation of a pile and reduce pile-carrying capacity. When a pile is placed in an erodible bed, local scour occurs easily because of complex interactions among three-dimensional turbulent flow, pile, and sediment particles. Examples can be found in tidal current-induced scour around sea-crossing bridge piers (Zhang et al., 2023), wave-current-induced scour around submerged pipeline foundations (Zhao et al., 2018), and offshore wind power pile foundations (Sumer and Nielsen, 2013). The tidal current period can be as long as 12 h. To study the working conditions of local scour, the sinusoidal bidirectional tidal current is usually considered square tide and stepped tide in each tidal cycle (Schendel et al., 2018). Aiming at reducing scour depth and protecting pile stability, numerous studies have examined the mechanisms of local scour (Dargahi, 1990; Zhao et al., 2021; Williams et al., 2022) and determined the influential factors (Melville, 1997) and empirical equations for the scour depth (Melville, 1997; Zhang et al., 2023). Results reveal that a horseshoe vortex in front of the pile, a vortex-shedding flow behind the pile, and flow acceleration at upstream pile corners are the main factors contributing to local scour in a steady current (Williams et al., 2022). These coherent structures amplify bed shear stress and thus drive the sediment particles to move (Alemi et al., 2019). Several empirical scour depth formulas obtained by analyzing relationships among influential parameters (e.g., flow depth, flow velocity, tidal cycles, wave period, wave height, sedi-ment particle diameter, sediment nonuniformity, pile shape, pile height, pile width, and pile numbers) and scour depth are available in the literature (Melville, 1997; Zhao et al., 2021; Zhang et al., 2023). However, relationships among influential factors (e.g., the flow, sediment, and pile) and estimated scour depth are often associated with large errors under field and laboratory conditions because of a lack of knowledge of flow fields and local scour mechanisms (Beheshti and Ataie-Ashtiani, 2016). As the understanding of turbulent flow fields around piles can help improve the accuracy of scour depth predictions considerably (Kirkil and Constantinescu, 2010; Guan et al., 2019), the goal of the present paper is to study flow fields near piles in flat and scoured beds.
Although several researchers have studied the turbulent characteristics of flows passing cylinders, most of them only considered fixed flat beds (Beheshti and Ataie-Ash-tiani, 2016; Chang et al., 2020) or infinite cylinder conditions in scoured beds (Alemi et al., 2019; Guan et al., 2019) rather than submerged piles with scour holes. Actually, in river and coastal engineering, submerged piles can represent a series of pile-like structures such as subsea caissons, weirs, submarine manifolds, and marine pipeline foundations (Zhao et al., 2012). However, flow fields around a fixed flat bed and pile cannot represent the interactions of altered flow turbulences in a scoured bed corresponding to the developing scouring or equilibrium scouring stages (Koken and Constantinescu, 2008; Kirkil and Constantinescu, 2009). At the initial scouring stage, scour depth increases sharply and scour holes emerge in front of the pile because of the effects of flow acceleration at the upstream pile sides. At the developing scouring stage, scour depth increases gradually at a decreasing rate, although the strength and extent of the horseshoe vortex increase. At the equilibrium stage, scour depth and scour hole size are kept stable at constant values in clear-water scour conditions or dynamic values near certain values under live-bed scour conditions (Dargahi, 1990; Guan et al., 2019; Du et al., 2022a, 2022b). Once the equilibrium stage is attained, morphology around the pile is stabilized. Therefore, turbulent structures and flow characteristics around a scoured bed (modified compared to those for a flat bed) maintain a stable pattern (Kirkil and Constantinescu, 2009). Moreover, flow fields around a submerged pile are more complicated than those around an infinite cylinder (Zhang et al., 2017). In submerged tests, the strength of the horseshoe vortex increases with the flow-depth-to-pile-height ratio (Chang et al., 2020). Studies of local scour around submerged piles have indicated that sediment incipience and transport are considerably affected by these different flow regimes (Williams et al., 2022). The scour depth decreases with the flow-depth-to-pile-height ratio under submerged conditions (Zhao et al., 2012).
In recent decades, research methods and instruments have been developed for evaluating turbulent flow fields around piles under scoured-bed conditions. Using the hydrogen bubble technique, Dargahi (1990) reported that a change in the boundary conditions from a flat bed to a scoured bed does not substantially change the horseshoe vortex structure. Moreover, the interactions between upstream scouring and wake scouring occur mainly through the actions of the horseshoe vortices. Recently, advanced techniques of acoustic Doppler velocimetry (ADV), laser Doppler anemometry, and particle image velocimetry (PIV) have been used to study these flow turbulences. Some notable studies are reported by Beheshti and Ataie-Ashtiani (2016), Guan et al. (2019), and Williams et al. (2022). Although the use of ADV and PIV contributes to the study of the characteristics of turbulence structures around piles, this approach has limitations, such as evident disturbance of flow fields, inaccurate bed shear stress in the inner scour hole in the instantaneous and mean flow fields, and shading of structures measured in compound piles. In contrast, numerical models can overcome some measurement instrument limitations and provide more details about the flow field. Numerical studies with and without scour holes around piles using k-ω model (Kumar and Afzal, 2023), large eddy simulation (LES) model (Alemi et al., 2019), detached eddy simulation (DES) model (Kirkil and Constantinescu, 2010; Chang et al., 2020), and direct numerical simulation (DNS) model (Zhang et al., 2017) are available in the literature. Generally, DNS is the most accurate model, as it resolves all turbulent scales temporally and spatially (Alemi et al., 2019). However, DNS and LES are quite time-consuming. For example, using the LES model, Lysenko et al. (2012) spent 226 h simulating 150 vortex-shedding periods with a pile-based Reynolds number of 3900 and 5.76 million grid cells, employing 256 cores in parallel. Similarly, Kim et al. (2015) used 360 h to simulate 30 vortex-shedding periods with a pile-based Reynolds number of 41000 and 5 million grid cells, employing 96 cores in parallel. Meanwhile, the requirements for high-quality near-wall meshes are very difficult to fulfill using LES or DNS methods, particularly in highly demanding grids near deep-scoured beds. Additionally, although many numerical studies of local scour around piles are found in the literature, sediment scour models are mainly based on empirical equations, which barely describe the interactions between flow turbulence and sediment particles in theoretical calculations. Therefore, a numerical model setup using an experimental topography of local scour and modeling the flow turbulence around the pile is probably effective for studying the flow features near the pile in a developing scour hole.
Because experimental and numerical methods have ad-vantages and disadvantages, combining the two can be beneficial for investigating local scour processes and flow fields around piles in flat and scoured beds. The present study focuses on local scour around two widely used piles (CCPs and SCPs) in submerged conditions and uses experimental morphology data. Numerical simulations are then performed using the open-source field operation and manipulation (OpenFOAM) software. An improved delayed detached eddy simulation (IDDES) model can obtain enough accuracy and maintain a relatively low computational expense compared to the LES model. Moreover, it can allow more room on the grid spacing on the bed wall. Therefore, the IDDES turbulent model, based on the SST k-ω closure equations and capable of simulating adverse pressure gradients, the separation flow, and bed shear stress (Bordbar et al., 2021), is employed to study flow field characteristics during flat bed, initial, and equilibrium local scouring stages.
2 Methods 2.1 Experimental TestsExperimental tests were conducted in a 60-m long, 1.2-m wide, and 1.5-m deep flume at the Hydraulic Modeling Laboratory at Shandong Jiaotong University, China. A circular pile model and square pile model, both 10 cm × 10 cm × 30 cm in size, were embedded in a 20-cm high sand bed. Nonuniform sand was used in the experiments. Notably, tests C (circular pile) and S (square pile) were adopted from Du et al. (2023) and Du et al. (2022a), respectively. Medium grain size d50 and sediment nonuniformity σ = (d85 /d15)0.5 were 0.18 mm and 1.6, respectively. Moreover, bed shear stress (τ0) induced by the skin friction and the threshold bed shear stress (τcr) can be expressed as shown in Eqs. (1) and (2), respectively. The flow intensity (K) calculated using Eq. (3) according to Melville (1997) was 1.03. The Reynolds numbers based on the diameters of the circular and square piles are both 2.58 × 10⁴, and the main parameters of the two experimen-tal tests are listed in Table 1. More detailed descriptions of the experimental setup, measurements of the flow velocity, and bed elevation profile data are found in Du et al. (2022a).
| $ \begin{equation} \tau_0=\rho C_D U^2 \end{equation} , $ | (1) |
| $ \begin{equation} \tau_{\mathrm{cr}}=\frac{\theta_{\mathrm{cr}}}{\left(\rho_{\mathrm{s}}-\rho\right) g d_{50}} \end{equation} , $ | (2) |
| $ \begin{equation} K=\frac{U-\left(0.8 U_{\mathrm{ca}}-U_{\mathrm{c}}\right)}{U_{\mathrm{c}}} \end{equation} , $ | (3) |
|
|
Table 1 Experimental parameters |
where ρs = 2650 kg m−3 and ρ = 1000 kg m−3 are the sediment density and water density, respectively;
An IDDES turbulent model based on the SST k-ω model is used to simulate the flow around piles under different scoured conditions in this study. DES provides a hybrid RANS/LES approach in which a RANS model is implemented for the near-wall region, and the LES model is applied for the resolution of unsteady eddies away from the wall. The hybrid model strikes a great balance between computational accuracy and computational efficiency, providing the accuracy of LES with adequate grid resolution and allowing more room on the computational grid partition and time step.
For three-dimensional incompressible Newtonian fluids, continuity and momentum equations are expressed as follows:
| $ \begin{equation} \nabla \cdot \overline{\boldsymbol{u}}=0, \end{equation}, $ | (4) |
| $ \begin{equation} \frac{\partial \overline{\boldsymbol{u}}}{\partial t}+\nabla \cdot(\overline{\boldsymbol{u}} \overline{\boldsymbol{u}})=-\frac{1}{\rho} \nabla p+v \nabla^2 \overline{\boldsymbol{u}}+\nabla \cdot \tau_{\text {turb }} \end{equation}, $ | (5) |
where u is the three velocity components in a Cartesian coordinate system, ρ is the fluid density, p is the fluid pressure, ν is the kinematic viscosity, and τturb is the hybrid turbulent stress tensor calculated using the Reynolds stress tensor and the subgrid scale stress tensor used in the RANS and LES models, respectively. The stress tensor is defined in Eqs. (6) and (7) as follows:
| $ \begin{equation} \tau_{\text {turb }}=2 v_{\mathrm{T}} \overline{\boldsymbol{D}}^R-\frac{2 k}{3} \boldsymbol{I}, \end{equation}, $ | (6) |
| $ \begin{equation} \overline{\boldsymbol{D}}=\frac{1}{2}\left[\nabla(\overline{\boldsymbol{u}})+\nabla(\overline{\boldsymbol{u}})^{\mathrm{T}}\right], \end{equation} $ | (7) |
where k is the turbulent kinetic energy, νT is the turbulent viscosity, D is the symmetric part of the velocity gradient tensor, and I is the unit tensor. The k-ω SST IDDES method is composed of the DDES model and the wall-modeled LES (WMLES) model. The SST k-ω turbulence closure model is used to solve for the Reynolds stress terms in the Navier-Stokes equations. The transport equations for the turbulent kinetic energy k and the specific dissipation rate ω are, respectively:
| $ \frac{{\partial k}}{{\partial t}} + \nabla \cdot (\bar uk) = \nabla \cdot \left[ {(\nu + {\sigma _k}{\nu _{\text{T}}})\nabla k} \right] + {P_k} -\frac{{{k^{1.5}}}}{{{L_{{\text{IDDES}}}}}}, $ | (8) |
| $ \begin{equation} \begin{aligned} \frac{\partial \omega}{\partial t}+\nabla \cdot(\bar{u} \omega)= & \nabla \cdot\left[\left(v+\sigma_\omega v_{\mathrm{T}}\right) \nabla \omega\right]+ \\ & \frac{\gamma}{v_{\mathrm{T}}} P_k-\beta \omega^2+2\left(1-F_1\right) \frac{\sigma_{\omega 2}}{\omega} \nabla k: \nabla \omega, \end{aligned} \end{equation} $ | (9) |
| $ \begin{equation} \left\{\begin{array}{l} P_k=\min \left(G, 10 \beta^* k \omega\right) \\ G=v_{\mathrm{T}}\left[\nabla(\overline{\boldsymbol{u}})+\nabla(\overline{\boldsymbol{u}})^{\mathrm{T}}-\frac{2}{3}(\nabla \cdot \overline{\boldsymbol{u}}) \boldsymbol{I}\right]: \nabla \overline{\boldsymbol{u}} \\ v_{\mathrm{T}}=\frac{a_1 k}{\max \left(a_1 \omega, S F_2\right)} \end{array}\right. \end{equation}, $ | (10) |
where k is the turbulent kinetic energy, ω is the specific dissipation rate, LIDDES is the IDDES length scale, ν is the kinematic viscosity, νT is the kinematic eddy viscosity, Pk is the production term of k, G is a function as presented, S is the mean rate of strain of the flow, β* = 0.09, a1 = 0.31, and F1 and F2 are blending functions.
The values of σk, σω, β, and γ in Eqs. (8) and (9) are obtained from the following equation:
| $ \begin{equation} \left(\sigma_k \sigma_\omega \beta \gamma\right)^{\mathrm{T}}=F_1\left(\sigma_k \sigma_\omega \beta \gamma\right)_1^{\mathrm{T}}+\left(1-F_1\right)\left(\sigma_k \sigma_\omega \beta \gamma\right)_2^{\mathrm{T}}, \end{equation} $ | (11) |
in which σk1 = 0.85, σω1 = 0.5, β1 = 0.075, and γ1 = 0.5556 are the model constants for the inner wall region, and σk2 = 1.0, σω2 = 0.856, β2 = 0.0828, and γ2 = 0.44 are the model constants for the outer wall region.
The functions F1 and F2 are written as in Eq. (12), respectively.
| $ \begin{equation} \left\{\begin{array}{l} F_1=\tanh \left(\arg _1^4\right) \\ F_2=\tanh \left(\arg _2^2\right) \\ \arg _1=\min \left[\max \left\{\frac{\sqrt{k}}{\beta^* \omega y}, \frac{500 v}{\omega y^2}\right\}, \frac{4 \sigma_{\omega 2} k}{C D_\omega y^2}\right] \\ \arg _2=\max \left\{\frac{2 \sqrt{k}}{\beta^* \omega y}, \frac{500 v}{\omega y^2}\right\} \\ C D_\omega=\max \left[\frac{2 \sigma_{\omega 2}}{\omega}(\nabla k \cdot \nabla \omega), 10^{-10} \mathrm{~s}^{-2}\right] \end{array} .\right. \end{equation} $ | (12) |
The IDDES length scale LIDDES is defined as follows:
| $ \begin{equation} \left\{\begin{array}{l} L_{\mathrm{IDDES}}=\tilde{f}_{\mathrm{d}}\left(1+f_{\mathrm{e}}\right) L_{\mathrm{RANS}}+\left(1-\tilde{f}_{\mathrm{d}}\right) L_{\mathrm{LES}} \\ L_{\mathrm{RANS}}=\frac{k^{0.5}}{\beta^* \omega} \\ L_{\mathrm{LES}}=\left[C_{\mathrm{DES} 1} F_1+C_{\mathrm{DES} 2}\left(1-F_1\right)\right] \Delta \\ \Delta=\min \left[\max \left(c_w \Delta_{\max }, c_w d, \Delta_{\min }\right), \Delta_{\max }\right] \end{array}, \right. \end{equation} $ | (13) |
where cw is an empirical constant whose value is set equal to 0.15. Δmin is taken as min (Δx, Δy, Δz), Δmax is defined as max (Δx, Δy, Δz), and d is the distance to the nearest wall. CDES1 and CDES2 are relevant empirical constants, and their values are set equal to 0.78 and 0.61, respectively. fd and fe are the empirical blending function and elevating function, respectively. The function fd is defined as max(1−fdt, fB). The IDDES length scale is converted into the DDES length scale when fe = 0, while IDDES behaves in WMLES mode in the wall region when fe is greater than 0 with fdt = fB.
2.2.2 Numerical methodsNumerical simulations were performed using Open-FOAM software. Specifically, pisoFoam, a standard solver provided by OpenFOAM, was selected to solve the unsteady three-dimensional incompressible Navier-Stokes equations. To address the pressure-velocity coupling issue on a collocated grid system in the context of the finite volume method, the time-accurate pressure implicit with splitting of operators algorithm was employed. The Gauss upwind scheme, discretizing the convection term of the momentum equation, was chosen to discretize the convection terms of the k and ω equations. The diffusion and pressure gradient terms were discretized using the Gauss linear scheme. The Euler implicit scheme was chosen to discretize the time term. The nonorthogonal correction algorithm was introduced to correct the effect of diffusion flux from the nonorthogonality of the mesh.
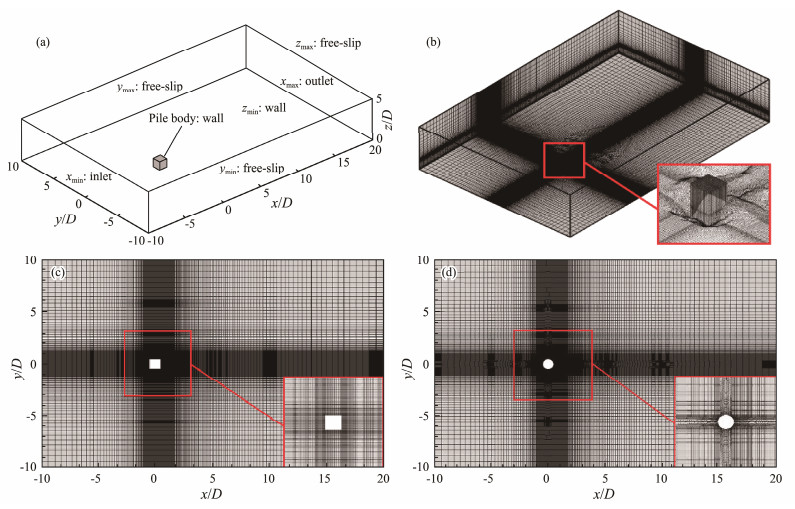
2.2.3 Test configurationAs illustrated in Fig.1(a), a finite pile body (a CCP or SCPs) with a width of D = 0.1 m and a height of h = 0.1 m is vertically mounted on a settled bed surface. The dimensions Lx, Ly, and Lz along the three-dimensional computational domain's X (streamwise), Y (transverse), and Z (spanwise) directions are 30D, 20D, and 5D, respectively. Importantly, heights of the pile body and computational domain (i.e., h and Lz) change under scoured-bed conditions. For example, a finite square pile with the scoured bed under the equilibrium scouring stage is found in Fig.1(b). The details of the scoured bed are described in Section 3.1. The pile body mounted on the bottom wall is placed centrally at the origin of the Cartesian coordinate system. According to the research result reported by Behr et al. (1995), the distance between the pile body and the two lateral boundaries is set to 10D. Meanwhile, to obtain a stabilized inflow and ensure a fully developed wake, inlet and outlet boundaries are situated 10D upstream and 20D downstream of the pile body, respectively.
|
Fig. 1 Schematic of the computational domain and employed grid partition. (a), boundaries of the computational domain; (b), example of the grid in the square pile region under the equilibrium scouring stage; (c), computational grid of the square pile from a top-down viewpoint; (d), computational grid of the circular pile from a top-down viewpoint. |
The boundary conditions of the computational domain are also illustrated in Fig.1(a). The inlet is on the left, and the outlet is on the right. No-slip boundary conditions are applied to the pile body wall and the bottom wall, and free-slip conditions are applied to the top and lateral boundaries. On both walls, the bottom and surface of the pile, wall functions are activated for k and ω according to the SST k-ω turbulence model. A continuous wall function based on Spalding's law and switching between low and high Reynolds numbers is adopted for the turbulent viscosity. Hence, the dimensionless wall distance y+ should be within [1, 300]. In addition, a rough wall function is employed for the bottom wall to obtain the flow around the rough bed surface. The four types of boundary conditions are as follows:
1) Inlet: A fixed uniform velocity (i.e., u= (ux, 0, 0)) is used for the velocity field, and a zero-gradient condition (i.e., ∂pI /∂n = 0) is prescribed for the pressure field. Moreover, the homogeneous Dirichlet condition is imposed for the turbulent energy k and the specific turbulent dissipation rate ω:
| $ \begin{equation} k=\frac{3}{2}\left(U_I \cdot I_u\right)^2, \omega=\frac{\rho k}{\mu}\left(\frac{\mu_{\mathrm{T}}}{\mu}\right)^{-1} . \end{equation} $ | (14) |
Here, UI = ux is the spatial averaging of
2) Outlet: Convective outflow condition is adopted for the velocity field, and the zero pressure condition (p = 0) is used for the pressure field. Moreover, the zero-gradient condition is prescribed for the turbulent energy k and the specific turbulent dissipation rate ω.
3) Bottom and pile body wall: For the velocity field, a no-slip impermeable boundary condition (i.e., u= (0, 0, 0)) is employed. For the pressure field, the zero-gradient condition is imposed. Furthermore, for the turbulent energy k and the specific turbulent dissipation rate ω, the wall functions are used.
4) Top and lateral boundaries of the computational domain: A free-slip condition is adopted, meaning that the velocity component normal to the boundary is set to zero (
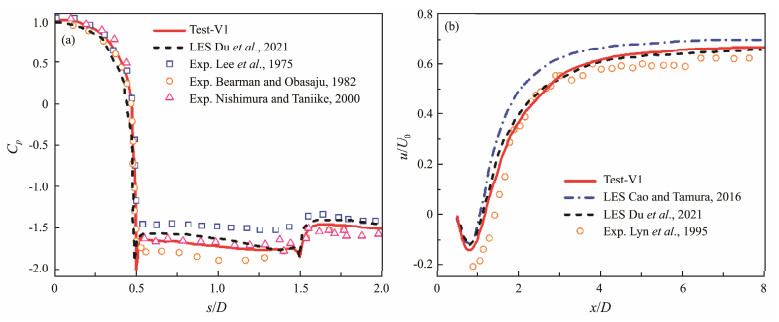
The flow over an infinite square cylinder (i.e., a spanwise homogeneous square cylinder) has been studied extensively over the past decades. Examples are listed in Table 2. This large amount of quality data provides a good benchmark for the initial validation in the present paper. Experimental results (Lee, 1975; Bearman and Obasaju, 1982; Norberg, 1993; Luo et al., 1994; Lyn et al., 1995; Nishimura and Taniike, 2000) and numerical results (Minguez et al., 2011; Trias et al., 2015; Cao and Tamura, 2016; Chen et al., 2020; Du et al., 2021) are compared with the results obtained from the present model.
|
|
Table 2 Computational domain parameters in the present test and in the literature for an SCP |
The layout and mesh of the computational domain at the square cylinder spanwise mid-plane of Test-V1 are sim-ilar to those in Fig.1. However, the boundary conditions of the bottom and top are replaced by free-slip conditions. The size of the three-dimensional computational domain (Lx × Ly × Lz) and grid configuration for the computational domain (defined by the grid resolution) for all numerical tests are listed in Table 2. The minimum grid size in the directions normal to the square cylinder is 0.01D, ensuring that the maximum y+ values near the cylinder are approximately 1. A time step (∆t = 5 × 10⁻⁴ s) is adopted for the grid resolution to ensure that the maximum Courant-Friedrichs-Lewy (CFL) number in Test-V1 is under 0.5. The computed mean drag coefficient Cd and Strouhal numbers St, defined by Eqs. (15) and (16), respectively, are extremely similar to the literature results. Table 2 shows that, except for Du et al. (2021), the values of Cd in the present test and in the literature from numerical simulations are slightly smaller than those from experimental tests. This result might be due to inaccurate measurements in experiments, different numerical discretization schemes, or the grid resolutions in numerical models. However, under the limitations of current computational and turbulence theory conditions, these numerical results are acceptable. Specifically, the proportional errors associated with Cd and St in the present model are only 2.8% and 0.8%, re-spectively, compared to the DNS model in Trias et al. (2015).
| $ \begin{equation} C_d=\frac{2 F_D}{\rho D h U_0^2} \end{equation}, $ | (15) |
| $ \begin{equation} S t=\frac{f_t D}{U} \end{equation}, $ | (16) |
where FD is the drag force in the x direction, U0 represents the free stream velocity, and ft represents the vortex-shedding frequency.
To ensure that the present model can simulate the turbulent flow fields around a square pile, the time-and spanwise-averaged surface pressure coefficient (Cp) and x component of the velocity (u/U0) are compared with the literature results. As depicted in Figs.2(a) and (b), overall, the computed results agree well with the experimental and numerical literature results.
|
Fig. 2 Profiles of the time-and spanwise-averaged flow characteristics of the square pile. (a) pressure coefficient on the surfaces of the square cylinder; (b) x component of the velocity in the centerline behind the square cylinder. |
In the previous section, through comparison with previous results for flow over an infinite square cylinder, the model was preliminarily verified. In this section, we will discuss flow over a finite circular cylinder with different grid configurations and time steps. This discussion can validate our model in more detail. Additionally, a basis mesh strategy is obtained for simulations of piles under a scoured bed by conducting a mesh sensitivity study.
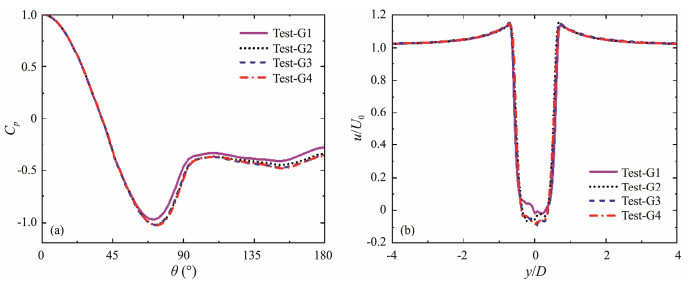
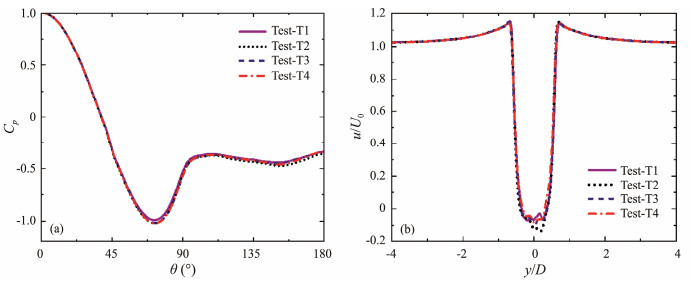
The layout and mesh of the computational domain for the circular cylinder are consistent with those in Fig.1. Hence, in all tests, the size of the computational domain (Lx × Ly × Lz) is (30D, 20D, 5D) and the pile-height-to-width ratio (h/D) is 1.0. Meanwhile, the minimum grid size in the directions normal to the pile body wall and the bottom wall is 0.01D. This attribute ensures that the max-imum y+ values near the pile body wall and the bottom wall boundary are between 1 and 300. To perform a grid convergence study, various grid configurations for the computational domain (e.g., the grid resolution) and the circular cylinder (defined as Nx × Ny × Nz) are tested, as seen in Test-G1-Test-G4 in Table 3. The total number of cells (Nt) for each case is also listed in Table 3. To improve the temporal accuracy and numerical stability, the maximum CFL number in Test-G1-Test-G4 is under 0.4. In addition, the maximum CFL numbers are controlled from 0.2 to 0.8 in Test-T1-Test-T4 to conduct a time con-vergence study.
|
|
Table 3 Computational domain parameters in the present test and in the literature for a CCP |
The mean drag coefficients (Cd) for all tests are also listed in Table 3 to gain grid independence and time convergence. Moreover, time-averaged pressure coefficients and the x component of the velocity are discussed with different mesh configurations and CFL numbers in Figs.3 and 4. Cd values in Test-G1 to Test-T4 roughly converge to 0.594 in Test-G3 and Test-T3, and time-average pressure coefficients and the x component of the velocity in Test-G1 to Test-T4 converge on the configurations of Test-G3 and Test-T3. In addition, Cd is 0.594 in Test-G3 and Test-T3, differing slightly from previous experimental results (Kawamura et al., 1984; Beitel et al., 2019). The maximum percentage error in the model is only 2.2% compared to these experimental tests. Therefore, the mesh size and related parameters of Test-G3 are adopted for the following simulation.
|
Fig. 3 Distributions of time-averaged flow characteristics of the circular cylinder from Test-G1 to Test-G4. (a) pressure coefficients on the surface of the circular cylinder on the z/D = 0.5 plane; (b) x velocity on the straight line of x/D = 1.0 and z/D = 0.5 behind the circular cylinder. |
|
Fig. 4 Distributions of time-averaged flow characteristics of the circular cylinder from Test-T1 to Test-T4. (a) pressure coefficients on the surface of the circular cylinder on the z/D = 0.5 plane; (b) x component of the velocity on the straight line (x/D = 1.0 and z/D = 0.5) behind the circular cylinder. |
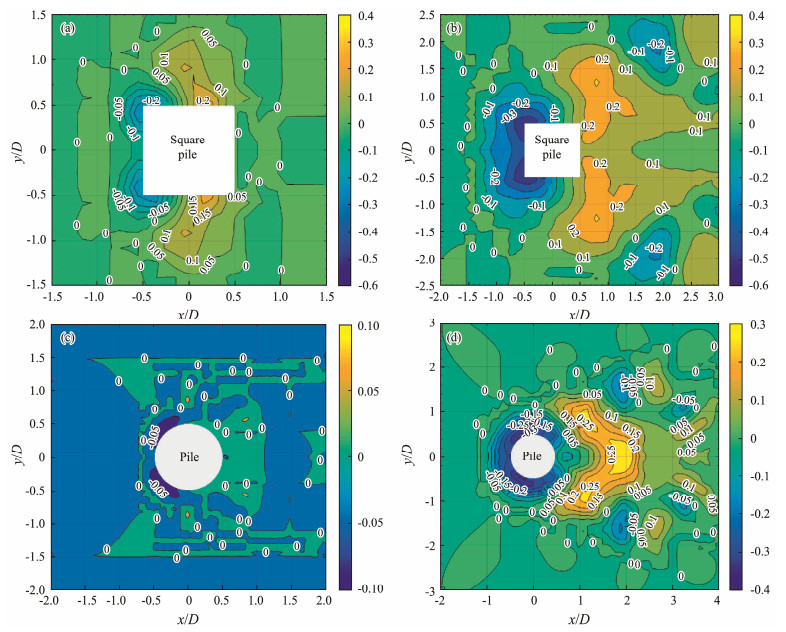
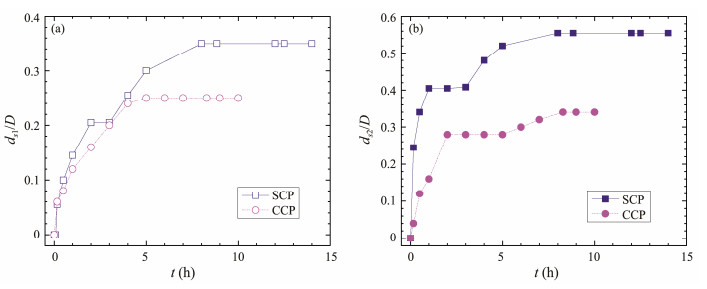
The contours of the bed elevations around a square-crossing pile (SCP) and a circular-crossing pile (CCP) were obtained from experimental tests, as shown in Fig.5. The bed elevations were measured at 10 min (Fig.5(a)) and 840 min (Fig.5(b)) around the SCP test and 10 min (Fig.5(c)) and 600 min (Fig.5(d)) around the CCP test. Comparing the characteristics of the local scour between the SCP and CCP, in Figs.5(a) and (c), respectively, for example, reveals that the sizes of the scour holes, the local scour depth, and the sand deposit in the SCP test were individually much larger than those in the CCP test. To quantify the initial, developing, and equilibrium scouring stages, temporal scour depths at the stagnation point (x/D = −0.5, y/D = 0) and pile upstream corners (x/D = −0.5, y/D = ±0.5) are presented in Figs.6(a) and (b), respectively. Local scour-ing is initiated at pile corners. The scour depth increases quite sharply in the first few minutes. Then, the rate of increase of the scour depth gradually decreases as the scour depth increases. Ultimately, the scour depth at the stagnation point maintains a constant value of 0.35D at t = 8 h under the SCP condition or 0.25D at t = 5 h in the CCP condition. However, the scouring duration required to achi-eve a constant scour depth value at the upstream corners was approximately 8 h under the CCP condition. Therefore, the minimum scouring durations needed for the equilibrium stages of the two piles were 8 h. Following the three scouring stages defined by Dargahi (1990), a flat bed with- out scouring at t = 0 and a scoured bed at t = 10 min are selected to represent the flat bed and initial scouring stage, respectively, under the SCP and CCP conditions. The topographies at 14 h and 10 h are selected as representative of the equilibrium scoured bed for the SCP and CCP cases, respectively.
|
Fig. 5 Topographies of square-and circular-crossing piles at the initial and equilibrium scouring stages (adopted from Du et al.(2022a, 2023)). (a) Contours at 10 min and (b) 840 min for the SCP; (c) Contours at 10 min and (d) 600 min for the CCP. |
|
Fig. 6 Temporal scour depth of the square-and circular-crossing piles. (a) at the stagnation point (x/D = −0.5, y/D = 0); (b) at the pile upstream corners (x/D = −0.5, y/D = ±0.5). |
Based on the experimental results above, numerical tests simulating the flow fields of the flat bed, the initial stage, and the equilibrium scouring stage were conducted using topographies at scouring durations of 0 min, 10 min, and 840 min for the SCP case and 0 min, 10 min, and 600 min for the CCP case. For the convenience of the following analysis and discussion, Test-S1, Test-S2, and Test-S3 represent 0 min, 10 min, and 840 min for the SCP case, respectively, while Test-C1, Test-C2, and Test-C3 represent 0 min, 10 min, and 600 min for the CCP case, respectively. The computational mesh was generated using the basic mesh control parameters described in Sections 2.2 and 2.3. The mesh topologies near the obstacle and bottom in this study were updated using snappyHexMesh (a high-quality mesh generation utility in OpenFOAM), which generated meshes containing hexahedra and split hexahedra from the triangulated surface geometry for the scour topographies in stereolithography format. The total number of cells for all tests was approximately 3.24 × 10⁶. The maximum y+ values near the bottom wall and the pile wall for all tests were between 1 and 300.
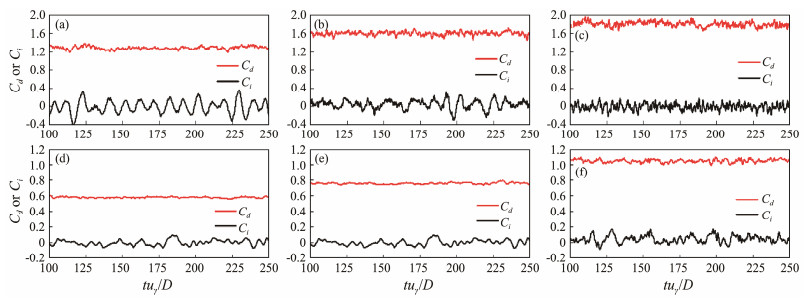
3.2 Drag and Lift Coefficients on PilesFig.7 presents the histories of the drag and lift coefficients (Cd and Cl, respectively) of the square-and CCPs in dimensionless time tu∞ /D after reaching a quasi-steady state under different scoured-bed conditions. Using IDDES, the drag and lift coefficients of piles exhibit tangible pulsation characteristics, and the pulsation characteristics of the SCP and CCP caused by the more complex turbulence flow become more pronounced with developing bed elevations. In contrast to the CCP, the more intense pulsations of drag and lift force in the SCP can be discovered. In addition, the pulsation amplitudes of SCP lift coefficients clearly decrease, while an opposite trend is observed in the pulsation amplitudes of CCP lift coefficients.
|
Fig. 7 Time histories of the drag and lift coefficient of the square-and circular-crossing piles under different scoured-bed conditions. (a), Test-S1; (b), Test-S2; (c), Test-S3; (d), Test-C1; (e), Test-C2; (f), Test-C3. |
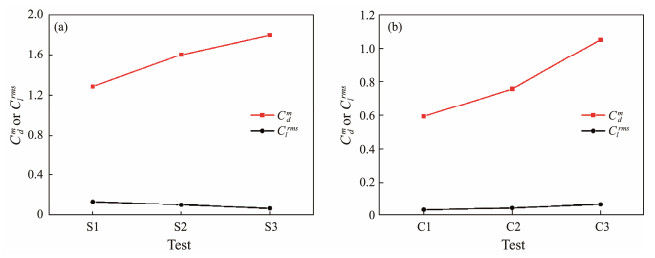
The time-averaged drag coefficient (Cdm) and root mean square (rms) of the lift coefficient (Clrms) for the SCP and CCP tests are shown in Figs.8(a) and (b), respectively. From the flat bed stage to the equilibrium scouring stage, Cd increases linearly from 1.289 to 1.796 for the SCP tests and increases from 0.594 to 1.051 for the CCP tests. Because the flow depth in front of the pile increased with
|
Fig. 8 Time-averaged drag coefficient and the rms of the lift coefficient of the square-and circular-crossing piles under different scoured-bed conditions. (a), SCP; (b), CCP. |
the scouring duration when the scour depth was developing, the increase in Cd in the SCP or CCP tests indicates that the total drag force on the piles increases with flow depth. Moreover, in contrast to the CCP case, the larger values of Cd in the three stages of the SCP tests illustrate the larger resistance to flow under the SCP condition. The variation law of Clrms of CCP tests has the same trend as that of Cd. However, it can be diversely found on the Clrms of SCP tests. The values of Clrms are 0.034, 0.044, and 0.067 for Test-C1, Test-C2, and Test-C3, respectively, and 0.138, 0.107, and 0.070 for Test-S1, Test-S2, and Test-S3, respectively. The reversible changes in Clrms are due to the vortex-shedding modes caused by different alluvial geomorphologies and pile shapes. The sand dunes generated by sediment accumulations emerge on the back side of the SCP during the initial scouring stage and equilibrium scouring stage (Figs.5(a), (b)), while the sediment accumulation areas of the CCP are located downstream of the piles (Figs.5(c), (d)). Thus, the sand dunes inhibit the shear layer separation and vortex shedding on both sides of the SCP corner near the bed, and the Cl and Clrms of SCP tests subsequently diminish. In contrast, the growing upward flow induced by the gradually increased sediment accumulation areas downstream of the CCP (Fig.11(f)) enhances the vortex shedding that leads to larger values of Cl and Clrms in CCP tests (Hu, 2019). However, the values of Clrms in the three stages of SCP tests are individually larger than those in the CCP case. These results reveal that the sharp-shaped SCP induces larger Clrms than the arc-shaped CCP in submerged conditions. This finding accords with the unsubmerged cases of Alemi et al. (2019) and Du et al. (2021), who studied flat bed conditions only. Therefore, the SCP is more vulnerable to being affected by turbulent flow than the CCP in a flat bed or a scoured bed, explaining the stronger local scour around the SCP.
|
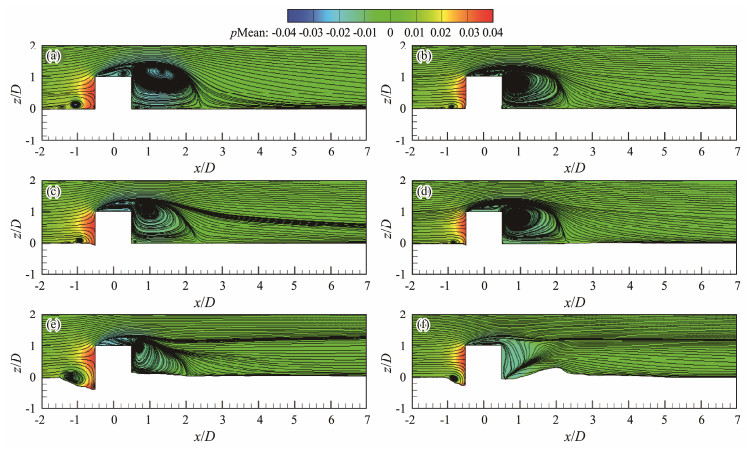
Fig. 11 Time-averaged streamlines and pressure contours of the square-and circular-crossing piles on the symmetry plane under different scoured-bed conditions. (a), Test-S1; (b), Test-C1; (c), Test-S2; (d), Test-C2; (e), Test-S3; (f), Test-C3. |
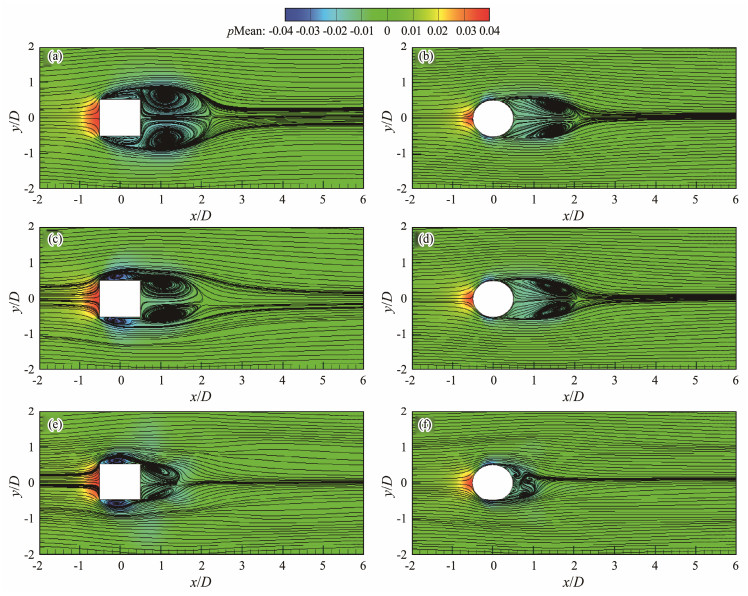
In this section, the flow features of the pressure fields in flat and scoured beds are studied. The time-averaged traced streamlines and pressure distributions along the approximately mid-height plane (i.e., z/D = 0.5) are displayed in Figs.9 and 10, respectively. As expected, Fig.9 demonstrates that in the z/D = 0.5 plane, strong positive and negative pressure regions are generated upstream and downstream of the pile, respectively, while an intense negative pressure region is found on both sides of the pile. The flat bed tests of Figs.9(a) and (b) show that the positive/negative pressure regions around the SCP are stronger and have a larger area than those around the CCP, which is due to the larger flow acceleration with the streamline closure at the corners of the SCP. A similar topology is found in all tests, with two symmetrically distributed strong and wide-reaching spirals downstream of the piles. However, a pair of symmetrically distributed spiral nodes on both sides of the SCP can be found when no spiral centers are situated around the CCP, consistent with the distinction in Zhang et al. (2017). There are also some differences between the vortex scale and the position behind piles in SCP and CCP tests. According to Hu (2019), the distinctions in the location of boundary layer separation around SCP and CCP tests are the main reasons for the differences in flow structures. The boundary layer flow undergoes a forced separation at the corners of the SCP due to the influence of the sharp angles, leading to more complex flow behaviors around the lateral sides of the SCP and stronger wake structures downstream of the SCP. Moreover, with the development of scouring, the wake structures behind the piles are considerably weakened, and the influential zones in the wake are greatly reduced, particularly in Test-C3. Meanwhile, the spiral centers on both sides of the SCP move to the front side of the pile (Figs.9(a), (c), and (e)), where the scour holes are also concentrated (Figs.5(a) and (b)). Interestingly, the symmetry of the wake structure in Test-C3 is broken by the presence of a sediment deposit behind the pile (as seen in Fig.5(d) and discussed in the following paragraph based on Fig.11(f)). The sediment deposit inhibits the development of the wake and exacerbates the disorder of flow within the wake region. Furthermore, the various flow structures of SCP and CCP tests illustrate the discrepancies between the extent of local scour impacts around the SCP and CCP, particularly in Figs.5(a) and (c) and Figs.9(a) and (b).
|
Fig. 9 Time-averaged streamlines and pressure contours of the square-and circular-crossing piles on the z/D = 0.5 plane under different scoured-bed conditions. (a), Test-S1; (b), Test-C1; (c), Test-S2; (d), Test-C2; (e), Test-S3; and (f), Test-C3. |
|
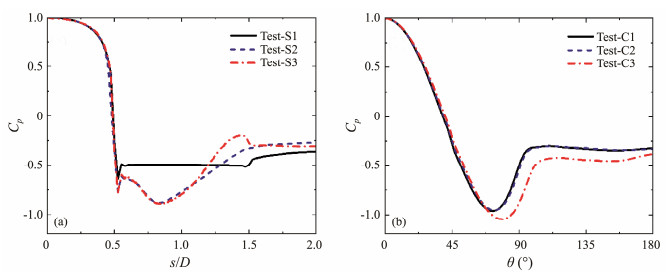
Fig. 10 Time-averaged pressure coefficients along the circumference of the square-and circular-crossing piles at z/D = 0.5 under different scoured-bed conditions. (a), SCP; (b), CCP. |
The time-averaged pressure curves around the SCP and CCP tests on the plane of z/D = 0.5, corresponding to Fig.9, are shown in Figs.10(a) and (b). The few pressure coefficients of SCP tests on the z/D = 0.5 plane are always roughly located at s/D = 0.5, while the values of the angle corresponding to the minimum pressure coefficient of CCP tests are 72.5˚ in Test-C1, 73.5˚ in Test-C2, and 79.5˚ in Test-C3. The above findings illustrate that the boundary layer separating points of the CCP move backwards, but a forced separation can always be found at the corners of the SCP. Meanwhile, in contrast to the flat bed test (Test-S1), a substantial fluctuation in the values of SCP tests in the initial and equilibrium scouring stages (Test-S2 and Test-S3) is detected at 0.5 ≤ s/D ≤ 2.0. The forward movement of the spiral centers on both sides of the SCP in Figs.9(a), (c), and (e) is the main cause of the greater negative pressure zones located on the front side of the SCP, and weaker wake areas lead to less negative pressure zones downstream of the SCP. In contrast, the pressure curves of CCP tests are very comparable but shifted backward because of the delay in the flow separation in CCP tests. The downward shift of the pressure curve of Test-C3 can be discovered with more complex flows on the back side of the CCP. A lower pressure value corresponds to a larger flow velocity. Thus, the flow acceleration at the pile sides, as in the contracted streamlines shown in Fig.9, is considered the main cause of local scour.
The horseshoe vortex plays an important role in all stages of the scour process (Dargahi, 1990; Kirkil and Constantinescu, 2009, 2010; Guan et al., 2019). Hence, the horse-shoe vortex system should be clarified. The results of the flat bed and the initial and equilibrium scouring stages are individually displayed in Figs.11(a), (c), and (d) for the SCP and Figs.11(b), (e), and (f) for the CCP. Comparing the horseshoe vortex system reveals that the strength of horseshoe vortices first weakens in the initial scouring stage (Test-S2 in Fig.11(c) and Test-C2 in Fig.11(d)) and then increases during the equilibrium scouring stage (Test-S3 in Fig.11(e) and Test-C3 in Fig.11(f)). For the SCP and CCP tests in the flat bed and initial scouring stages, the horseshoe vortex systems comprise two inter-connected vortices in the form of a main and a small vortex, which evolve into a larger main vortex during the equilibrium scouring stage. Meanwhile, a small anti-clockwise junction vortex is observed at the bottom of the scour hole in Fig.11(f), which is also reported by Guan et al. (2019) and accounts for the presence of leveling areas in pre-pile scour pits.
In the flat bed condition, a strong downflow induced by the blockage of the pile nose is formed upstream of the pile in each figure. Because of the adverse pressure gradient, a reverse flow and horse vortex are formed, as seen at −1.5 ≤ x/D ≤ −0.5 and −1.0 ≤ x/D ≤ −0.5 in Figs.11(a) and (b), respectively. Because the CCP is more streamlined than the SCP, a smaller bulk of water from the incoming flow is blocked by the pile, as seen in Fig.11. Thus, the size and strength of the horseshoe vortex in the SCP tests are individually much larger than those in the CCP tests. These phenomena are even obvious in the equilibrium scouring stage, as seen in Figs.11(e) and (f), and much larger sizes of the horseshoe vortex and scour hole are found in Fig.11(e). However, in the initial scouring stage, the strength and size of the horseshoe vortex upstream of the SCP are diminished because of the small scour hole in Figs.5(a) and 11(c), while they vary slightly in the CCP under nearly non-sediment scour in the symmetry line in Figs.5(c) and 11(d). These results differ from those of Guan et al. (2019), who found that the size and strength of the main horseshoe vortex increased with scour depth. Aside from the submerged conditions (i.e., upward flow instead of the adverse bow upstream of the pile) in this paper, another reason for this difference is that the downflow is blocked by the small scour hole slope when the adverse pressure gradient is driving the downflow water to form a reverse flow, as seen in the range of −0.75 ≤ x/D ≤ −0.5 in Fig.11(c).
In contrast to an infinite pile (i.e., when the pile height is larger than the flow depth), the upward flow upstream of the pile in the submerged pile tests separates from the pile tip, forming a separation bubble and reverse flow over the pile top (see −0.75 ≤ x/D ≤ −0.5, 1.0 ≤ z/D ≤ 2.0 in Figs.11(a)-(f)). Because of the effect of the pressure difference, a downwash flow generated from the free end of the pile emerges that can reach the sand bed. These flow features are considered to have important effects on the wake vortex and thus affect the sediment transport behind the pile (Dargahi, 1990; Zhao et al., 2012; Alemi et al., 2019). Concurrently, one large clockwise vortex core induced by the downwash flow and located at the upper region appears in the symmetry plane, as seen in Fig.11(a), for example. Furthermore, in contrast to Test-S3 and Test-C3 in Figs.11(e) and (f), another small anti-clockwise vortex core generated by the backflow of the large clockwise vortex with the impact of the pile is found extremely near the fixed end of the pile and sand bed in Figs.11(a)-(d). However, the flow structures of Test-C3 in Fig.11(f) during the equilibrium scouring stage dramatically transform when the downwash flow behind the pile is replaced by an obvious upward flow. More specifically, the upward flow is generated by the combined actions of the scour hole slope behind the CCP (Fig.5(d)) and the wake vortices (Fig.9(f)). Moreover, the downwash flow weakens under the effect of the increasing scour depth. The disparate locations and heights of the scour accumulation zones at the equilibrium scouring stage in Figs.5(b) and (d) should be attributed to the size and strength of the large clockwise vortex. The stronger clockwise vortex in the SCP tests can carry sediment particles to the rear of the pile, causing a sediment accumulation zone behind the pile. However, although the scour hole has been induced by wake vortices, as seen in Figs.5(d) and 9(f), sediment particles cannot be stirred up and thus cannot be removed to the rear of the pile by the weak clockwise vortex farther from the pile in the symmetry plane in the CCP tests.
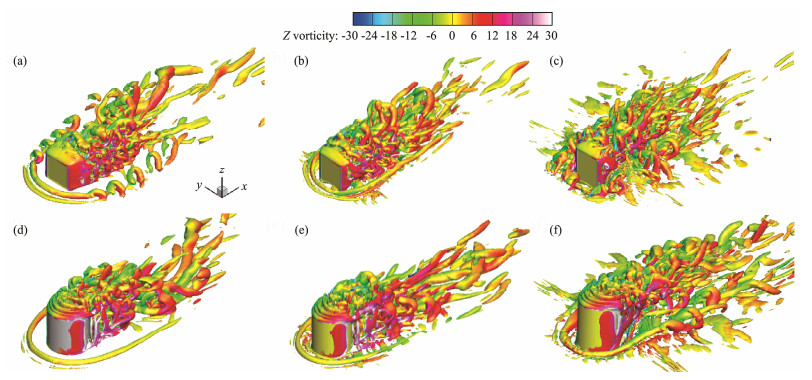
3.4 Instantaneous Vortex StructureIn this section, to study the flow structures around the SCP and CCP under flat bed and scoured-bed conditions, streamwise instantaneous vortices are discussed. Isosurfaces of the instantaneous vortex structure around the SCP and CCP tests at tu∞ /D = 250 based on the Q-criterion concept are provided in Fig.12, which is colored with the instantaneous spanwise vorticity contours between ωz = −30 and +30 with cutoff level ±6. Q is defined as −(||S||2 − ||Ω||2)/2, where S is the strain, and Ω is the rotation tensor. As discussed above, the incoming flow is blocked by the pile and then forms horseshoe vortices in front of the pile. The U-shaped horseshoe vortex systems each have two legs containing a main vortex and a secondary vortex and are streamwise-oriented (e.g., Fig.12(a)). In general, the secondary vortex lacks the strength to roll up the sediment particles. Scouring in front of the pile is mainly caused by the main horseshoe vortex. This causation is seen from the scouring process tests in Figs.5(a) and (b) and in literature such as Kirkil and Constantinescu (2010) and Guan et al. (2019). In the test of an infinite pile, boundary layers are separated on both sides of the pile face and cause von Kármán vortex shedding. However, in the submerged test of the present pile, the separated boundary layers are interrupted by vortices and downwash flow generated by the reverse flow over the top of the pile. Thus, the wake vor-tices are in a patch of segments, as seen in Figs.12(a)-(f).
|
Fig. 12 Isosurfaces of the instantaneous vortex structure around the square-and circular-crossing piles, identified using Q = 10 and colored with the instantaneous spanwise vorticity under different scoured-bed conditions. (a), Test-S1; (b), Test-S2; (c), Test-S3; (d), Test-C1; (e), Test-C2; (f), Test-C3. |
Moreover, with the development of local scour processing (i.e., the initial scouring stage in Figs.12(b) and (e) and the equilibrium scouring stage in Figs.12(c) and (f)), the two horseshoe vortices merge with one vortex upstream of each pile and become incoherent downstream because of the changed topography near the pile and the related interference from the separated shear layers on the pile side face and top surface. In the initial scouring stage (Figs.12(b) and (e)), the vortex tubes are dramatically deformed as they approach the scoured bed. When the scour hole and sediment deposit become larger and higher around each pile, the deformations are more substantial, as shown in Figs.12(c) and (f), respectively. However, because of the higher sand dunes behind the SCP (Figs.5(a) and (b)) and the thicker boundary layers on the two sides of the SCP face (Fig.9), the vortex tubes of the horseshoe vortex legs are more fragmented in the SCP test than in the CCP test. In particular, this difference is clearly seen in the equilibrium scouring stage. Nevertheless, the wake vortices of the SCP and CCP tests have a considerable difference. The strong vortex situated close to the rear of the pile of the CCP tests near the bed in Figs.12(d)-(f) causes sediment scour in Figs.5(c) and (d), while the vortex near the bed in the SCP tests is far from the rear of the pile in Figs.12(a)-(c) and results in sediment deposit behind the pile in Figs.5(a) and (b). Because of the weaker vortex downstream of the CCP tests described in Fig.11, the tip vortices behind the CCP tests are substantially elongated compared to those of the SCP tests, as seen in Figs.12(d)-(f). Moreover, the tip vortex is most elongated in Fig.12(f) because of the upward flow with the scour hole forms behind the pile.
To further understand the variations in shear layer separation and wake vortices, Figs.13, 14, and 15 display the contours of the spanwise component of the vorticity at tu∞/D = 250 on three spanwise planes, z/D = 0.05, 0.50, and 0.95, respectively. The horseshoe vortex system is clearly present near the bed (on the z/D = 0.05 plane), while the horseshoe vortex is disrupted by the disorganized vortex induced by the complex flow with the deep scour holes in Test-S3, as shown in Fig.13(c). Addition-ally, the separated shear layers near the sand bed in Test-S3 are forced toward the inner scour hole, complicating the flow. In contrast, separated shear layers in Test-C3 are concentrated on the tail side of the pile because of the high sand dunes on the back of the pile. Moreover, with the formation of flow structures in front of and behind the scour accumulation zones, the coherence of the flow structures in the wake is broken. On the z/D = 0.50 and z/D = 0.95 planes, the symmetric and elongated shear layers separating from the lateral sides of the pile in the near-wake region for both spanwise locations are clearly observable in all tests. The separated shear layers on both sides of the pile move outward and then orient streamwise in the near-wake. With the development of scouring, the forms of shear layer separation in SCP and CCP tests change from laminar to turbulent separation, narrowing the separation zones of the shear layers. However, a large difference exists in the forms of shear layer separation between the SCP and CCP with the different pile shapes. The separated shear layers further break up because of the impact of the pile wall in SCP tests but are shedding in the near-wake in CCP tests. Moreover, the locations of shear layer separation points shift back in CCP tests.
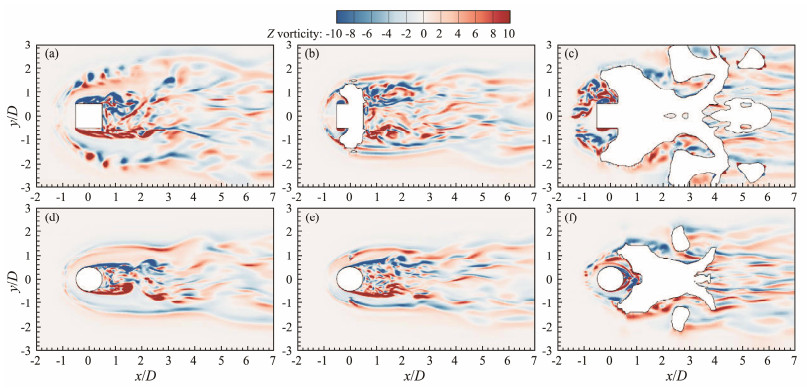
|
Fig. 13 Instantaneous spanwise vorticity contours of the square-and circular-crossing piles on the z/D = 0.05 plane under different scoured-bed conditions. (a) Test-S1; (b) Test-S2; (c) Test-S3; (d) Test-C1; (e) Test-C2; (f) Test-C3. |
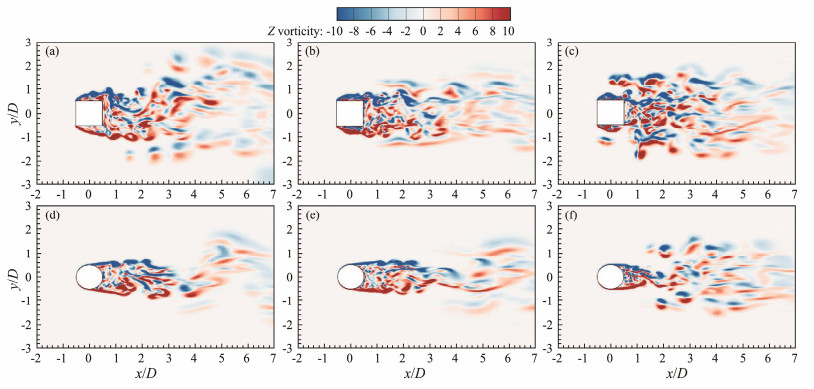
|
Fig. 14 Instantaneous spanwise vorticity contours of the square-and circular-crossing piles on the z/D = 0.50 plane under different scoured-bed conditions. (a), Test-S1; (b), Test-S2; (c), Test-S3; (d), Test-C1; (e), Test-C2; (f), Test-C3. |
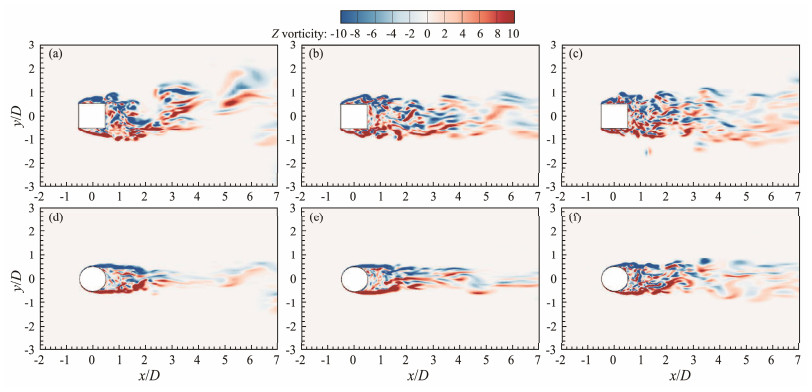
|
Fig. 15 Instantaneous spanwise vorticity contours of the square-and circular-crossing piles on the z/D = 0.95 plane under different scoured-bed conditions. (a), Test-S1; (b), Test-S2; (c), Test-S3; (d), Test-C1; (e), Test-C2; (f), Test-C3. |
The anti-symmetry of the wake vortex shedding, which is similar to a Kármán vortex street in an infinite pile test, evolves into the symmetry of the wake vortex shedding because of the effect of the vortices induced by the sand dunes clearly present in Figs.14(c)-(f). In addition, the width of wake areas in SCP and CCP tests has a certain discrepancy. Not many changes occur in wake width behind the SCP, although the wake vortex structures are further fragmented as the scour develops. However, the wake zones change considerably in CCP tests along the pile height. Figs.13(f), 14(f), and 15(f) demonstrate that the wake zones are reduced substantially near the fixed end of the pile, and more complex and wider wake areas are seen near the free end of the pile.
3.5 Bed Shear StressA sediment particle can be motivated to move when the bed shear stress is larger than the critical bed shear stress (i.e., the threshold value of the sediment particle motion). To this end, the distributions of the relative instantaneous near-bed shear stress at tu∞ /D = 250 and α = τ /τ∞ (where τ is the instantaneous bed shear stress, and τ∞ is the undisturbed bed shear stress at point (−5D, 0, 0)) are presented in Fig.16 for discussion.
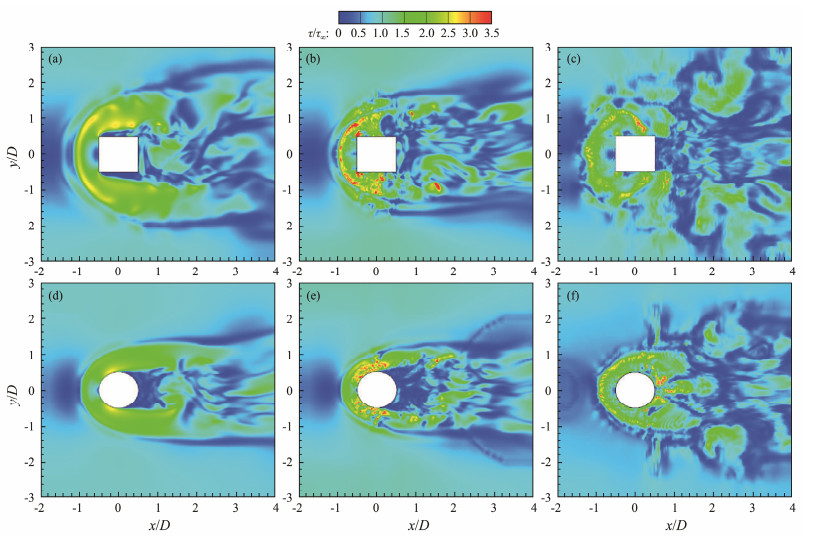
|
Fig. 16 Contours of the nondimensional instantaneous bed shear stress of the square-and circular-crossing piles on the bed under different scoured-bed conditions. (a), Test-S1; (b), Test-S2; (c), Test-S3; (d), Test-C1; (e), Test-C2; (f), Test-C3. |
In the flat bed condition, two apparent and symmetric high shear stress zones lateral to the pile (i.e., α ≥ 1.0) and upstream of the pile (i.e., α ≥ 2.5) are seen in Figs.16(a) and (d). These zones are the main reasons for the intense local scour around the pile. Notably, the value and area of the high shear stress zones in the SCP tests are much larger than those in the CCP tests. In addition, the maximum values of α on the surface of the pile have very different locations. However, the largest shear stress occurs at symmetrically distributed locations, approximately ±50˚ along the CCP surface, while the two special points around the SCP are located in the upstream pile corners. These different characteristics result in a greater scour hole area and a deeper scour depth around the SCP (Fig.5(a)) than in the CCP (Fig.5(c)) in the following scouring stage. Once local scour occurs, the distributions of the shear stress are adapted to the topography accordingly. Figs.16 (b) and (e) show that in addition to the area of the high shear stress zones slightly decreasing in each pile, the concentration distribution locations have been transferred to the edges of the scour holes. Although amplified shear stresses are found behind the two piles in the initial scouring stage, only a small area in the near-wake of the CCP is seen in the equilibrium scouring stage and is mainly caused by the intense upward flow. In addition, the largest shear stress zone, which has a smaller magnitude than that in Test-S2, moves to the edge of the scour hole on the lateral sides of the SCP in Test-S3.
To further address the local scour induced by the amplified bed shear stress, the contours of the instantaneous velocities in the transverse and spanwise directions are now discussed, as Keshavarzi et al. (2014) stated that high transverse and spanwise velocities are of equal importance to the streamwise velocity for scour progress. The contours of the instantaneous transverse velocity (v) and spanwise velocity (w) at tu∞ /D = 250 near the bed surface (at z/D = 0.05), nondimensionalized by the streamwise velocity at the inlet (u∞), are shown in Fig.17. As seen from this figure, the instantaneous velocity fluctuates sharply in the transverse and spanwise directions and has common characteristics with the high shear stress zones in Fig.16. In fact, the strong downflow in the spanwise direction upstream of the pile and in the scour holes, as well as the violent fluctuating flow in the transverse direction, generates the horseshoe vortex systems. Aside from the streamwise movements, sediment particles should be attributed to the intense transverse and spanwise flow around the pile. As seen in Figs.17 (a) and (b), the highest transverse velocity is at upstream corners and 50˚ in the SCP and CCP tests, respectively. These locations are consistent with where the scour is initiated. Therefore, the maximum intensity zones for the bed shear stress and velocity located symmetrically around the pile account for the deepest scour depth and the highest bed elevation around the pile. The deeper scour hole in the SCP tests is due to the larger shear stress caused by the stronger flow in the transverse and spanwise directions (e.g., Figs.17(c) and (d)).
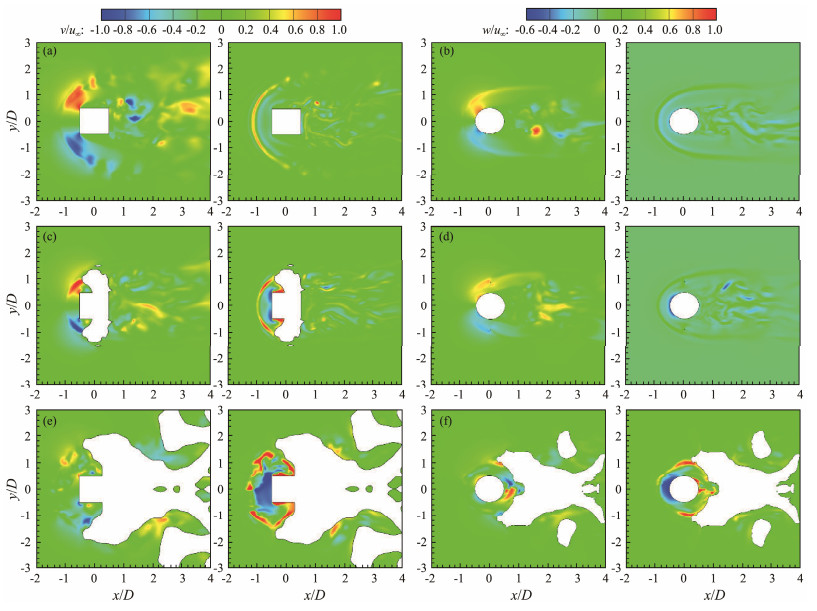
|
Fig. 17 Contours of the nondimensional instantaneous transverse velocity (on the left) and spanwise velocity (on the right) of the square-and circular-crossing piles near the bed surface under different scoured-bed conditions. (a), Test-S1; (b), Test-C1; (c), Test-S2; (d), Test-C2; (e), Test-S3; (f), Test-C3. |
According to the experiments conducted in this study, flow features in flat and scoured beds have been numerically investigated using the k-ω SST IDDES model. This model has been extensively validated by comparison with experimental and numerical results in the literature, considering time-averaged hydrodynamic force, pressure coefficients, velocity, and Strouhal number. Moreover, grid independence and mesh generation techniques for scoured beds have been discussed and introduced, respectively. Furthermore, flow characteristics around SCP and CCP above a flat bed and a scoured seabed were analyzed us-ing a time-averaged flow field, hydrodynamic force coefficients, instantaneous vorticity, and bed shear stress. The main conclusions are as follows:
1) Time-averaged drag coefficients for SCP and CCP are clearly enhanced from the flat bed stage to the equilibrium scouring stage. Moreover, the rms of the lift coefficients decreases linearly in SCP tests, while these coefficients increase linearly in CCP tests. Minimum pressure coefficients are found at the upstream corners in the scoured-bed conditions in the SCP tests, whereas these coefficients are at 72.5˚ and 73.5˚ in the flat bed condition and initial scouring stages and are moved downward to 79.5˚ in the equilibrium scouring stage of the CCP.
2) The size and strength of the horseshoe vortex around the SCP tests are larger than those in CCP tests, resulting in a much larger and deeper scour hole upstream of the SCP. The main and secondary vortices upstream of the pile join to form a horseshoe vortex when the scour hole is formed. In contrast to the SCP tests, because of the smaller distance between the separated boundary layers and both sides of the CCP face, near-wake vortices behind the more streamlined CCP form a sediment scour zone situated extremely near the CCP rear face. In this scour zone, an upward flow is formed because of the pressure difference induced by the influx of water and the upward slope in the streamwise direction.
3) In contrast to an unsubmerged pile, reverse flow over the top of the pile, which is generated by upward flow upstream of the submerged pile (SCP or CCP) and the bound-ary layer on the top face of the pile, drops behind the pile and reaches the sand bed at x/D = 2.5-3.5, thus separating the boundary layers on both sides of the pile face. Moreover, it enhances the clockwise vortex in the streamwise direction and interferes with the separated boundary layers. Thus, the symmetric vortex shedding is destroyed to produce a patch of segmented small vortices.
4) The amplified shear stress zone is more extensive in the SCP test than in the CCP test. Moreover, when the scour holes are formed, the high shear stress zone is narrowed and mainly at the scour hole edge upstream of the pile in the initial and equilibrium scouring stages. Violent fluctuating flow in the transverse and spanwise directions plays an important role in the local scour upstream of the pile.
AcknowledgementsThe authors acknowledge the support from the National Natural Science Foundation of China (Nos. 52301324 and 52001276), the Natural Science Foundation of Zhejiang Province (No. LQ24E090001), the Open Fund of Key Lab-oratory of Estuary and Coast of Zhejiang Province (No. ZIHE21005), the Natural Science Foundation of Ningbo (No. 2021J096), and the Zhejiang Transportation Science and Technology (No. 2021064). The authors thank Drs. Dongxu Wang, Bo Yang and Dingnan Lu for their help with the numerical model setup and computer server.
Alemi, M., Pêgo, J. P., and Maia, R., 2019. Numerical simulation of the turbulent flow around a complex bridge pier on the scoured bed. European Journal of Mechanics–B/Fluids, 76: 316-331. DOI:10.1016/j.euromechflu.2019.03.011 (  0) 0) |
Bearman, P. W., and Obasaju, E. D., 1982. An experimental study of pressure fluctuations on fixed and oscillating square-section cylinders. Journal of Fluid Mechanics, 119: 297-321. DOI:10.1017/S0022112082001360 (  0) 0) |
Beheshti, A. A., and Ataie-Ashtiani, B., 2016. Scour hole influence on turbulent flow field around complex bridge piers. Journal of Fluid Mechanics, 97(2): 451-474. (  0) 0) |
Behr, M., Hastreiter, D., Mittal, S., and Tezduyar, T. E., 1995. In-compressible flow past a circular cylinder: Dependence of the computed flow field on the location of the lateral boundaries. Computer Methods in Applied Mechanics and Engineering, 123: 309-316. DOI:10.1016/0045-7825(94)00736-7 (  0) 0) |
Beitel, A., Heng, H., and Sumner, D., 2019. The effect of aspect ratio on the aerodynamic forces and bending moment for a surface-mounted finite-height cylinder. Journal of Wind Engineering and Industrial Aerodynamics, 186: 204-213. DOI:10.1016/j.jweia.2019.01.009 (  0) 0) |
Bordbar, A., Sharifi, S., and Hemida, H., 2021. Investigation of the flow behaviour and local scour around single square-shaped cylinders at different positions in live-bed. Ocean Engineering, 238: 109772. DOI:10.1016/j.oceaneng.2021.109772 (  0) 0) |
Cao, Y., and Tamura, T., 2016. Large-eddy simulations of flow past a square cylinder using structured and unstructured grids. Computers & Fluids, 137: 36-54. DOI:10.11897/SP.J.1016.2016.00036 (  0) 0) |
Chang, W. Y., Constantinescu, G., and Tsai, W. F., 2020. Effect of array submergence on flow and coherent structures through and around a circular array of rigid vertical cylinders. Physics of Fluids, 32: 035110. DOI:10.1063/1.5138604 (  0) 0) |
Chen, Y., Djidjeli, K., and Xie, Z. T., 2020. Large eddy simulation of flow past stationary and oscillating square cylinders. Journal of Fluids and Structures, 97: 103107. DOI:10.1016/j.jfluidstructs.2020.103107 (  0) 0) |
Dargahi, B., 1990. Controlling mechanism of local scouring. Jour-nal of Hydraulic Engineering, 116(10): 1197-1214. DOI:10.1061/(ASCE)0733-9429(1990)116:10(1197) (  0) 0) |
Du, S., Wang, C., Zhang, Z., Wu, G., and Liang, B., 2023. Experimental study of local scour around circular-crossing and square-crossing piles in waves and current. Journal of Marine Environmental Engineering, 11: 3-19. DOI:10.32908/JMEE.v11.2023041801 (  0) 0) |
Du, S., Wang, Z., Wang, R., Liang, B., and Pan, X., 2022a. Effects of flow intensity on local scour around a submerged square pile in a steady current. Physics of Fluids, 34: 085126. DOI:10.1063/5.0103556 (  0) 0) |
Du, S., Wu, G., David, Z. Z., Wang, R., Lu, Y., and Liang, B., 2022b. Experimental study of local scour around submerged square piles in combined waves and current. Ocean Engineering, 266: 113176. DOI:10.1016/j.oceaneng.2022.113176 (  0) 0) |
Du, X., Shi, D., Dong, H., and Liu, Y., 2021. Flow around square-like cylinders with corner and side modifications. Journal of Wind Engineering and Industrial Aerodynamics, 215: 104686. DOI:10.1016/j.jweia.2021.104686 (  0) 0) |
Gao, J., Ma, X., Dong, G., Chen, H., Liu, Q., and Zang, J., 2021. Investigation on the effects of Bragg reflection on harbor oscillations. Coastal Engineering, 170: 103977. DOI:10.1016/j.coastaleng.2021.103977 (  0) 0) |
Gao, J., Shi, H., Zang, J., and Liu, Y., 2023. Mechanism analysis on the mitigation of harbor resonance by periodic undulating topography. Ocean Engineering, 281: 114923. DOI:10.1016/j.oceaneng.2023.114923 (  0) 0) |
Guan, D., Chiew, Y. M., Wei, M., and Hsieh, S. C., 2019. Characterization of horseshoe vortex in a developing scour hole at a cylindrical bridge pier. International Journal of Sediment Research, 34(2): 118-124. DOI:10.1016/j.ijsrc.2018.07.001 (  0) 0) |
Hu, X., 2019. Investigation on characteristics of flow around the deep-sea floating platform and vortex-induced motion at high Reynolds numbers. PhD thesis. Shanghai Jiao Tong University.
(  0) 0) |
Kawamura, T., Hiwada, M., Hibino, T., Mabuchi, I., and Kumada, M., 1984. Flow around a finite circular cylinder on a flat plate. Bulletin of JSME, 27: 2142-2151. DOI:10.1299/jsme1958.27.2142 (  0) 0) |
Keshavarzi, A., Melville, B., and Ball, J., 2014. Three-dimensional analysis of coherent turbulent flow structure around a single circular bridge pier. Environmental Fluid Mechanics, 14(4): 821-847. DOI:10.1007/s10652-013-9332-1 (  0) 0) |
Kim, S., Wilson, P. A., and Chen, Z., 2015. Effect of turbulence modelling on 3-D LES of transitional flow behind a circular cylinder. Ocean Engineering, 100: 19-25. DOI:10.1016/j.oceaneng.2015.03.014 (  0) 0) |
Kirkil, G., and Constantinescu, G., 2009. Nature of flow and turbulence structure around an in-stream vertical plate in a shallow channel and the implications for sediment erosion. Water Resources Research, 45(6): W06412. (  0) 0) |
Kirkil, G., and Constantinescu, G., 2010. Flow and turbulence structure around an in-stream rectangular cylinder with scour hole. Water Resources Research, 46(11): W11549. (  0) 0) |
Koken, M., and Constantinescu, G., 2008. An investigation of the flow and scour mechanisms around isolated spur dikes in a shallow open channel: 1. Conditions corresponding to the initiation of the erosion and deposition process. Water Resources Research, 44(8): W08406. (  0) 0) |
Kumar, L., and Afzal, M. S., 2023. Experimental and numerical modelling of scour at vertical wall abutment under combined wave-current flow in low KC regime. Ocean Engineering, 285: 115394. DOI:10.1016/j.oceaneng.2023.115394 (  0) 0) |
Lee, B. E., 1975. The effect of turbulence on the surface pressure field of a square prism. Journal of Fluid Mechanics, 69(2): 263-282. DOI:10.1017/S0022112075001437 (  0) 0) |
Luo, S. C., Yazdani, M. G., Chew, Y. T., and Lee, T. S., 1994. Effects of incidence and afterbody shape on flow past bluff cylinders. Journal of Wind Engineering and Industrial Aerodynamics, 53(3): 375-399. DOI:10.1016/0167-6105(94)90092-2 (  0) 0) |
Lyn, D. A., Einav, S., Rodi, W., and Park, J. H., 1995. A laser-Doppler velocimetry study of ensemble-averaged characteristics of the turbulent near wake of a square cylinder. Journal of Fluid Mechanics, 304: 285-319. DOI:10.1017/S0022112095004435 (  0) 0) |
Lysenko, D. A., Ertesvag, I. S., and Rian, K. E., 2012. Large-eddy simulation of the flow over a circular cylinder at Reynolds number 3900 using the OpenFOAM Toolbox. Flow, Turbulence and Combustion, 89: 491-518. DOI:10.1007/s10494-012-9405-0 (  0) 0) |
Melville, B. W., 1997. Pier and abutment scour-An integrated approach. Journal of Hydraulic Engineering, 123(2): 125-136. DOI:10.1061/(ASCE)0733-9429(1997)123:2(125) (  0) 0) |
Minguez, M., Brun, C., Pasquetti, R., and Serre, E., 2011. Experimental and high-order LES analysis of the flow in near-wall region of a square cylinder. International Journal of Heat and Fluid Flow, 32(3): 558-566. DOI:10.1016/j.ijheatfluidflow.2011.03.009 (  0) 0) |
Nishimura, H., and Taniike, Y., 2000. Fluctuating pressures on a two-dimensional square prism. Journal of Structural and Construction Engineering (Transactions of AIJ), 533: 37-43 (in Japanese).
(  0) 0) |
Norberg, C., 1993. Flow around rectangular cylinders: Pressure forces and wake frequencies. Journal of Wind Engineering and Industrial Aerodynamics, 49(1): 187-196. (  0) 0) |
Schendel, A., Hildebrandt, A., Goseberg, N., and Schlurmann, T., 2018. Processes and evolution of scour around a monopile induced by tidal currents. Coastal Engineering, 139: 65-84. DOI:10.1016/j.coastaleng.2018.05.004 (  0) 0) |
Sumer, B. M., and Nielsen, A. W., 2013. Sinking failure of scour protection at wind turbine foundation. Proceedings of the Institution of Civil Engineers-Energy, 166(4): 170-188. DOI:10.1680/ener.12.00006 (  0) 0) |
Trias, F., Gorobet, A., and Oliva, A., 2015. Turbulent flow around a square cylinder at Reynolds number 22000: A DNS study. Computers & Fluids, 123: 87-98. (  0) 0) |
Williams, P., Balachandar, R., Roussinova, V., and Barron, R., 2022. Particle image velocimetry evaluation of flow-altering countermeasures for local scour around a submerged circular cylinder. International Journal of Sediment Research, 37(4): 411-423. DOI:10.1016/j.ijsrc.2022.03.001 (  0) 0) |
Zhang, D., Cheng, L., An, H., and Zhao, M., 2017. Direct numerical simulation of flow around a surface-mounted finite square cylinder at low Reynolds numbers. Physics of Fluids, 29: 045101. DOI:10.1063/1.4979479 (  0) 0) |
Zhang, Z., Du, S., Guo, Y., Yang, Y., Zeng, J., Sui, T., et al., 2023. Field study of local scour around bridge foundations on silty seabed under irregular tidal flow. Coastal Engineering, 185: 104382. DOI:10.1016/j.coastaleng.2023.104382 (  0) 0) |
Zhao, E., Dong, Y., Tang, Y., and Sun, J., 2021. Numerical investigation of hydrodynamic characteristics and local scour mechanism around submarine pipelines under joint effect of solitary waves and currents. Ocean Engineering, 222: 108553. DOI:10.1016/j.oceaneng.2020.108553 (  0) 0) |
Zhao, E., Shi, B., Qu, K., Dong, W., and Zhang, J., 2018. Experimental and numerical investigation of local scour around submarine piggyback pipeline under steady current. Journal of Ocean University of China, 17(2): 244-256. DOI:10.1007/s11802-018-3290-7 (  0) 0) |
Zhao, M., Zhu, X., Cheng, L., and Teng, B., 2012. Experimental study of local scour around subsea caissons in steady currents. Coastal Engineering, 60(1): 30-40. (  0) 0) |
 2024, Vol. 23


