2) Laboratory for Marine Drugs and Bioproducts of Qingdao National Laboratory for Marine Science and Technology, Qingdao 266003, China;
3) Key Laboratory of Glycoscience & Glycotechnology of Shandong Province, Qingdao 266003, China;
4) Key Laboratory of Marine Drugs, Ministry of Education of China, Qingdao 266003, China
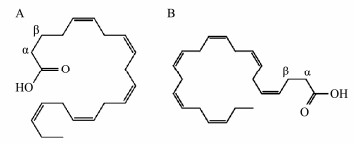
Fish oil is the oil derived from marine pelagic fish species, such as tuna, salmon, swordfish, and mackerel ADDIN EN.CITE.DATA (Jacobs et al., 2002; Smith and Sahyoun, 2005). Fish oil exerts some beneficial effects against several diseases such as autoimmune disease, cardiovascular diseases ADDIN EN.CITE.DATA (Kris-Etherton et al., 2002), depression ADDIN EN.CITE.DATA (Nemets et al., 2006), and neurological disorders. The beneficial effects of fish oil have been attributed to docosahexaenoic acid (DHA) and eicosapentaenoic acid (EPA) (Fig. 1) which have been associated with these health benefits. As a result, there are numerous fish oil products containing EPA and DHA in the markets. These fish oil products are derived from different sources, and the prices of these products are significantly different. While these products are labeled with the same ingredient levels, namely DHA (120 mg g−1) and EPA (180 mg g−1). The quantitative methods of DHA and EPA in fish oil products have been developed by gas chromatography (GC), gas chromatography-mass spectrometry (GC-MS), and high-performance liquid chromatography (HPLC). However, the acquisition time of these methods was over 1 h, making them not suitable for the routine and rapid quantitative analysis of a large number of fish oil samples. Hence, it is necessary to develop a rapid analytical method that can simultaneously determine EPA and DHA in fish oil for quality control.

|
Fig. 1 The structures of eicosapentaenoic acid (EPA, A) and docosahexaenoic acid (DHA, B) |
Quantitative Nuclear Magnetic Resonance (qNMR) is a routine analytical technique, which is 'green', precise, and, most importantly, nondestructive. Besides, qNMR does not require the standard of compound ADDIN EN.CITE.DATA (Pauli et al., 2005; Chauthe et al., 2012; Tada et al., 2013). The qNMR method has been widely applied for the determination of various compounds in the complex mixtures of foods ADDIN EN.CITE.DATA (Hatzakis et al., 2008; Petrakis et al., 2008; Gouilleux et al., 2018), the natural products ADDIN EN.CITE.DATA (Harvey et al., 2015), Chinese medicine and plant extracts ADDIN EN.CITE.DATA (Song et al., 2014; Jegou et al., 2015; Dong et al., 2018). Moreover, this method does not require sample prepurification or calibration curve standards. Therefore, it can be used for the quality control of DHA and EDA in fish oil products and serve as an effective alternative method to various chromatographic techniques.
In this study, we report a rapid and precise 1H NMR method that can quantify DHA and EPA in fish oil products simultaneously. Also, the application of this method for the quality control of fish oil products is presented.
2 Materials and Methods 2.1 Chemicals and ReagentsDHA and EPA standards and dimethyl terephthalate (DMT, internal standard) were obtained from Sigma-Aldrich Corporation (Missouri, USA). Deuterated chloroform (CDCl3) was obtained from Cambridge Isotope Laboratories, Inc. (Andover, MA, USA). Four kinds of fish oil softgels were obtained from 4 common health food companies.
2.2 Sample PreparationThe working solution of the internal standard (4.14 mg mL−1) was prepared in CDCl3 with stock solutions of DHA (9.29 mg mL−1) and EPA (10.45 mg mL−1). Calibration curves for DHA and EPA were constructed using seven concentrations over a range of 0.048-3.10 mg mL−1 (3.10, 1.55, 0.78, 0.39, 0.19, 0.10 and 0.048 mg mL−1) and 0.038-2.45 mg mL−1 (2.45, 1.23, 0.61, 0.31, 0.15, 0.077 and 0.038 mg mL−1), respectively. All calibration standard samples were freshly prepared each day. To quantify DHA and EPA in fish oil, 10 softgels were weighed precisely and the contents were taken out. Subsequently, the empty softgel shells are also weighed to calculate the mass of the contents of each softgel. The fish oil (10 μL) was dissolved in a CDCl3 solution (600 μL) containing the internal standard (0.138 mg mL−1) and vortex-mixed for 1 min. And the mixture was used for the 1H NMR analysis.
2.3 1H NMR Spectrometric ParametersAll 1H-NMR spectra were recorded on an Agilent DD2 500 MHz spectrometer with a 5-mm One NMR probe (CA, United States). The spectra were recorded with 32 scans over a pulse angle of 45˚, a spectral width (SW) of 8012.8 Hz, and a relaxation delay (D1) of 10.0 s at 298 K. Free induction decays (FIDs) were processed with a line broadening (LB) of 0.3 Hz before Fourier transformation. The phase and baseline spectra were corrected manually. All data acquisition and processing were done with Mest-ReNova 11.0 (MestrelabResearch, S. L., Santiago de Compostela, Spain).
2.4 Identification of ContentsThe signals of DHA at 2.391 ppm (α, β) and EPA at 1.697 ppm (β) were used for the quantitative analysis. The amount of DHA and EPA in tablets or capsules was calculated by the following equation :
| $ {W}_{u}={W}_{s}\times \frac{{A}_{u}}{{A}_{s}}\times \frac{{N}_{s}}{{N}_{u}}\times \frac{{M}_{u}}{{M}_{s}}\times {P}_{s}, $ | (1) |
where W, A, and N are the gravimetric weight, integral area, and the number of nuclei of DHA or EPA (u) and internal standard (s), respectively. Mu is the molecular mass of DHA or EPA, and Ms is the molecular mass of the internal standard. Ps stands for purity of the internal standard (99.99%). Based on the labeled contents data and linearity of the method, 100 μL fish oil per sample was used for their quantification in the softgels.
2.5 Quantitative 1H NMR Validation MethodValidation was carried out according to the CFDA guidelines. The limit of detection (LOD) and limit of quantification (LOQ) were separately evaluated using the S/N values of 3 and 10, respectively ADDIN EN.CITE.DATA (Zhang et al., 2016). The linearity, precision, repeatability, stability, and recovery were determined according to the CFDA guidelines (n = 6). The system suitability test was performed with six replicate injections of the standard solution. The stability of DHA and EPA at room temperature was determined by analyzing the samples at 0 and 120 h. The recovery was calculated by Eq. 2). The amount of DHA and EPA was calculated using Eq. 1).
| $ R=({S}_{1}-{S}_{0})/S\times 100\%, $ | (2) |
where R is the recovery; S0 and S1 are the measurements before and after the addition of standards; S is the amount of added compounds DHA and EPA.
2.6 Sample CharacterizationFour batches of fish oil from 4 commercial sources were analyzed via 1H NMR. The sample preparation was described above.
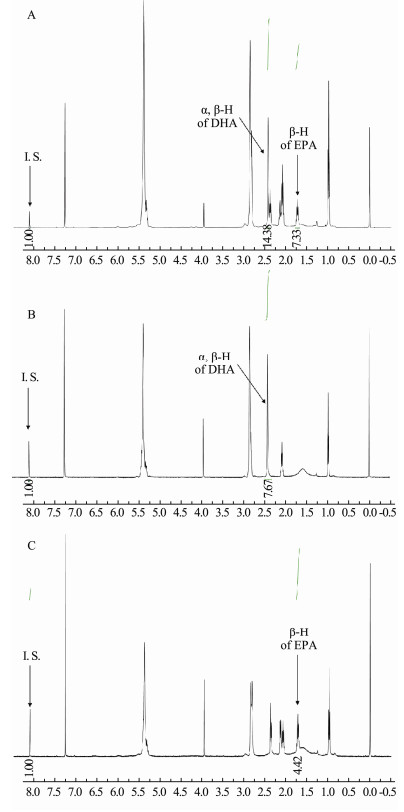
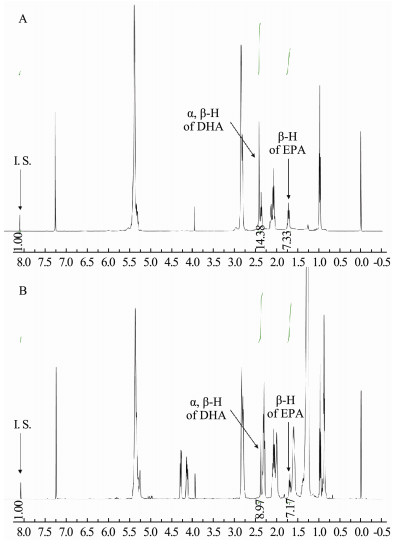
3 Results and Discussion 3.1 Development of 1H NMR MethodCDCl3 was selected as a solvent in this study due to its superior solubilizing ability towards both DHA and EPA. The 1H NMR spectra of DHA, EPA, and their mixture are shown in Fig. 2. It is intuitively clear that the signals of both DHA and EPA appeared in the region with a small chemical shift. Therefore, DMT, with the signal in aromatic region (8.10 ppm), is a suitable internal standard for the quantification of DHA and EPA, because it does not overlap with the signals of DHA and EPA. Besides, it can be found from the comparison of Fig. 2B and Fig. 2C with Fig. 2A respectively, the signals at 2.391 ppm for DHA and at 1.697 ppm for EPA are suitable to be chosen to quantify DHA and EPA in this study since these two peaks are separated from the other signal. Fortunately, there is no obvious overlap between the two signals and the signals of other substances in fish oil samples, so they can be applied to the quantification of EPA and DHA in fish oil samples. The 1H NMR spectra of the mixed standard of DHA and EPA, and a fish oil sample are shown in Fig. 3.

|
Fig. 2 1H NMR spectra of mixed standards of DHA and EPA (A), DHA standard (B) and EPA standard (C) |

|
Fig. 3 1H NMR spectra of DHA and EPA. A, mixed standards; B, fish oil softgels sample |
In a quantitative experiment, the relaxation delay (dl) and acquisition time (at) are very important parameters that influence the accuracy of the analysis. Therefore, these parameters were optimized to achieve good resolution and sensitivity for both DHA and EPA. To determine the robustness of this method, the dl (1, 5, 10, 15, 20, 25, and 30 s) was evaluated, and the dl of 10 s was selected for this study. The at of 2, 3, and 4 s was evaluated, and the results showed that the at of 2 s was sufficient for the complete attenuation of FID. Hence, the dl of 10 s and the at of 2 s were selected for this study. The 1H NMR acquisition time was only 9 min, which is much shorter than that of the long GC and HPLC elution times.
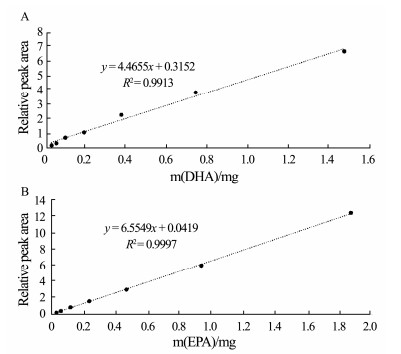
3.2 Validation of 1H NMR MethodsThe linearity of the 1H NMR method evaluated over the concentration range of 0.0485-3.10 mg mL−1 for DHA, and 0.0230-1.47 mg mL−1 for EPA, was excellent. The LOD and LOQ were 0.015 and 0.05 mg mL−1 for DHA and 0.006 and 0.02 mg mL−1 for EPA (Table 1). The linear equations with good regression coefficients were shown in Fig. 4. The precision of the method for DHA and EPA was 0.53% and 0.72% (Table 2), respectively, and the inter-day precision was 0.81% and 1.09%, respectively. The recovery rate for DHA and EPA was determined to be 102.9% and 106.8%, respectively. DHA and EPA in the samples were found to be stable for 120 h according to the stability and 106.8%, respectively. DHA and EPA in the samples were then found to be stable for 120 h according to the stability test. Validation of the 1H NMR method indicated that the method was precise and in line with the CFDA guidance.
|
|
Table 1 Analysis results of linear correlation parameters, LOD and LOQ for DHA and EPA |

|
Fig. 4 Calibration curves of DHA (A) and EPA (B) |
|
|
Table 2 The results of recoveries and precisions |
The 1H NMR method was successfully used to determine the concentration of DHA and EPA in fish oil softgels from 4 companies. The concentration of DHA was 132.55 ± 0.22, 83.05 ± 0.34, 122.09 ± 0.24, and 156.30 ± 0.31 mg g−1, respectively (Table 3). The concentration of EPA was 211.29 ± 0.29, 207.99 ± 0.46, 237.81 ± 0.44, and 304.54 ± 0.57 mg g−1, respectively (Table 2). The results indicated the significant variation in the contents of EPA and DHA in the fish oils from different sources, and there is no relationship between the price and contents of EPA and DHA. Although the quality standards of fish oil in different countries and regions have many contents, the content of DHA and EPA, which are the most important active components, is an important part of it. Hence, the strict supervision of the labeling of the fish oil capsules is urgently required.
|
|
Table 3 The concentration (mg g−1) of DHA and EPA in fish oil softgels (N = 3) |
This paper describes a rapid, accurate, and validated 1H NMR method for the quantification of DHA and EPA in fish oil capsules. In the past, the quantitative analysis of DHA and EPA in fish oil was mainly realized by chromatography. Although chromatographic methods, especially when combined with mass spectrometry, are highly sensitive. However, they also involved more complex pretreatment of samples. And fish oil contains many polyunsaturated fatty acids with a very similar structure. Therefore, the samples must be separated sufficiently on the column to accurately quantify EPA and DHA, which will take a lot of time. The accuracy and sensitivity of the NMR method have reached the level required in the production quality control and inspection process. Also, the acquisition time of the 1H NMR method is much shorter than that of the GC and HPLC methods. Thus, this study indicates that qNMR is more suitable than GC and HPLC for the quality control of fish oil capsules. However, due to the limitation of test conditions, NMR is not available in every lab. However, it is reasonable to believe that with the development of science and technology, the instruments of NMR will be more and more popular, and the NMR method will be more widely accepted because of its advantages of simplicity and speed. Based on the results of the contents of DHA and EPA in samples, the strict supervision of the labeling of the fish oil products is urgently required.
AcknowledgementsThis work was supported by the Open Research Fund Program of Shandong Provincial Key Laboratory of Glycoscience & Glycotechnology (Ocean University of China), and the Fundamental Research Funds for the Central Universities (Nos. 201912008, 201964019, and 201851025).
Bharti, S. K. and Roy, R., 2012. Quantitative 1H NMR spectroscopy. TrAC Trends in Analytical Chemistry, 35: 5-26. DOI:10.1016/j.trac.2012.02.007 (  0) 0) |
CFDA, 2015. Pharmacopoeia of the People's Republic of China.
(  0) 0) |
Chauthe, S. K., Sharma, R. J., Aqil, F., Gupta, R. C. and Singh, I. P., 2012. Quantitative NMR: An applicable method for quantitative analysis of medicinal plant extracts and herbal products. Phytochemical Analysis, 23: 689-696. DOI:10.1002/pca.2375 (  0) 0) |
Dong, J. W., Li, X. J., Cai, L., Shi, J. Y., Li, Y. F., Yang, C. and Li, Z. J., 2018. Simultaneous determination of alkaloids dicentrine and sinomenine in Stephania epigeae by 1H NMR spectroscopy. Journal of Pharmaceutical and Biomedical Analysis, 160: 330-335. DOI:10.1016/j.jpba.2018.08.007 (  0) 0) |
Fang, X. S. and Tan, X. M., 2005. The qualitative analysis and quantitative analysis of purification of salvianolic acids by macroreticular resin. Zhongguo Zhong Yao Za Zhi, 30: 1331-1334. (  0) 0) |
Gouilleux, B., Marchand, J., Charrier, B., Remaud, G. S. and Giraudeau, P., 2018. High-throughput authentication of edible oils with benchtop ultrafast 2D NMR. Food Chemistry, 244: 153-158. DOI:10.1016/j.foodchem.2017.10.016 (  0) 0) |
Harbige, L. S., 2003. Fatty acids, the immune response, and autoimmunity: A question of n-6 essentiality and the balance between n-6 and n-3. Lipids, 38: 323-341. DOI:10.1007/s11745-003-1067-z (  0) 0) |
Harvey, A. L., Edrada-Ebel, R. and Quinn, R. J., 2015. The re-emergence of natural products for drug discovery in the genomics era. Nature Reviews Drug Discovery, 14: 111-129. DOI:10.1038/nrd4510 (  0) 0) |
Hatzakis, E., Koidis, A., Boskou, D. and Dais, P., 2008. Determination of phospholipids in olive oil by 31P NMR spectroscopy. Journal of Agricultural and Food Chemistry, 56: 6232-6240. DOI:10.1021/jf800690t (  0) 0) |
Jacobs, M. N., Covaci, A. and Schepens, P., 2002. Investigation of selected persistent organic pollutants in farmed Atlantic salmon (Salmo salar), salmon aquaculture feed, and fish oil components of the feed. Environmental Science & Technology, 36: 2797-2805. (  0) 0) |
Jegou, C., Kervarec, N., Cerantola, S., Bihannic, I. and Stiger-Pouvreau, V., 2015. NMR use to quantify phlorotannins: The case of Cystoseira tamariscifolia, a phloroglucinol-producing brown macroalga in Brittany (France). Talanta, 135: 1-6. DOI:10.1016/j.talanta.2014.11.059 (  0) 0) |
Kris-Etherton, P. M., Hecker, K. D., Bonanome, A., Coval, S. M., Binkoski, A. E., Hilpert, K. F., Griel, A. E. and Etherton, T. D., 2002. Bioactive compounds in foods: Their role in the prevention of cardiovascular disease and cancer. The American Journal of Medicine, 113(Suppl 9B): 71S-88S. (  0) 0) |
Lukiw, W. J. and Bazan, N. G., 2008. Docosahexaenoic acid and the aging brain. Journal of Nutrition, 138: 2510-2514. DOI:10.3945/jn.108.096016 (  0) 0) |
Nemets, H., Nemets, B., Apter, A., Bracha, Z. and Belmaker, R. H., 2006. Omega-3 treatment of childhood depression: A controlled, double-blind pilot study. American Journal of Psychiatry, 163: 1098-1100. DOI:10.1176/ajp.2006.163.6.1098 (  0) 0) |
Pauli, G. F., Jaki, B. U. and Lankin, D. C., 2005. Quantitative 1H NMR: Development and potential of a method for natural products analysis. Journal of Natural Products, 68: 133-149. DOI:10.1021/np0497301 (  0) 0) |
Petrakis, P. V., Agiomyrgianaki, A., Christophoridou, S., Spyros, A. and Dais, P., 2008. Geographical characterization of Greek virgin olive oils (cv. Koroneiki) using 1H and 31P NMR fingerprinting with canonical discriminant analysis and classification binary trees. Journal of Agricultural and Food Chemistry, 56: 3200-3207. DOI:10.1021/jf072957s (  0) 0) |
Smith, K. M. and Sahyoun, N. R., 2005. Fish consumption: Recommendations versus advisories, can they be reconciled?. Nutrition Reviews, 63: 39-46. DOI:10.1111/j.1753-4887.2005.tb00120.x (  0) 0) |
Song, Y. L., Jing, W. H., Chen, Y. G., Yuan, Y. F., Yan, R. and Wang, Y. T., 2014. 1H nuclear magnetic resonance based-metabolomic characterization of Peucedani Radix and simultaneous determination of praeruptorin A and praeruptorin B. Journal of Pharmaceutical and Biomedical Analysis, 93: 86-94. DOI:10.1016/j.jpba.2013.08.021 (  0) 0) |
Srigley, C. T. and Rader, J. I., 2014. Content and composition of fatty acids in marine oil omega-3 supplements. Journal of Agricultural and Food Chemistry, 62: 7268-7278. DOI:10.1021/jf5016973 (  0) 0) |
Tada, A., Takahashi, K., Ishizuki, K., Sugimoto, N., Suematsu, T., Arifuku, K., Tahara, M., Akiyama, T., Ito, Y., Yamazaki, T., Akiyama, H. and Kawamura, Y., 2013. Absolute quantitation of stevioside and rebaudioside A in commercial standards by quantitative NMR. Chemical & Pharmaceutical Bulletin (Tokyo), 61: 33-38. (  0) 0) |
Tanaka, R., Yamazaki, M., Hasada, K. and Nagatsu, A., 2013. Application of quantitative 1H-NMR method to determination of paeoniflorin in Paeoniae radix. Journal of Natural Medicines, 67: 657-661. DOI:10.1007/s11418-012-0711-6 (  0) 0) |
Teng, J. I. and Gowda, N. M. M., 1993. Analysis of n-3 fatty acids in fish oils by high-performance liquid chromatography. Chromatographia, 35: 627-630. DOI:10.1007/BF02267927 (  0) 0) |
Wang, C., Zhang, X. and Yu, M., 2019. Rapid determination of acarbose in tablets by 1H NMR spectroscopy. Current Pharmaceutical Analysis: 15. (  0) 0) |
Yi, T., Li, S. M., Fan, J. Y., Fan, L. L., Zhang, Z. F., Luo, P., Zhang, X. J., Wang, J. G., Zhu, L., Zhao, Z. Z. and Chen, H. B., 2014. Comparative analysis of EPA and DHA in fish oil nutritional capsules by GC-MS. Lipids in Health and Disease, 13: 190. DOI:10.1186/1476-511X-13-190 (  0) 0) |
Zhang, X. L., Wang, C., Chen, Z., Zhang, P. Y. and Liu, H. B., 2016. Development and validation of quantitative 1H NMR spectroscopy for the determination of total phytosterols in the marine seaweed Sargassum. Journal of Agricultural and Food Chemistry, 64: 6228-6232. DOI:10.1021/acs.jafc.6b02904 (  0) 0) |
 2020, Vol. 19


