2) Institute of Coastal Research, Ludong University of China, Yantai 264025, China;
3) Yantai Kekan Marine Technology Co., Ltd., Yantai 264025, China
Energy has always been a concern for China, and ensuring sufficient energy supply is key to the stable development of China’s economy and society. With the goal of decreasing nonrenewable resources such as coal, oil, and natural gas, all sectors of society have focused on the development and utilization of renewable resources, such as solar energy, wind energy, wave energy, and tidal current energy (Zhang et al., 2017; Melikoglu, 2018; Pörtner et al., 2019; Shi et al., 2021). Compared with wave and solar energy with limited predictability (Soukissian et al., 2021; Shi et al., 2022), tidal current energy can be predicted hundreds of years in advance (Segura et al., 2017) and thus bring stability and predictability to the power grid (Chowdhury et al., 2021) that other renewable resources cannot match (Vazquez and Iglesias, 2016; Burić et al., 2021; Fouz et al., 2022; Zhang et al., 2022). Many countries, including China, Britain (Neill et al., 2017), the United States (Defne et al., 2011; Cowles et al., 2017), France (Campbell et al., 2017; Guillou et al., 2018), and South Korea (Hwang and Jo, 2019; Ko et al., 2019), value tidal current energy for its strong predictability and minimal impact on the environment.
The tidal current energy referred to in this study is classified as marine renewable energy, which is produced by the horizontal movement of tidal currents and the surge produced by seawater during the rising or falling of tides. The basic principle behind the exploitation and utilization of tidal current energy involves the use of power generation equipment for converting tidal currents into electrical energy. However, only a part of the total tidal current energy potential can be utilized due to uncontrollable factors, such as the power generation efficiency of power generation equipment and the weakening of tidal currents by the equipment itself (Liu et al., 2011). Lv and Guo (2011) comprehensively discussed the current situation of the development and utilization of tidal current energy and put forward several suggestions beneficial to the development of tidal current energy in China. Lv and Qiao (2008) comprehensively discussed international and domestic methods for evaluating tidal current energy resources and pointed out that the current techniques mainly include farm, flux (Wu et al., 2016), Zheng’s equation (Zheng, 1987), and dynamic analysis. Power analysis primarily refers to the calculation method proposed by Garrett and Cummins (2004, 2005) and mainly focuses on small bay designs. Farm and flux methods typically refer to the energy flux, which is currently widely used for tidal energy assessment. The farm method can be understood as a turbine array or a cluster of power generation devices. It assumes that multiple identical devices form an array and are installed together in a tidal flow channel. The total amount of exploitable resources is equal to the sum of the development capacity of each device. The tidal energy resource estimated by the farm method is directly related to the type of the development device, its efficiency, and the installation methods. The flux method was proposed by the Black and Veatch Company for estimating tidal energy resources in the UK (Black and Veatch Consulting Ltd., 2004). This method evaluates tidal energy resources by considering only the energy flux and the significant impact factor (SIF) of the tidal flow in the channel, regardless of the device. All these methods have advantages and disadvantages, and the most appropriate method must be chosen for practical applications. The present study applied the flux method to assess the tidal energy in the Bohai Strait.
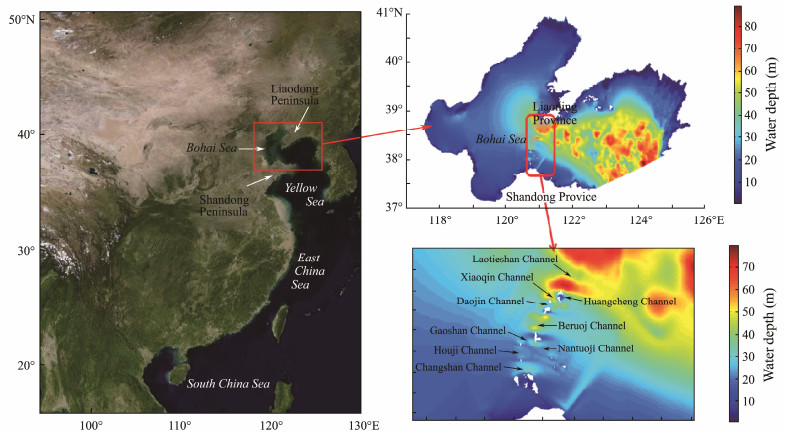
The Bohai Strait is located between the Shandong Peninsula and Laotieshan Cape in northern Liaoning Province in China. It is the junction between the Yellow Sea and the Bohai Sea. Various islands in the strait divide it into many channels. As one of China’s regions with abundant tidal current energy (Wang and Lu, 2009), the Bohai Strait is China’s most suitable area for the development of the tidal current energy north of the Yangtze River Estuary. In addition, the Shandong Peninsula surrounds the Bohai Strait with relatively small waves, making the former highly suitable for building tidal current power stations. As early as 2012, Yang (2012) used Delft3D to evaluate Shandong Peninsula’s tidal current energy resources. Wu et al. (2021) then evaluated Bohai Strait’s tidal current energy. Li et al. (2013) also evaluated the tidal current energy resources in the sea areas surrounding Shandong Province. All these studies concluded that sea areas with large flow velocities usually contain a large amount of tidal current energy (Gao et al., 2012; He et al., 2013).
Previous research on the Bohai Sea mostly focused on the development of tidal current potential near Chengshantou (Liang et al., 2012; Liu et al., 2019); studies on various channels in the Bohai Strait are rare. The present work focuses on analyzing the tidal current potential in various channels in the Bohai Strait. A detailed evaluation has been conducted on the potential and exploitable amount of tidal energy in the Bohai Strait, providing a scientific basis and supporting data for decision-makers. It also offers market information for businesses and investors, promoting the utilization of renewable energy and reducing reliance on traditional energy sources. This evaluation holds importance for the future development of tidal energy in various water channels of the Bohai Strait.
2 Introduction to Numerical ModelDelft3D is a piece of hydraulic software developed by Waterloopkundig Laboratorium, the Delft Hydraulics Laboratory of Delft University in the Netherlands. It is widely used for the large-scale calculation of water flow, waves, sediment (morphology), water quality, and ecology modules. Among its modules, Delft3D-Flow is a 3D hydrodynamic transport model that adopts a structured rectangular grid and uses an alternating-direction implicit method in a finite difference scheme to solve hydrostatic Navier-Stokes and transport equations (Gao et al., 2023). The main control equations are as follows: mass conservation equation, momentum equation, and transport equation:
| $ \frac{{\partial \xi }}{{\partial t}} + \frac{{\partial [(d + \xi)U]}}{{\partial x}} + \frac{{\partial [(d + \xi)V]}}{{\partial x}} = Q, $ | (1) |
| $\begin{array}{l} \frac{{\partial U}}{{\partial t}} + U\frac{{\partial U}}{{\partial x}} + V\frac{{\partial U}}{{\partial y}} - fV = \\ - g\frac{{\partial \xi }}{{\partial x}} - \frac{g}{{{\rho _0}}}\int_{ - d}^\xi {\frac{{\partial \rho '}}{{\partial x}}{\text{d}}z + \frac{{{\tau _{sx}} - {\tau _{bx}}}}{{{\rho _0}(d + \xi)}} + {v_h}{\nabla ^2}U}, \end{array}$ | (2) |
| $\begin{array}{l} \frac{{\partial U}}{{\partial t}} + U\frac{{\partial U}}{{\partial x}} + V\frac{{\partial U}}{{\partial y}} + fV = \\ - g\frac{{\partial \xi }}{{\partial y}} - \frac{g}{{{\rho _0}}}\int_{ - d}^\xi {\frac{{\partial \rho '}}{{\partial y}}{\text{d}}z + \frac{{{\tau _{sy}} - {\tau _{by}}}}{{{\rho _0}(d + \xi)}} + {v_h}{\nabla ^2}U}, \end{array}$ | (3) |
| $\begin{array}{l} \frac{{\partial (\xi + d)c}}{{\partial t}} + \frac{{\partial (\xi + d)Uc}}{{\partial x}} + \frac{{\partial (\xi + d)Vc}}{{\partial y}} = \\ {D_h}{\nabla ^2}c - {\lambda _d}(d + \xi)c + R, \end{array}$ | (4) |
where t is the time, ξ represents the water level (water depth above the plane of reference), d represents the current water depth (net water depth) to the reference plane, and ξ + d represents total water depth. The plane of reference is the National Vertical Datum 1985. U and V represent the velocity components in the x and y directions, respectively; Q represents the mass source intensity per unit area; ƒ is the Coriolis force parameter; Vh is the dynamic horizontal eddy viscosity; ρ0 is the reference density; ρ' is the irregular density; τsx and τsy are the wind pressure components acting on the sea surface; and τbx and τby are the shear stress components at the bottom. In the transport equation, c represents the salinity or temperature, Dh represents the horizontal eddy dissipation, λd represents the first-order decay process, and R is the source term per unit area.
Delft3D uses rectangular grids, which have fewer nodes than the triangular grids employed in other types of software, such as FV-COM (Wen and Lin, 2022). The use of rectangular grids improves computational efficiency while achieving good agreement with actual results. Therefore, when considering high computational efficiency and good results, many people will choose Delft3D software, which is also widely used in our daily measurement report calculation and writing and is a very popular type of software.
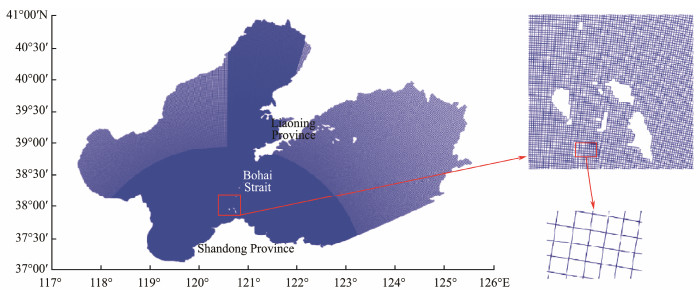
3 Establishment and Verification of the Numerical ModelThe sea area simulated in this study extends from 37.14°N in the south to 40.95°N in the north, from 117.49°E in the west to 125.58°E in the east, and includes Bohai Bay, Liaodong Bay, and Miaodao Archipelago. The model uses Delft3D’s built-in grid module to generate structured rectangular grids comprising 328410 grid cells in the calculation area. Cross-encryption is used around the study area, the Bohai Strait, to improve the calculation accuracy. The average grid step length in the encrypted area is 435 m, and the Manning coefficient of the model is set to 0.025.
The two main sources of water depth data are national water depth data for large areas and Chinese coastal chart data. The water depth in the model is the lowest tide level. The grid in the text is encrypted horizontally once for the Bohai Strait position and vertically once using the built-in encryption method of Delft3D software. The cross intersection represents the research area of the Bohai Strait. Fig.1 shows the grid map of the calculation area. For the key research area, the Bohai Sea, the geographic location of key research channels is shown in Fig.2.
|
Fig. 1 Grid division of calculation area. |
|
Fig. 2 Geographical location of key research channels in the Bohai Sea. |
The calculation starts with a ‘cold start’, i.e., the water body in the calculation area is stationary at zero time in the model, and the water level and flow velocity at all grid points in the calculation domain are zero.
| $ \zeta {(x, y, t)_{t = 0}} = 0, $ | (5) |
| $ u{(x, y, t)_{t = 0}} = 0, $ | (6) |
| $ v{(x, y, t)_{t = 0}} = 0. $ | (7) |
The open boundary of the proposed model is driven by the water level. The water level at the open boundary is generated by forecasting after the satellite altimeter data are assimilated to obtain the harmonic constants of various constituents using the Tide Model Driver. The model uses eight constituents: M2, S2, N2, K2, K1, O1, P1, and Q1 (Yuan et al., 2022).
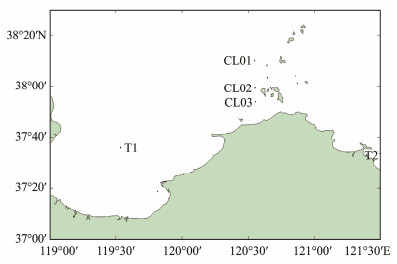
The measured data for tidal level verification in the proposed model are the tidal level data from the Dongying measuring station from 9:00 on October 10, 2018, to 10:00 on October 11, 2018, and the tidal level data from Zhifu Island in November 2021. Tidal level data from 6:00 on November 5, 2021, to 7:00 on November 6, 2021, are selected for comparison. The measured data for flow velocity and direction are the tidal current data from CL01, CL02, and CL03 stations during spring tide from 10:00 on November 5, 2021, to 11:00 on November 6, 2021. The specific latitude and longitude positions and geographic locations of verification points are shown in Table 1 and Fig.3. The measured and simulated data are compared. The tidal level verification results are shown in Fig.4, and the tidal current verification results are displayed in Figs.5, 6, and 7.
|
|
Table 1 Specific longitude and latitude of verification point |
|
Fig. 3 Distribution of tide level and tidal current verification points. |

|
Fig. 4 T1 (a) and T2 (b) water level verification. |

|
Fig. 5 Speed (a) and direction (b) of the tidal current from the measurement and model results in CL01. |

|
Fig. 6 Speed (a) and direction (b) of the tidal current from the measurement and model results in CL02. |

|
Fig. 7 Speed (a) and direction (b) of the tidal current from the measurement and model results in CL03. |
Willmott’s statistical method is proposed to evaluate the quality of the hydrodynamic model’s simulation results. The calculation formula is as follows:
| $ {\text{Skill}} = 1 - \frac{{\sum\nolimits_{i = 1}^n {|M - D{|^2}} }}{{\sum\nolimits_{i = 1}^n {{{(|M - \overline D | + |D - \overline D |)}^2}} }}, $ | (8) |
where M represents the model-computed value, D represents the observed value, and
The skill values for the simulated values of flow velocity, flow direction, and tidal level relative to their observed values are all above 0.9. In summary, the proposed model can accurately simulate the changes in tidal level and tidal current in the Bohai Bay and Laizhou Bay areas near the Bohai Strait.
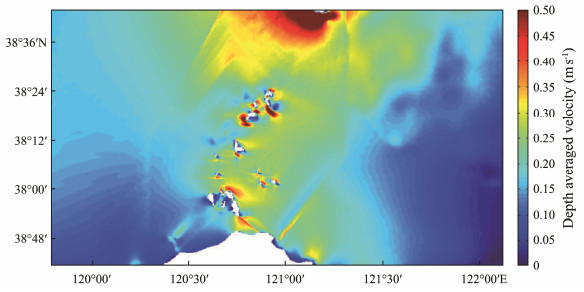
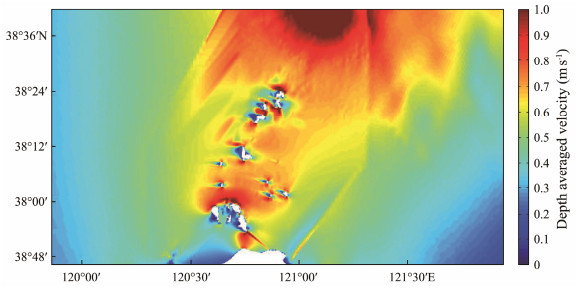
4 Results Analysis 4.1 Analysis of Flow Velocity and Its CharacteristicsThe overall average flow velocity of the Bohai Sea is shown in Fig.8, and the maximum flow velocity is displayed in Fig.9.
|
Fig. 8 Distribution of average flow velocity in the Bohai Sea. |
|
Fig. 9 Distribution of maximum flow velocity in the Bohai Sea. |
The average flow velocity in the Bohai Strait shows a trend of high flow velocity near shores and channels. Areas with large flow velocities include the Changshan Channel, Daqin Channel, Laotieshan Channel, and Xiaoqin Channel. The overall average flow velocity in the Bohai Strait is between 0.2 and 0.4 m s−1, and the maximum flow velocity is between 0.5 and 1.2 m s−1. The northeast corner of the Laotieshan Channel has a maximum flow velocity of up to 2 m s−1, which is the highest flow velocity in the entire sea (Yuan et al., 2022).
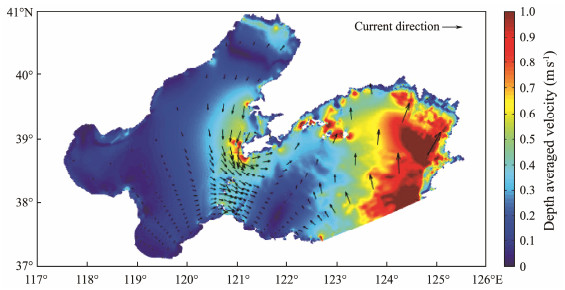
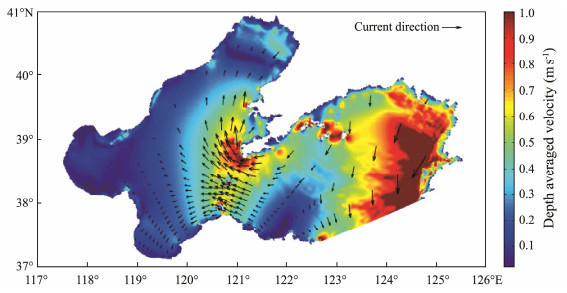
Flow field maps of the rise and fall of tides in the Miaodao Archipelago and nearby sea areas are drawn using the numerical simulation results. As indicated by the arrows in Figs.10 and 11, the flow direction during the rise and fall of tides is constrained by topography. The flow direction is basically consistent with the tides’ rise and fall routes and channel topography. Owing to the restriction of channel topography, tidal currents within these channels show strict reciprocating flow characteristics and are basically parallel to the shoreline or channel. The overall flow of the Bohai Strait is eastward to westward. After entering Liaodong Bay, the flow velocity changes to a southwest – northeast distribution. After entering Laizhou Bay, the flow velocity changes to a northeast – southwest distribution. During the rise and fall of tides, major channels in the Bohai Strait, such as the Laotieshan Channel, Daqin Channel, Xiaoqin Channel, Gaoshan Channel, and Changshan Channel, exhibit large flow velocities reaching 0.7 – 1.0 m s−1.
|
Fig. 10 Distribution map of tidal currents during high tide in the Bohai Strait. |
|
Fig. 11 Distribution map of tidal currents during ebb tide in the Bohai Strait. |
Owing to the characteristics of tidal current generators, we cannot only consider maximum and average velocities when evaluating and calculating the tidal current velocity characteristics of channels. We also need to consider the duration of local tidal current velocity at different velocity intervals to determine how much local tidal current velocity can be utilized by tidal current generators and converted into electric energy. Suitable tidal current generators can be selected according to different flow velocity conditions (Xia et al., 2022).
A probability distribution diagram of velocity is drawn for intuitive comparison. The number of times that tidal current velocities appear at different velocity intervals within 1 month on the grid near the extreme points of average velocities in the nine channels selected above is counted to draw a probability distribution diagram of the velocities within the same month as shown in Fig.12.

|
Fig. 12 Probability distribution of flow velocity in specific channels in the Bohai Strait. |
In Fig.12, the vertical axis is the probability of flow velocity occurrence, and the horizontal axis is the name of the channel studied in the Bohai Strait. Given that the data used for statistics are at the same interval (time interval of 60 min), the probability of flow velocity occurrence can reflect the duration of tidal current velocity at different velocity intervals in each channel. As shown in the figure, the Gaoshan Channel, Houji Channel, Beituoji Channel, and Nantuoji Channel have long durations at velocity intervals of 0.15 – 0.3 m s−1, and the tidal current velocities are relatively concentrated, which are suitable for small-rated power tidal current generators to develop tidal current energy. The Xiaoqin Channel and Laotieshan Channel have long durations at velocity intervals above 0.45 m s−1, which are suitable for large-rated power tidal current generators to develop tidal current energy. The tidal current velocities in Xiaoqin Channel and Laotieshan Channel are above 0.3 m s−1 for more than 50% of the time, and these channels have plentiful tidal current energy resources. Compared with the other channels, the Laotieshan Channel has a larger range and significantly larger flow velocity in its northern part, so it must contain more tidal current energy resources.
The energy flow density of seawater mainly depends on the seawater flow velocity. Therefore, analyzing the characteristic quantities of flow velocity is beneficial in determining the location and placement of turbines for the subsequent development of tidal current energy. The following parameters are defined in this study: average flood tide flow velocity (Vf, unit: m s−1), average ebb tide flow velocity (Ve, unit: m s−1), average flow velocity (Vv, unit: m s−1), and maximum flow velocity (Vm, unit: m s−1). Placing tidal current generators at locations with strong asymmetry in tidal current velocities will affect local sediment transport (Neill et al., 2009) and have many adverse effects on the local ecological environment. Therefore, we also need to pay attention to the asymmetry of local tidal current velocities (Iglesias, 2012) during calculation. In this study, av is used to represent the asymmetry of local tidal current velocities and can be calculated by Eq. (9):
| $ {a_v} = \left| {1 - \frac{{{V_e}}}{{{V_f}}}} \right|. $ | (9) |
The calculation results for the characteristic quantities of specific channel tidal currents are summarized in Table 2.
|
|
Table 2 Characterization of flow rates in specific channels |
Table 2 shows that the flow velocities in all nine channels have a certain degree of asymmetry. The Changshan Channel, Beituoji Channel, Houji Channel, and Gaoshan Channel have strong asymmetry in their flow velocities of 0.32, 0.36, 0.21, and 0.25, respectively. Therefore, the tidal current energy development in these four channels has a substantial probable effect on the natural environment in the area (Bedard et al., 2005). In addition, the power generation equipment of tidal current power stations generally starts when the flow velocity is greater than 0.8 m s−1. As shown in the table, only the Changshan Channel, Daqin Channel, Xiaoqin Channel, and Laotieshan Channel in the Bohai Strait area have maximum flow velocities exceeding 0.8 m s−1. Therefore, only these four channels may be suitable for building tidal current generators and may have remarkably development value.
4.2 Calculation of Energy Flow DensityTidal current energy flow density P, also known as power density, is the tidal current energy density per unit time passing through the unit flow area. It is an important indicator for measuring tidal current energy resources (Ko et al., 2018).
| $ P = \frac{1}{2}\rho {v^3}, $ | (10) |
where ρ is the seawater density, which is related to factors such as sea area, season, and water temperature and can generally be taken as ρ = 1024 kg m−3; and v is the sea current velocity. The maximum energy flow density Pmax can be calculated as
| $ {P_{\max }} = \frac{1}{2}\rho v_{\max }^3, $ | (11) |
where vmax is the maximum sea current velocity during a certain period.
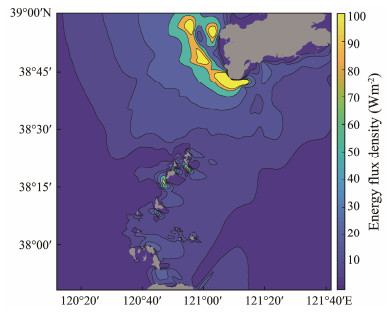
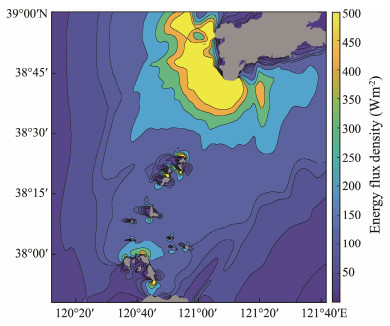
The distribution of the average and maximum energy flow densities in the Bohai Strait is shown in Figs.13 and 14. Overall, the energy flow density in the northern channels is higher than that in the southern channels. Channels with large energy flow densities, including Beituoji Channel, Daqin Channel, Xiaoqin Channel, and Laotieshan Channel, have average energy flow densities between 30 and 60 W m−2. The local average energy flow densities of these four channels can reach 100 W m−2. Meanwhile, the local maximum energy flow densities of the Daqin Channel, Xiaoqin Channel, and Laotieshan Channel can exceed 500 W m−2.
|
Fig. 13 Distribution of the average energy density in the Bohai Strait. |
|
Fig. 14 Distribution of the maximum energy density in the Bohai Strait. |
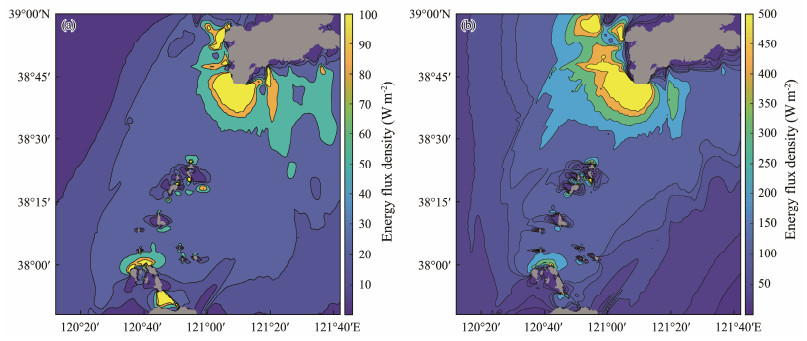
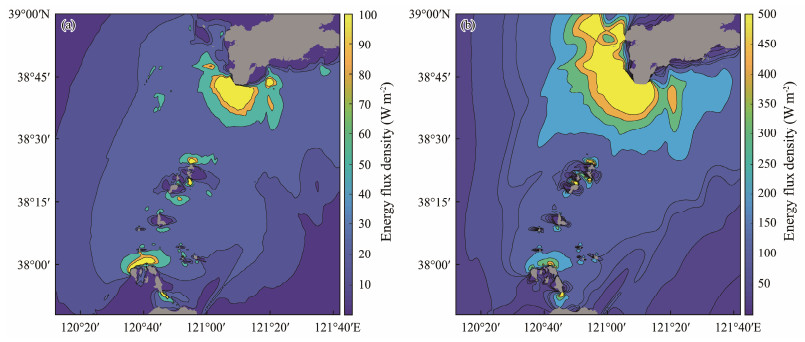
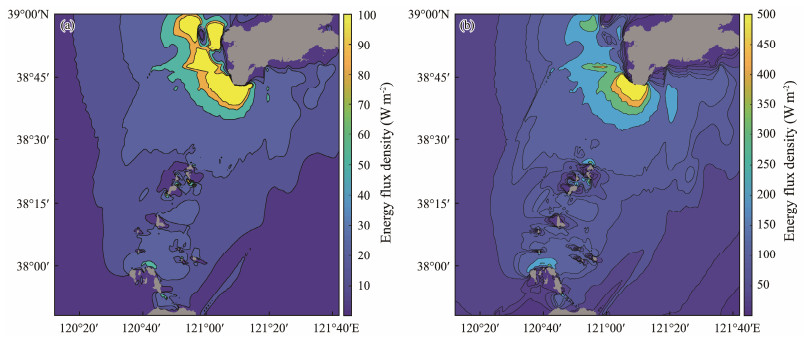
In accordance with the characteristic quantity definition of tidal current energy resources in the UK Marine Energy Network Geographic Information System Electronic Atlas and the tidal current energy resource assessment standards formulated by the European Marine Energy Center and the International Electrotechnical Commission (IEC) (Black and Veatch Consulting Ltd., 2009; IEC, 2015), the average and maximum energy flow densities during spring, neap and mean tides are selected to reflect the status of tidal current energy resources in the Bohai Strait at different times. The average and maximum energy flow densities during spring, medium, neap, and mean tides are energy flow density values corresponding to the average flow velocities and maximum flow velocities during spring, medium, neap and mean tides (consecutive three days) in the estimated month.
Figs.15, 16, and 17 show the distribution of average and maximum energy flow densities during spring, neap, and mean tides. The diagram illustrates the similar distribution of annual average energy flow densities in this sea during spring and neap tides, showing a trend of slightly low energy flow density in offshore areas and high energy flow density near shores and channels. Owing to the cubic relationship between energy flow density and flow velocity, the distribution of average and maximum energy flow densities during spring and neap tides is significantly larger than that during mean tide. The average energy flow density during spring tide in the Gaoshan Channel, Houji Channel, Nantuoji Channel, and Beituoji Channel is about 30 W m−2. Meanwhile, the average energy flow density in the Daqin Channel, Xiaoqin Channel, and Laotieshan Channel is about 70 W m−2 and can reach over 100 W m−2 locally. The maximum energy flow density in the Bohai Strait channels is basically around 200 W m−2 near each channel and can exceed 500 W m−2 in the local areas of the Daqin Channel, Xiaoqin Channel, and Laotieshan Channel.
|
Fig. 15 (a) Average energy density distribution during high tide in the Bohai Strait; (b) distribution of maximum energy density. |
|
Fig. 16 (a) Average energy density distribution during midtide in the Bohai Strait; (b) distribution of maximum energy density. |
|
Fig. 17 (a) Average energy density distribution during low tide in the Bohai Strait; (b) distribution of maximum energy density. |
The formula for calculating tidal current energy is as follows:
| $ {N_{{\text{total}}}} = PHD, $ | (12) |
where Ntotal is the tidal current energy potential (average power of tidal energy), P is the average energy flow density, H is the water depth of the channel cross-section, and D is the width of the channel cross-section. In the actual development of tidal current energy, we need to determine the developable amount of tidal current energy according to the actual situation of the sea and conduct thorough investigation and research.
The calculation formula for the development potential of tidal energy is as follows:
| $ {N_{{\text{asite}}}} = {N_{{\text{total}}}} \cdot SIF, $ | (13) |
where Nasite represents the development potential of tidal energy (annual average available power), and SIF represents the effective influence factor of the research area. The value of SIF depends on the location and has uncertainty. In accordance with the recommendation of the Electric Power Research Institute, this study selects SIF as 15%.
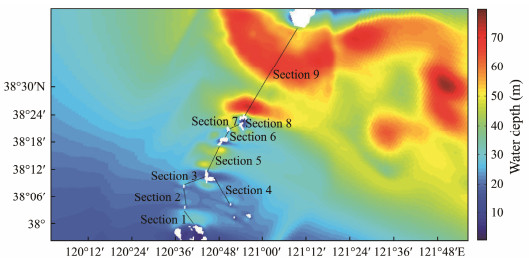
The tidal current energy potential in the Bohai Strait and nearby sea areas is abundant. Based on the previous analysis of flow velocity and energy flow density, we determine nine cross-sections as shown in Fig.18 and calculate the tidal current energy potential that can be developed in the corresponding channels.
|
Fig. 18 Channel section interception position. |
Table 3 shows that the Laotieshan Channel contains the largest amount of tidal current energy, reaching over 100000 kW. The exploitable amount of tidal energy in this channel is over 15000 kW, making it one of the most valuable channels for tidal energy development in the Bohai Strait. Next is the Xiaoqin Channel, which contains 6953 kW of tidal current energy and has an exploitable amount exceeding 1000 kW, indicating its certain value for tidal energy development. The Changshan Channel, Houji Channel, Gaoshan Channel, Nantuoji Channel, and Beituoji Channel contain more than 2000 or 3000 kW of tidal current energy, with exploitable amounts ranging from 300 kW to 600 kW. Their tidal energy potential is relatively small. The Daqin Channel and Huangcheng Channel have less than 1000 kW of tidal current energy, and the exploitable amounts are even less than 100 kW, indicating their limited usability. Therefore, the development of tidal current energy in the Daqin Channel or Huangcheng Channel is not recommended.
|
|
Table 3 Channel cross-sectional tidal energy storage |
The above results are based on the criterion of theoretical exploitable quantity. Nevertheless, various factors, such as local conditions, must be comprehensively considered when establishing a tidal energy power station in practice. Determining whether to establish a tidal energy power station should not be solely limited to this criterion.
6 DiscussionEstimating the energy potential of a specific location is crucial for the development of tidal current energy. Existing methods can be roughly divided into two categories: those based on energy flux and those based on the dynamic analysis of tidal flow equations. The former includes flux and farm, and the latter was proposed by Garrett and Cummins (2005). Unfortunately, its application is not yet widespread. The flux evaluation method is currently widely used by researchers in various countries. This method only considers the flow passing through and the SIF, making it a relatively simple evaluation method. The farm method, also known as the ‘array approach’, assumes multiple units installed in the tidal channel and calculates their total power generation. The result depends on the efficiency of the units and the array configuration. Black and Veatch (2004) argued that the farm method tends to overestimate the exploitable amount of tidal energy. Therefore, the present study adopts the flux evaluation method. Although the selection of SIF data can have some impact on the assessment of tidal energy resources, the SIF values chosen based on experience are reasonable and realistic. This advantage further supports the selection of the flux method.
In this study, Delft3D is used to numerically simulate the hydrodynamics in the Bohai Strait, and the flux method is applied to assess the tidal energy in this region. Many scholars have widely used the flux method for tidal energy assessment. Wu et al. (2021) and Li et al. (2013) used the flux method to evaluate the tidal energy resources near the Zhoushan Islands and Chengshantou, respectively. Their assessment revealed that the waters near the Zhoushan Islands have abundant tidal energy resources, and those near Chengshantou also have considerable tidal energy resources. The tidal energy resources in the various channels of the Bohai Strait are also significant; however, research on the major channels in the Bohai Strait is lacking. Therefore, the present study selects nine channels in the Bohai Strait to evaluate their tidal energy resources (Liu et al., 2011). The results show that the Laotieshan Channel has the most abundant tidal energy resources, surpassing other channels in the Bohai Strait by more than one order of magnitude. The remaining channels, such as the Beituoji Channel and Xiaoqin Channel, also contain rich tidal energy resources.
This study only considers the theoretically exploitable tidal energy resources in the sea without accounting for other nonnatural factors that may affect the channels. In the practical construction of tidal power stations, the exploitable tidal energy in the sea area is just one important indicator, not the only factor to consider, for assessing the suitability of establishing a power station. In addition, we also need to consider other practical uses of the channels in the sea. Further exploration of the economic feasibility of building tidal power stations in the local area is necessary (Nash and Phoenix, 2017).
7 ConclusionsIn this study, the numerical simulation of hydrodynamics in the Bohai Strait is carried out with Delft3D. The following conclusions are drawn:
1) The flow direction of the rise and fall of tides near the Miaodao Archipelago sea area is constrained by topography. The flow direction is basically consistent with the tides’ rise and fall routes and channel topography. The overall water flow in the channel is reciprocating flow.
2) On the basis of the energy flow density alone, the distribution of energy flow density in the Bohai Strait shows a trend of slightly low energy flow density in offshore areas and high energy flow density near shores and channels. The Xiaoqin Channel and Laotieshan Channel have larger energy flow densities and contain a larger amount of tidal current energy than the other channels.
3) In terms of overall tidal current energy potential, the Xiaoqin Channel and Laotieshan Channel exhibit a larger amount of tidal current energy than the other channels. In particular, the tidal current energy in the Laotieshan Channel is significantly higher than that in the other channels by more than an order of magnitude. Therefore, this channel has the largest tidal current energy potential in the Bohai Strait.
AcknowledgementsThis study is supported by the Yantai Science and Technology Innovation Project (No. 2023JCYJ097), and the National Natural Science Foundation of China (No. 51909114).
Bedard, R., Previsic, M., Siddiqui, O., Hagerman, G., and Robinson, M., 2005. Survey and Characterization: Tidal in Stream Energy Conversion (TISEC) Devices. Report by Electric Power Research Institute (EPRI). Report No. EPRI-TP-004 NA.
(  0) 0) |
Black and Veatch Consulting Ltd.,, 2004. UK, Europe, and global tidal energy resource assessment. The European Marine Energy Centre Ltd., London, 05-1.
(  0) 0) |
Black and Veatch Consulting Ltd.,, 2009. Assessment of tidal energy resource. The European Marine Energy Centre Ltd., London, 16-19.
(  0) 0) |
Burić, M., Grgurić, S., Mikulčić, H., and Wang, X., 2021. A numerical investigation of tidal current energy resource potential in a sea strait. Energy, 234: 121241. DOI:10.1016/j.energy.2021.121241 (  0) 0) |
Campbell, R., Martinez, A., Letetrel, C., and Rio, A., 2017. Methodology for estimating the French tidal current energy resource. International Journal of Marine Energy, 19: 256-271. DOI:10.1016/j.ijome.2017.07.011 (  0) 0) |
Chowdhury, M. S., Rahman, K. S., Selvanathan, V., Nuthammachot, N., Suklueng, M., Mostafaeipour, A., et al., 2021. Current trends and prospects of tidal energy technology. Environment, Development and Sustainability, 23: 8179-8194. DOI:10.1007/s10668-020-01013-4 (  0) 0) |
Cowles, G. W., Hakim, A. R., and Churchill, J. H., 2017. A comparison of numerical and analytical predictions of the tidal stream power resource of Massachusetts, USA. Renew Energy, 114: 215-228. DOI:10.1016/j.renene.2017.05.003 (  0) 0) |
Defne, Z., Haas, K. A., and Fritz, H. M., 2011. Numerical modeling of tidal currents and the effects of power extraction on estuarine hydrodynamics along the Georgia coast, USA. Renewable Energy, 36(12): 3461-3471. DOI:10.1016/j.renene.2011.05.027 (  0) 0) |
Fouz, D. M., Carballo, R., López, I., and Iglesias, G., 2022. Tidal stream energy potential in the Shannon Estuary. Renew Energy, 185: 61-74. DOI:10.1016/j.renene.2021.12.055 (  0) 0) |
Gao, F., Li, G. X., and Qiao, L. L., 2012. Resource assessment of the tidal energy around the Shandong Peninsula. Periodical of Ocean University of China, 42(12): 91-96 (in Chinese with English abstract). (  0) 0) |
Gao, J., Shi, H., Zang, J., and Liu, Y., 2023. Mechanism analysis on the mitigation of harbor resonance by periodic undulating topography. Ocean Engineering, 281: 114923. DOI:10.1016/j.oceaneng.2023.114923 (  0) 0) |
Garrett, C., and Cummins, P., 2004. Generating power from tidal currents. Journal of Waterway, Port, Coastal, and Ocean Engineering, 130(3): 114-118. DOI:10.1061/(ASCE)0733-950X(2004)130:3(114) (  0) 0) |
Garrett, C., and Cummins, P., 2005. The power potential of tidal currents in channels. Proceedings of the Royal Society A: Mathematical, Physical and Engineering Sciences, 461(2060): 2563-2572. DOI:10.1098/rspa.2005.1494 (  0) 0) |
Guillou, N., Neill, S. P., and Robins, P. E., 2018. Characterising the tidal stream power resource around France using a high-resolution harmonic database. Renew Energy, 123: 706-718. DOI:10.1016/j.renene.2017.12.033 (  0) 0) |
He, W. U., Wang, X., and Han, L. S., 2013. Assessment of extractable energy of tidal current at Chengshantou Cape. Oceanologia et Limnologia Sinica, 44(2): 570-576. (  0) 0) |
Hwang, S. J., and Jo, C. H., 2019. Tidal current energy resource distribution in Korea. Energies, 12: 4380. DOI:10.3390/en12224380 (  0) 0) |
Iglesias, G., Sánchez, M., Carballo, R., and Fernández, H., 2012. The TSE index – A new tool for selecting tidal stream sites in depth-limited regions. Renew Energy, 48(7): 350-357. (  0) 0) |
International Electrotechnical Commission (IEC), 2015. Marine energy – Wave, tidal and other water current converters – Part 201: Tidal energy resource assessment and characterization. International Electrotechnical Commission, London, 201-246.
(  0) 0) |
Ko, D. H., Chung, J., Lee, K. S., Park, J. S., and Yi, J. H., 2019. Current policy and technology for tidal current energy in Korea. Energies, 12(9): 1807. DOI:10.3390/en12091807 (  0) 0) |
Ko, D. H., Park, J. S., and Lee, K. S., 2018. Assessment of tidal current energy potential at Uldolmok in the southwestern coast of Korea. Journal of Coastal Research, 85: 1301-1305. DOI:10.2112/SI85-261.1 (  0) 0) |
Legrand, C., 2009. Assessment of tidal energy resource: Marine renewable energy guides. European Marine Energy Centre, London, W4, 4AL.
(  0) 0) |
Li, Q., Zhou, L., Wu, K., Li, J., and Li, Z., 2013. Tidal stream energy assessment on Chengshantou. Transactions of Oceanology and Limnology, 2013(3): 10-18 (in Chinese with English abstract). (  0) 0) |
Liang, B., Shi, H., and Yang, L., 2012. Preliminary numerical estimates on tidal stream energy resources of the coastal areas of Shandong Peninsula. The 22nd International Offshore and Polar Engineering Conference. OnePetro, 138-143.
(  0) 0) |
Liu, H., Ma, S., and Li, W., 2011. A review on the development of tidal current energy in China. Renewable and Sustainable Energy Reviews, 15(2): 1141-1146. DOI:10.1016/j.rser.2010.11.042 (  0) 0) |
Liu, X., Yuan, P., and Wang, S., 2019. Simulation study of potential impacts of tidal farm in the eastern waters of Chengshan Cape, China. Journal of Ocean University of China, 18: 1041-1050. DOI:10.1007/s11802-019-3975-6 (  0) 0) |
Lv, X., and Guo, P. F., 2011. Review of tidal energy resource development in China. Transactions of Oceanology and Limnology, 2011(1): 26-30 (in Chinese with English abstract). (  0) 0) |
Lv, X. G., and Qiao, F. L., 2008. Research progress on estimation methods of ocean tidal energy resources. Advances in Marine Science, 26(1): 98-108 (in Chinese with English abstract). (  0) 0) |
Melikoglu, M., 2018. Current status and future of ocean energy sources: A global review. Ocean Engineering, 148: 563-573. DOI:10.1016/j.oceaneng.2017.11.045 (  0) 0) |
Nash, S., and Phoenix, A., 2017. A review of the current understanding of the hydro-environmental impacts of energy removal by tidal turbines. Renewable and Sustainable Energy Reviews, 80: 648-662. DOI:10.1016/j.rser.2017.05.289 (  0) 0) |
Neill, S. P., Litt, E. J., Couch, S. J., and Davies, A. G., 2009. The impact of tidal stream turbines on large-scale sediment dynamics. Renewable Energy, 34(12): 2803-2812. DOI:10.1016/j.renene.2009.06.015 (  0) 0) |
Neill, S. P., Vgler, A., and Goward-Brown, A. J., 2017. The wave and tidal resource of Scotland. Renewable Energy, 114: 3-17. DOI:10.1016/j.renene.2017.03.027 (  0) 0) |
Pörtner, H. O., Roberts, D. C., and Masson-Delmotte, V., 2019. Special Report on the Ocean and Cryosphere in a Changing Climate. IPCC Intergovernmental Panel on Climate Change, Geneva, Switzerland, 1 (3): 163-173.
(  0) 0) |
Segura, E., Morales, R., and Somolinos, J. A., 2017. Techno-economic challenges of tidal energy conversion systems: Current status and trends. Renewable and Sustainable Energy Reviews, 77: 536-550. DOI:10.1016/j.rser.2017.04.054 (  0) 0) |
Shi, H., Cao, X., Li, Q., Li, D., Sun, J., You, Z., et al., 2021. Evaluating the accuracy of ERA5 wave reanalysis in the water around China. Journal of Ocean University of China, 20: 1-9. DOI:10.1007/s11802-021-4496-7 (  0) 0) |
Shi, H., Zhang, X., Du, W., Li, Q., Qu, H., and You, Z., 2022. Assessment of wave energy resources in China. Journal of Marine Science and Engineering, 10(11): 1771. DOI:10.3390/jmse10111771 (  0) 0) |
Soukissian, T. H., Karathanasi, F. E., and Zaragkas, D. K., 2021. Exploiting offshore wind and solar resources in the Mediterranean using ERA5 reanalysis data. Energy Conversion and Management, 237: 114092. DOI:10.1016/j.enconman.2021.114092 (  0) 0) |
Vazquez, A., and Iglesias, G., 2016. A holistic method for selecting tidal stream energy hotspots under technical, economic and functional constraints. Energy Conversion and Management, 117: 420-430. DOI:10.1016/j.enconman.2016.03.012 (  0) 0) |
Wang, C. K., and Lu, W.,, 2009. Ocean Energy Resources Analysis Method and the Evaluation of the Reserves. China Ocean Press, Beijing, 153pp.
(  0) 0) |
Wen, Y., and Lin, P., 2022. Exploitation potential of tidal current energy in southern China seas. Energy Conversion and Management, 267: 115901. DOI:10.1016/j.enconman.2022.115901 (  0) 0) |
Willmott, C., 1981. On the validation of models. Physical Geography, 2(2): 184-194. DOI:10.1080/02723646.1981.10642213 (  0) 0) |
Wu, H., Yu, H., Ding, J., and Yuan, D., 2016. Modeling assessment of tidal current energy in the Qiongzhou Strait, China. Acta Oceanologica Sinica, 35: 21-29. (  0) 0) |
Wu, H., Yu, H., Fang, Y., Zhou, Q., Zhuo, F., and Kelly, R. M., 2021. Assessment of the tidal current energy resources and the hydrodynamic impacts of energy extraction at the PuHu Channel in Zhoushan Archipelago, China. Journal of Ocean University of China, 20: 478-488. DOI:10.1007/s11802-021-4767-3 (  0) 0) |
Xia, H., Wang, X., Shi, J., Jia, N., and Duan, Y., 2022. Research on analysis method of tidal current energy resource characteristics. Marine Technology Society Journal, 56(6): 10-17. DOI:10.4031/MTSJ.56.6.5 (  0) 0) |
Yang, L. L., 2012. Assessment of tidal current energy resources in Shandong Peninsula. Master thesis. Ocean University of China.
(  0) 0) |
Yuan, S., Yuan, P., Si, X., Liu, X., Tan, J., and Wang, S., 2022. Assessment of tidal current energy in Bohai Sea and Yellow Sea, China. Indian Journal of Geo-Marine Sciences (IJMS), 50(6): 445-453. (  0) 0) |
Zhang, D., Wang, J., Lin, Y., Si, Y., Huang, C., Yang, J., et al., 2017. Present situation and future prospect of renewable energy in China. Renewable and Sustainable Energy Reviews, 76: 865-871. DOI:10.1016/j.rser.2017.03.023 (  0) 0) |
Zhang, X., Shi, H., Liu, Z., Li, H., Xing, H., and Wang, L., 2022. The response of Chudao’s beach to typhoon ‘Lekima’ (No. 1909). Open Geosciences, 14(1): 813-823. DOI:10.1515/geo-2022-0394 (  0) 0) |
Zheng, Z., 1987. Estimation formula of ocean tidal energy. Journal of Harbin Institute of Ship Engineering, 6(2): 37-44 (in Chinese with English abstract). (  0) 0) |
 2024, Vol. 23


