The South China Sea is a frequent-occurrence area of internal solitary waves (ISWs) globally that covers the process of the generation, propagation, dissipation, and extinction of the ISWs. Multiple methods have been used to investigate the ISWs in the South China Sea (Alford et al., 2015; Zhang et al., 2018; Chen et al., 2019; Xu et al., 2020). Among the various methods, in-situ detection provides first-hand information for the study of ISWs, which significantly promotes the in-depth understanding of the ISW characteristics (Ramp et al., 2004; Xu et al., 2010; Lin et al., 2014; Rivera-Rosario et al., 2020). Therefore, developing an in-situ detection method with high accuracy, simplicity, low cost, and superior performance is important.
The Asian Seas International Acoustics Experiment (ASI-AEX) from 2000 to 2001 was a famous in-situ detection program for ISWs. In the ASIAEX, a wealth of measured values of ISWs were obtained, which provided valuable data for the study of ISWs in the South China Sea, and a series of results were obtained (Lynch et al., 2004; Liu et al., 2005). Alford et al. (2010) proposed Nonlinear Internal Waves Initiative (NLIWI) in the South China Sea from 2006 to 2007. Fourteen ISWs were observed and analyzed in 10 sites from April 26 to May 7, 2007. Fu et al. (2012) detected ISWs in the Dongsha Island from May 5 to 7, 2008, and studied the shoaling of large-amplitude ISWs using the measured vertical temperatures at five sites. In recent years, Huang and Tian have also detected many ISWs in the South China Sea (Huang et al., 2014, 2016, 2017). The in-situ detection of ISWs in the ocean was mainly carried out by the chain structure of multiple CTDs, temperature sensors, and ADCPs. The electrical temperature sensor is based on platinum resistance or thermistor to measure temperature. The ISW is a mesoscale ocean phenomenon whose crest is several kilometers long and spreads hundreds of kilometers. To obtain the global information of ISWs requires in-situ data at multiple places. The measurement system based on existing electrical sensing technique is expensive, large in size, difficult to deploy, and limited in spatial resolution (Chen et al., 2020). Therefore, we developed a measurement system based on optical fiber remoted sensing technique with a high spatial resolution, low cost, and simplicity for detecting ISWs in the ocean.
Compared with electrical methods, optical methods have not yet become the mainstream technology for ocean surveys. Due to its multiple advantages, the optical fiber sensing has gradually become a research hotspot in ocean survey technology (Wang et al., 2018; Liu et al., 2019; Liao et al., 2020). Especially, the optical fiber sensor does not contain the built-in circuit and battery, reducing manufacturing costs and avoiding the risk of water leakage (Goes et al., 2015). The structure developed in the bathymetry and temperature measurement is mainly composed of a CTDs with multiple fiber gratings in series, expendable fiber bathythermograph, and towed sensor chain cascaded by hundreds of gratings. Marrec et al. (2005) used fiber Bragg grating (FBG) and long-period fiber grating (LPFG) to build an underwater monitoring system with a multi-sensor array. The system has been used for the in-situ and realtime measurement of ocean physical parameters in a large area (Marrec et al., 2005). Wang et al. (2017) used a sensor chain composed of hundreds of cascaded fiber Bragg gratings to successfully observe the edges and centers of mesoscale vortices in the South China Sea. In contrast, the CTDs in the same area failed to detect the phenomenon due to the sparse observation sites and low spatial resolution. The advantages of optical fiber sensors make them demonstrate the great application potential in the ocean exploration.
In summary, the application of the distributed fiber temperature measurement method based on the stimulated Raman scattering effect to detecting ISWs in the ocean has not been reported yet. This paper proposes a new method based on distributed optical fiber sensors with a high spatial resolution for in-situ detecting of ISWs, which is significant for measuring vertical ocean temperatures and monitoring the dynamic phenomena.
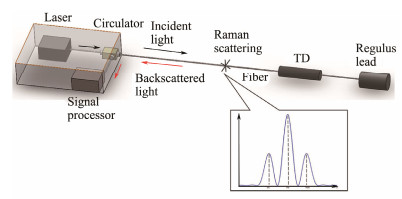
2 TheoryBecause ISWs occur randomly in the ocean, it is difficult to determine the passage time of ISWs in a specific position. Usually, the ISWs in the ocean are detected by the variation of vertical temperatures for a long time at a fixed site, which is very strict to the requirements of the sensors. The experimental measurement system comprises a doublecore optical cable, an interrogator, and a temperature-depth sensor (TD), as shown in Fig. 1.
|
Fig. 1 Schematic diagram of the principle for the ISW measurement. |
The measurement principle is based on the backward stimulated Raman scattering and optical time domain reflection (OTDR). Specifically, pulsed laser, Raman wavelength division multiplexer, photoelectric detector, synchronous clock, data acquisition unit, and accumulator are integrated into the interrogator (Fig. 1). The pulsed light emitted by the laser enters the fiber sensor, and the stimulated Raman scattered light is generated due to the nonlinear effect. The stimulated Raman scattered light transmitted in the backward direction includes Stokes light and anti-Stokes light, received by the photodetector respectively. The intensity of the anti-Stokes light is extremely sensitive to the changes in the ambient temperature of the optical fiber, so it can be used to measure the ambient temperature. Stokes light is used as a reference light to eliminate measurement errors caused by light intensity attenuation, fluctuations of the light source, and insertion loss. The ambient temperature measured by the system satisfies the Eq. (1).
| $ R\left(T \right) = \frac{{{I_{{\text{as}}}}}}{{{I_{\text{s}}}}} = \frac{{\lambda _{{\text{as}}}^4}}{{\lambda _{\text{s}}^4}}\exp \left({ - \frac{{{\text{h}}c\Delta \gamma }}{{{\text{k}}T}}} \right), $ | (1) |
where λs and λas are the wavelengths of Stokes light and anti-Stokes light, h is the Planck constant, c is the speed of light, k is the Boltzmann's constant, T is the absolute temperature, and ∆γ is the Raman frequency shift. The positioning of the system used OTDR technology. Assuming that the pulse laser is emitted from the starting point of fiber sensor, the time to return to the starting point after backscattering is 2t. The distance travelled by the laser pulse in the period of 2t is L, then
| $ L = 2ct/n, $ | (2) |
where c is the speed of light propagation in vacuum, and n is the effective refractive times of the fiber core. Therefore, as the time t is measured, the one-way distance L/2 could be calculated. Then the position corresponding to the temperature measurement could be obtained. The self-developed experimental measurement system requires 7.4 s to collect a temperature profile signal, and the spatial resolution is 1 m. Optical fiber needs long time to be deployed in the sea, but the data can be continuously collected to obtain the vertical temperature distribution at a specific location.
3 Measurement System of ISWWe designed a shipborne measurement system of ISWs based on the distributed optical fiber. Compared with previous measurement methods, the system can detect ISWs more accurately.
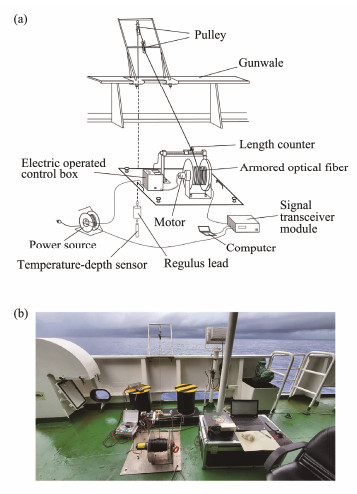
3.1 System DesignThe measuring system is composed of the spooling winch, armored optical cable, signal transceiver module, wire wheel module, feeding module, and measuring module, as shown in Fig. 2. The spooling winch is fixed to the afterdeck of the ship and equipped with a wire wheel. The wire wheel is cylindrical with a bearing at each end. The signal transceiver module is connected with armored optical cable, including a transmitter, a receiver, and a computer. The computer collects the data measured by the optical fiber by connecting the USB cable with the signal transmitting receiver. The line wheel module consists of the motor and remote control. An electric motor is installed at one end of the wire wheel to rotate the wire wheel. The remote control is used to control the motor to drive the line wheel and deliver fibers. A counting device is installed on the wire wheel control module to record the length of fiber. The cables pass around two pulleys on a bracket to reduce the friction. During the measurement, the lead weight is fixedly connected with the end of the armored cable. A temperaturedepth calibrator is mounted below the lead weight. The TD sensor and regulus lead are connected with the end of armored optical cable.
|
Fig. 2 Schematic diagram of the shipboard experimental measurement system (a) and profile display (b). |
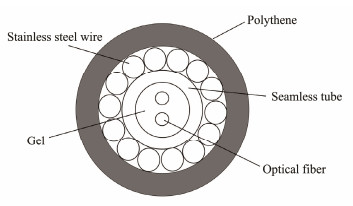
The armored optical cable includes the polythene shell, stainless steel wire, seamless tube and optical fiber, as shown in Fig. 3. A total of 500 m of armored optical cables are used in the measuring system. The outer diameter of armored optical cable is 3.5 mm, the allowed tensile force is more than 7500 N, the compressive strength is more than 35 MPa, and the operating temperature is −40℃ to +85℃.
|
Fig. 3 Schematic diagram of the armored optical cable. |
The relationship between the water depth and the length of the armored cable should be determined because the armored cable will incline and bend due to waves and currents. Therefore, the length of the cable is not representative of the actual water depth. The nonlinear relationship between the water depth and cable length was fitted based on a large number of temperature and depth data obtained by the TD sensors, as shown in Eq. (3).
| $D = 7.4453 \times {10^{ - 9}} \times L{e^4} - 4.8965 \times {10^{ - 6}} \times L{e^3}\\ \;\;\;\;\;\; + 5.8807 \times {10^{ - 4}} \times L{e^2} + 0.7634 \times Le - 74.2084, $ | (3) |
where D is the depth of seawater, Le is the length of armored cable. The vertical temperature profile of seawater changes because of the propagation of ISWs. The amplitude of ISW can be obtained according to the time series of the corrected temperature and depth data.
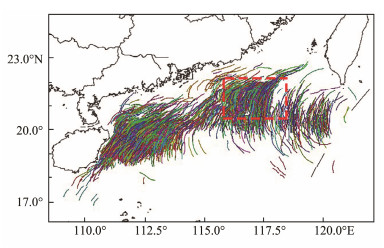
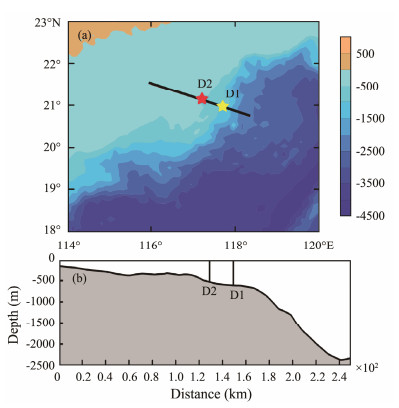
4 Results and DiscussionLarge-scale ISWs are often detected in the South China Sea, such as the one with an amplitude of 240 m detected by Lynch et al. (2004). As shown in Fig. 4, the spatial distribution of ISWs in the northern South China Sea was obtained by collecting multi-source remote sensing images for many years. We found that the ISWs propagate in the northwest direction. This is because barotropic tides from the Pacific Ocean propagate westward and interact with the complex topography as they pass through the two ridges of the Luzon Strait. Due to the complex topography of the South China Sea, the whole process of generation, propagation, and dissipation of ISWS can be detected, making the South China Sea a common area for the research of ISWs. In this paper, the vicinity of Dongsha Island in the South China Sea (red dotted box in Fig. 4) was selected as the area of measurement. The bathymetry of the measurement area is shown in Fig. 5.
|
Fig. 4 Spatial distribution of ISWs in the northern South China Sea based on multi-source remote sensing images for many years. |
|
Fig. 5 Bathymetry of the study area (a) and the terrain profile crossing the measurement sites (b). The experimental measurement systems were deployed at site D1 and D2. |
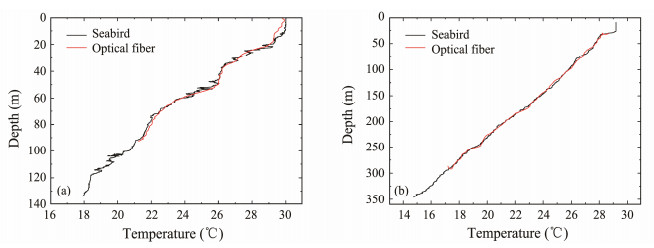
The optical cable and Seabird CTDs were synchronously dropped into seawater of 100 and 350 m deep, respectively. As shown in Fig. 6, the measurement results of distributed optical fiber sensors are consistent with those of Seabird CTDs, which indicates that the measurement accuracy of distributed optical fiber sensors can meet the requirements of ISW detection.
|
Fig. 6 Vertical temperature curves of seawater above 100 m (a) and 350 m (b) obtained by the experimental measurement system and Seabird CTD. |
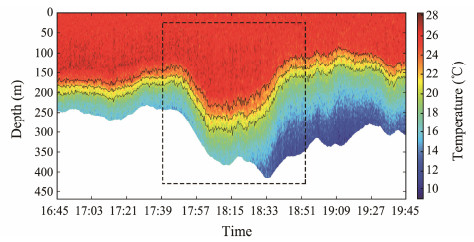
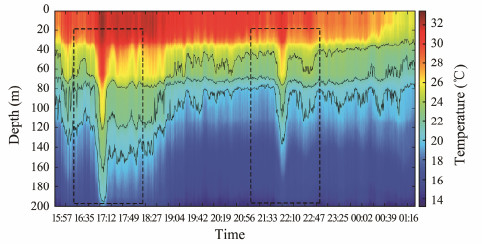
The measurement system was initially deployed at 117.62˚E, 20.99˚N (D1) from 9:12 to 20:47, on December 10, 2020 (GMT+8). The length of the fiber into the water is about 470 m. The corresponding depth of the temperature measuring fiber was nonlinearly corrected by the depth measured by TD sensors. The corrected vertical temperature profile measured by the optical fiber is shown in Fig. 7. After the continuous measurement of 11 h and 35 min, a large-amplitude internal solitary wave was found between 17:49 and 18:40 (GMT+8). The maximum amplitude of the internal solitary wave appeared at about 18:13 (GMT+8), about 109 m. Then, the measurement system was deployed at 117.15˚E, 21.16˚N (D2) for continuously detecting on May 18, 2021 (GMT+8). Two groups of ISWs with amplitudes of 79 m and 50 m were detected (shown in Fig. 8).
|
Fig. 7 Time series of vertical temperature distribution obtained by experimental measurement system at the site D1. |
|
Fig. 8 Time series of vertical temperature distribution obtained by experimental measurement system at the site D2. |
We collected two optical remote sensing (MODIS and GF-1) images on May 18, 2021 to verify the measured ISWs, as shown in Fig. 9. The phase speed of the ISW (in blue dotted box in Fig. 9) is 1.71 m s−1, calculated by the distance of the same ISW in the two images. We found that the ISW (in blue dotted box) in the GF-1 image propagated to the measurement site after 6.9 h and as detected by the distributed fiber temperature measurement system at 16:35 (GMT+8). Therefore, the ISWs detected by the system is reliable.
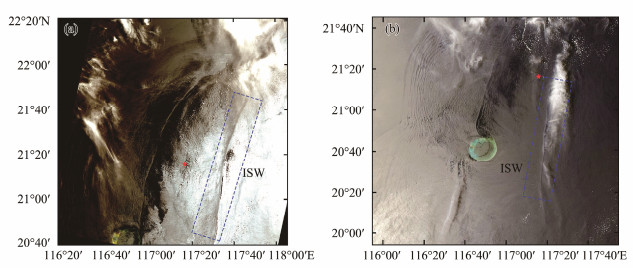
|
Fig. 9 GF-1 image (a) acquired at 10:48 (GMT+8) and MODIS image (b) acquired at 11:30 (GMT+8) on 18 May, 2021. The blue dotted boxes mark the detected ISWs. The red pentagrams mark the measurement sites. |
The transit time of the MODIS on Terra is 11:30 am (GMT+8), which is most close to the arriving time of the detected ISWs. In Fig. 10, three ISW packets propagate northwest, and the Packet 2 interacts with Dongsha Island and is refracted. We obtained the wave packet spacing between three wave train sets, 72.20 km (Packet 2 – Packet 3) and 61.76 km (Packet 1 – Packet 2), respectively. Cai et al. (2014) used the finite-depth theory to calculate the phase velocity of multiple ISWs in the South China Sea, which is about 1.75 – 2.25 m s−1 near Dongsha Island. Therefore, assuming that the propagation velocities of three ISWs are all 1.71 m s−1, the time interval of ISW1 and ISW2 is 10.03 h, and the time interval of ISW2 and ISW3 is 11.73 h. It can be judged that the three ISW trains in the image are generated by semi-diurnal tide, which is also consistent with the study of Vlasenko et al. (2012).
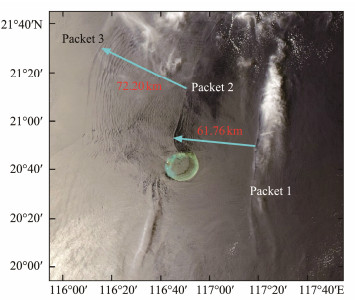
|
Fig. 10 Three ISWs and wave spacing in the MODIS image on May 18, 2021. |
In the ocean, internal tide (IT) created by the barotropic tide can be excited to generate ISWs under certain conditions. The seabed topography of the South China Sea is complex and is prone to ITs and ISWs.
The sources of ISWs near Dongsha Island mainly include the Hengchun Ridge, Balintang Channel and Babuyan Channel (Wang et al., 2011). It can be found that the detected ISW in Fig. 11a is generated in Balintang Channel. We use the TPXO software to obtain the semi-diurnal tidal current velocity data of the Balintang Channel, as shown in Figs. 11b and 11c. It can be found that the amplitude of tidal current velocity on December 10, 2020 is 11 cm s−1 and that on May 18, 2021 is 8 cm s−1. The amplitude of ISW detected on December 10, 2020 is 109 m, and the amplitude of ISW detected on May 18, 2021 is 79 m. Therefore, for the ISWs generated by the semi-diurnal tides, the impact of the amplitude of tidal current velocity on the amplitude of ISW is undeniable.
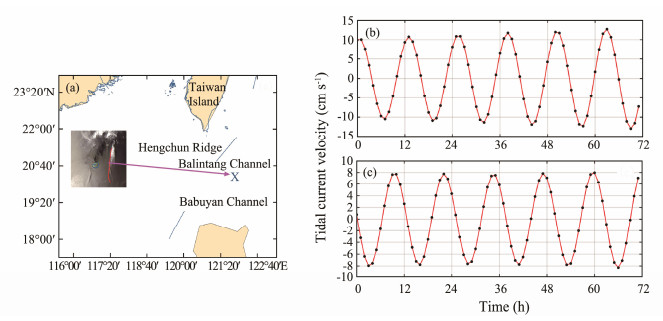
|
Fig. 11 Luzon Strait and MODIS image on May 18, 2021 (a), semi-diurnal tidal current velocity curves from December 9 to 11, 2020 (b) and from May 17 to 19, 2021 (c). |
Based on the stimulated Raman scattering effect, we use an optical fiber to detect ISWs in the ocean for the first time. The experimental measurement system consists of a photoelectric demodulator, metal-clad optical fibers, and TD sensors, which takes 7.4 s to obtain a data set. The spatial resolution of the system can reach 1.0 m, and the accuracy of temperature measurement is 0.2℃. Therefore, we proposed a new and straightforward method to improve the accuracy of the ISW measurement. This approach is demonstrated to be reliable from the tests of sea trials and optical remote sensing images. Compared with traditional detection methods, the system is high precision, low cost, and easy operation.
In the sea trials, we successfully detected 3 ISWs in the north of Dongsha Island. To verify and analyze the characteristics of the detected ISWs, we collected two optical remote sensing images on the same day of two ISWs. The image pairs method was used to calculate the phase velocity of ISW, which is 1.71 m s−1. By calculating the propagation time of the ISWs, it is confirmed that the ISWs in remote sensing images are the same ISWs detected by our system and the system can detect ISWs in the ocean efficiently. Then, we use the TPXO software to obtain the semi-diurnal tidal current velocity data of the Balintang Channel. It is worth noting that the semi-diurnal tide generates the detected ISWs and the amplitude of tidal current velocity determines the ISW amplitude.
The temperature measurement system of distributed optical fiber based on stimulated Raman scattering has a good application prospect in the measurement of vertical ocean temperature variation and mesoscale dynamic phenomenon.
AcknowledgementsThe authors would like to thank the National Natural Science Foundation of China (Nos. 61871353, 62031005) for supports. We thanks the Technology Innovation Center for Ocean Telemetry of Ministry of Natural Resources for providing sea trails.
Alford, M. H., Lien, R. C., Simmons, H., Klymak, J., Ramp, S., Yang, Y. J., et al., 2010. Speed and evolution of nonlinear internal waves transiting the South China Sea. Journal of Physical Oceanography, 40(6): 1338-1355. DOI:10.1175/2010JPO4388.1 (  0) 0) |
Alford, M. H., Peacock, T., Mackinnon, J. A., Nash, J. D., Buijsman, M. C., Centuroni, L. R., et al., 2015. The formation and fate of internal waves in the South China Sea. Nature, 521(7550): 65-69. DOI:10.1038/nature14399 (  0) 0) |
Cai, S. Q., Xie, J. S., Xu, J. X., Wang, D. X., Chen, Z. W., Deng, X. D., et al., 2014. Monthly variation of some parameters about internal solitary waves in the South China Sea. Deep-Sea Research Ⅰ, 84: 73-85. DOI:10.1016/j.dsr.2013.10.008 (  0) 0) |
Chen, L., Xiong, X. J., Zheng, Q. N., Yuan, Y. L., Yu, L., Guo, Y. L., et al., 2020. Mooring observed mode-2 internal solitary waves in the northern South China Sea. Acta Oceanologica Sinica, 39(11): 44-51. DOI:10.1007/s13131-020-1667-0 (  0) 0) |
Chen, L., Zheng, Q. A., Xiong, X. J., Yuan, Y. L., Xie, H. R., Guo, Y. L., et al., 2019. Dynamic and statistical features of internal solitary waves on the continental slope in the northern South China Sea derived from mooring observations. Journal of Geophysical Research: Oceans, 125(6): 4078-4097. (  0) 0) |
Fu, K. H., Wang, Y. H., St. Laurent, L., Simmons, H., and Wang, D. P., 2012. Shoaling of large-amplitude nonlinear internal waves at Dongsha atoll in the northern South China Sea. Continental Shelf Research, 37: 1-7. DOI:10.1016/j.csr.2012.01.010 (  0) 0) |
Goes, M., Goni, G., and Dong, S. F., 2015. An optimal XBT-based monitoring system for the South Atlantic meridional overturning circulation at 34˚S. Journal of Geophysical Research: Oceans, 120(1): 161-181. DOI:10.1002/2014JC010202 (  0) 0) |
Huang, X. D., Chen, Z. H., Zhao, W., Zhang, Z. W., Zhou, C., Yang, Q. X., et al., 2016. An extreme internal solitary wave event observed in the northern South China Sea. Scientific Reports, 6: 30041. DOI:10.1038/srep30041 (  0) 0) |
Huang, X. D., Zhang, Z. W., Zhang, X. J., Qian, H. B., Zhao, W., and Tian, J. W., 2017. Impacts of a mesoscale eddy pair on internal solitary waves in the northern South China Sea revealed by mooring array observations. Journal of Physical Oceanography, 47(7): 1539-1554. DOI:10.1175/JPO-D-16-0111.1 (  0) 0) |
Huang, X. D., Zhao, W., Tian, J. W., and Yang, Q. X., 2014. Mooring observations of internal solitary waves in the deep basin west of Luzon Strait. Acta Oceanologica Sinica, 33(3): 82-89. DOI:10.1007/s13131-014-0416-7 (  0) 0) |
Liao, Y. P., Wang, J., Yang, L., Wang, S. S., and Chen, X., 2020. In-situ detection for ocean internal solitary waves based on a miniaturized microfiber-optic salinity sensor. IEEE Sensors Journal, 20(24): 14836-14842. DOI:10.1109/JSEN.2020.3009731 (  0) 0) |
Lin, F. L., Hou, Y. J., Liu, Y. H., Fang, Y., and Hu, P., 2014. Internal solitary waves on the southwest shelf of Dongsha Island observed from mooring ADCP. Chinese Journal of Oceanology and Limnology, 32(5): 1179-1187. DOI:10.1007/s00343-014-3254-8 (  0) 0) |
Liu, A. K., Ramp, S. R., Zhao, Y. H., and Tang, T. Y., 2005. A case study of internal solitary wave propagation during ASIAEX 2001. IEEE Journal of Oceanic Engineering, 29(4): 1144-1156. (  0) 0) |
Liu, T. Q., Wang, J., Liao, Y. P., Yang, L., and Wang, S. S., 2019. Splicing point tapered fiber mach-zehnder interferometer for simultaneous measurement of temperature and salinity in seawater. Optics Express, 27(17): 23905-23918. DOI:10.1364/OE.27.023905 (  0) 0) |
Lynch, J. F., Ramp, S. R., Chin, C. S., Tang, T. Y., Yang, Y. J., and Simmen, J. A., 2004. Research highlights from the Asian seas international acoustics experiment in the South China Sea. IEEE Journal of Oceanic Engineering, 29(4): 1067-1074. DOI:10.1109/JOE.2005.843162 (  0) 0) |
Marrec, L., Bourgerette, T., Datin, E., Ferchaud, N., Pucel, B., Quetel, L., et al., 2005. In-situ optical fibre sensors for temperature and salinity monitoring. Europe Oceans 2005. Brest, 1276-1278.
(  0) 0) |
Ramp, S. R., Tang, T. Y., Duda, T. F., Lynch, J. F., Liu, A. K., Chiu, C. S., et al., 2004. Internal solitons in the northeastern South China Sea. Part Ⅰ: Sources and deep water propagation. IEEE Journal of Oceanic Engineering, 29(4): 1157-1181. DOI:10.1109/JOE.2004.840839 (  0) 0) |
Rivera-Rosario, G., Diamessis, P. J., Lien, R. C., Lamb, K. G., and Thomsen, G. N., 2020. Formation of recirculating cores in convectively breaking internal solitary waves of depression shoaling over gentle slopes in the South China Sea. Journal of Geophysical Research: Oceans, 50(5): 1137-1157. (  0) 0) |
Vlasenko, V., Guo, C. C., and Stashchuk, N., 2012. On the mechanism of a-type and b-type internal solitary wave generation in the northern South China Sea. Deep Sea Research Part Ⅰ Oceanographic Research Papers, 69: 100-112. DOI:10.1016/j.dsr.2012.07.004 (  0) 0) |
Wang, J., Huang, W. G., Yang, J. S., Zhang, H. G., and Pan, Y. F., 2011. The distribution, sources, and propagation of internal waves in South China Sea based on satellite remote sensing. 7th Symposium on Multispectral Image Processing and Pattern Recognition (MIPPR) – Remote Sensing Image Processing, Geographic Information Systems, and Other Applications. Guilin, 80062E.
(  0) 0) |
Wang, J., Liao, Y. P., Wang, S. S., and Wang, X., 2018. Ultrasensitive optical sensing in aqueous solution based on microfibre modal interferometer. Optics Express, 26(19): 24843-24853. DOI:10.1364/OE.26.024843 (  0) 0) |
Wang, Y. J., Wang, J. F., Ren, Q., Yu, F., and Li, F., 2017. Application of optical fiber temperature and pressure sensor in physical oceanography. Oceanologia et Limnologia Sinica, 48(6): 1480-1487. (  0) 0) |
Xu, J. X., He, Y. H., Chen, Z. W., Zhan, H. G., Wu, Y. Q., Xie, J. S., et al., 2020. Observations of different effects of an anti-cyclonic eddy on internal solitary waves in the South China Sea. Progress in Oceanography, 188: 102422. DOI:10.1016/j.pocean.2020.102422 (  0) 0) |
Xu, Z. H., Yin, B. S., Hou, Y. J., Fan, Z. S., and Liu, A. K., 2010. A study of internal solitary waves observed on the continental shelf in the northwestern South China Sea. Acta Oceanologica Sinica, 29(3): 18-25. DOI:10.1007/s13131-010-0033-z (  0) 0) |
Zhang, X., Huang, X., Zhang, Z., Zhou, C., and Wei, Z., 2018. Polarity variations of internal solitary waves over the continental shelf of the northern South China Sea: Impacts of seasonal stratification, mesoscale eddies, and internal tides. Journal of Physical Oceanography, 48(6): 1349-1365. DOI:10.1175/JPO-D-17-0069.1 (  0) 0) |
 2023, Vol. 22


