2) Research Institute of Petroleum Exploration & Development, Beijing 100080, China;
3) Qingdao DMAR Engineering Inc., Qingdao 266100, China;
4) Department of Offshore Oil and Gas Engineering, College of Petroleum Engineering, Xi'an Shiyou University, Xi'an 710000, China
With the rapid development of the marine engineering industry, more risers are used in offshore engineering. Due to the risers' interactions with wind, waves, and currents, a vortex from the risers leads to vortex-induced vibration at a certain flow velocity (Kwon et al., 2002). Different flow velocities result in different vortex shedding frequencies. When the vortex shedding frequency is approximately the natural frequency of risers, the vibration will be aggravated. This is called the lock-in phenomenon and it accelerates riser damage (Huang, 2013).
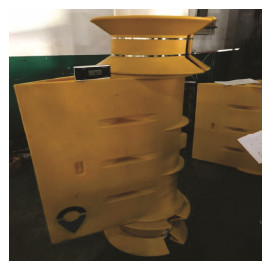
Currently, fairing and strakes are primarily used to suppress the vortex-induced vibration on risers in the offshore engineering industry (Lee et al., 2004). Bubble disturbing flow devices have been applied in risers, which can effectively suppress vortex-induced vibration and reduce dynamic load on the risers (Abbassian and Thanos, 1996). The pipeline quality and damping play a very important role in vortex-induced vibration on the pipeline, which is verified by Williamson through theoretical calculation and experiments. The vortex-induced vibration is more obvious, especially at high Reynolds number (Williamson and Govardhan, 2004). A wake oscillator device is capable of suppressing the vortex-induced vibration of rivers. Wind tunnel tests were used to verify that the wake oscillator can reduce the vibration amplitude by 40% (Baz and Kim, 1993). A spiral plate was also effective in suppressing vortex-induced vibration. The motion state of flexible risers under the protection of the spiral plate was identified through tests based on structural models of different diameters (Gao et al., 2015). Devices for the suppression of vortex-induced vibration are divided into two structure types, active and passive. Based on calculations and analysis, passive suppression devices have better performance in suppressing vortex-induced vibration of risers and prolong their fatigue life (Hong and Shah, 2018). A towing tank test is a good way to rectify a pipeline's nonlinear hydrodynamic performance. The vibration and fluid force of a pipeline in a tank can be measured by adjusting different positions. Test results coincide with the theory (Shah and Hong, 2018). As vortex-induced vibration phenomenon occurs in slender pipelines in marine engineering, a forecast vortex-induced vibration model of a slender structure was built based on a slenderness ratio and numerical calculations at different velocities (Wu et al., 2012). The vortex-induced vibration of different riser structures was analyzed by Ansys/CFX, indicating that the frequency-locked area of the vortex-induced vibration is larger at a low mass ratio (Guo et al., 2005). The function of suppressing the vortex-induced vibration can be realized by two devices. Fairing is a device for reducing the vortex-induced vibration of risers (Wang et al., 2018). Compared with similar devices, such as strakes, fairing has better efficiency for reducing the vortex-induced vibration, with more than 90% amplitude reduction of the vortex-induced vibration (Harwood et al., 2016). A spiral plate can effectively reduce 70%–80% response amplitudes while fairing has better suppression with 80% response amplitudes and the towing force reduced by 50% (Lee et al., 2004). Lagrange is used for calculating the two-dimensional vortex-induced vibration. The state of the vortex shedding as well as its impact on the pipeline structure was analyzed according to a nonnormal aerodynamics analysis approach (Huang and Green, 2015). The flow tension and pressure changes in the cylindrical surface strongly affect the vortex shedding frequency (Rockwood and Green, 2016). Vortex-induced vibration has a significant impact on the fatigue life of risers. Additionally, damage to risers of different diameters and water depths vary based on the test results. Therefore, a vortex-induced vibration-suppression device should be applied to protect deep-water risers to avoid fatigue (Trim et al., 2005; Qiu et al., 2017). The van der Pol equation is used to analyze vortex-induced vibration of risers for inertia force and vortex wake operator (Facchinettia et al., 2004). The theoretical analysis indicates that fairing in marine risers is quite effective in reducing the towing force produced by fluid on risers (Gui et al., 2015). The fluid-structure coupling calculation was also used to analyze vortex-induced vibration of marine risers. Based on analysis of conditions with and without fairing, fairing can effectively reduce the towing force of risers (Zhao, 2011). Calculations from this paper are based on fairings manufactured by Qingdao DMAR YiYang Marine Engineering Equipment Manufacturing Co., Ltd. The inner diameter of the fairings was 14 in and the tail angle was 40°.
|
Fig. 1 Fairing device. |
The large eddy simulation turbulence model results from variable filtering in wave numbers and physical mesh spacing based on traditional Stokes' theorem. Variables were decomposed to obtain a greater vortex to produce the fluid governing equation of the large vortex. The Stokes' theorem is as follows (Gui et al., 2015).
| $\frac{{\partial {u_i}}}{{\partial t}} + \frac{{\partial {u_i}{u_j}}}{{\partial {x_j}}} = - \frac{1}{\rho }\frac{{\partial p}}{{\partial {x_i}}} + \frac{\partial }{{\partial {x_j}}}\left({v\frac{{\partial {u_i}}}{{\partial {x_j}}}} \right).$ | (1) |
Eq. (1) is distinguished by the size of the vortices:
| ${u_i}(x, t) = {\bar u_i}(x, t) + {u'_i}(x, t), $ | (2) |
where
The turbulent eddy spectrum in the Stokes equation is filtered by the above equation, and eddy smaller than the grid size is ignored. The subgrid stress is used to obtain the large eddy control equation that can be directly solved.
| $\frac{{\partial {u_i}}}{{\partial t}} + \frac{{\partial {u_i}{u_j}}}{{\partial {x_j}}} = - \frac{1}{\rho }\frac{{\partial p}}{{\partial {x_i}}} + \frac{\partial }{{\partial {x_j}}}\left({v\frac{{\partial {u_i}}}{{\partial {x_j}}}} \right) - \frac{{\partial {\tau _{ij}}}}{{\partial {x_j}}}.$ | (3) |
Subgrid stress:
| ${\tau _{ij}} = \rho \overline {{u_i}{u_j}} - \rho \overline {{u_i}} \overline {{u_j}} .$ | (4) |
For the bare riser, a band of local vortex shedding frequencies is defined along the riser using (DNV, 2001):
| ${f_s} = {S_t}\frac{u}{D}, $ | (5) |
where fs is the vortex shedding frequencies, u is the local tangential flow velocity and D is the outer riser diameter. St is the Strouhal number where upper and lower bound values should be checked (typically St = 0.14 to 0.25).
2.3 Reynolds Number CalculationThe fairing has an irregular geometry profile. When the current section is circular, the characteristic length is taken as the inner diameter d of the tube (Moe and Wu, 1990). When the current section is non-circular, the equivalent is used to replace the inner diameter of the corresponding circular tube in engineering application and research (Rockwood et al., 2017). Therefore, it can still be calculated on the basis of a circular tube. The equivalent diameter da is four times the hydraulic radius (Owen and Bearman, 2001). The calculation formula is as follows:
| $d_{a}=\frac{4 A}{L}. $ | (6) |
A is the area of the cross section and L represents the circumference of the device soaked in liquids. Measured as per fairing from DMAR YiYang Marine Engineering Equipment Manufacturing Co., Ltd., area of cross section is A = 901211 mm2 and the circumference is 3982.8 mm, respectively. The characteristic length da = 905 mm can then be reached.
The Reynolds number corresponding to different flow velocities is obtained:
| $\operatorname{Re}=\frac{v d \rho}{\eta}. $ | (7) |
The η viscosity of 20℃ water is 0.001 Pa s, ν is the viscosity of the fluid and d is the characteristic length of the riser or fairing.
In general, fluids were divided into laminar and turbulent flow. When the Reynolds number Re < 2300, the flow is laminar. When Re = 2300–4000, the flow is in a transitional state and Re > 4000, the flow is flow. When Re > 10000, the flow is completely turbulent. Based on Table 1, the calculations and tests were both in the complete turbulent state.
|
|
Table 1 The VS Reynolds number of the bare riser and fairing at different velocities |
There is a certain relationship between St and the Re numbers of the vortex shedding frequencies on the smooth cylindrical surfaces. When 150 < Re < 3×10⁵, the vortex sheds alternately and gradually becomes turbulent. This stage is called the subcritical Reynolds number range. At this moment, Strouhal number St is around 0.2. When 3×10⁵ < Re < 3.5×10⁶, the flow changes to turbulent separation and regular vortex cannot be observed. Therefore, it is not possible to clearly define the St value due to the random vortex (Blevins and Burton, 1997).
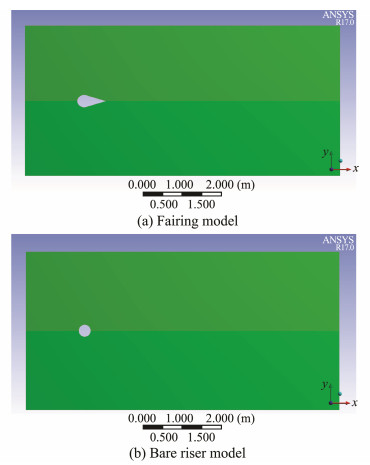
3 FE ModelingThe structure models of the risers with and without fairing are calculated via Fluent software. In order to prevent the boundary effect, more than five times the fluid domain needs to be modeled (Lee and Allen, 2005). Based on the actual size of the fairing, a two-dimensional of 8 m × 4 m fluid domain model was created. The models for risers with and without fairing are shown below (Fig.2):
|
Fig. 2 Finite element model. |
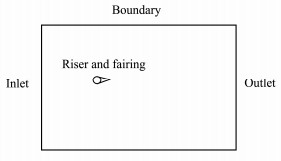
The inlet boundary is at the near end of the fairing and the outlet boundary is at the far end of the fairing. Both sides are symmetrically constrained. The wall boundary is set for the fairing, as shown in Fig.3.
|
Fig. 3 Boundary condition of the model. |
To calculate the performance effect of the risers with and without fairing when the flow velocity changes from 0.1 m s−1 to 2 m s−1, every 0.1 m s−1 was set up as one load case and in total, 20 load cases were considered.
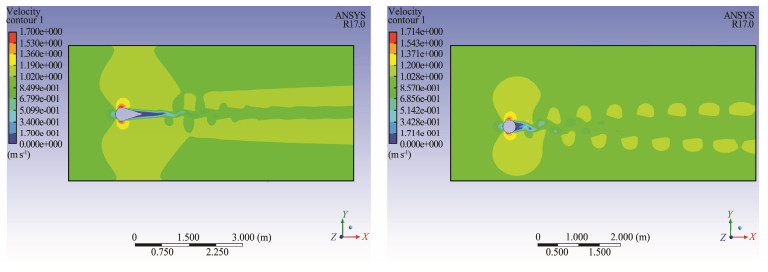
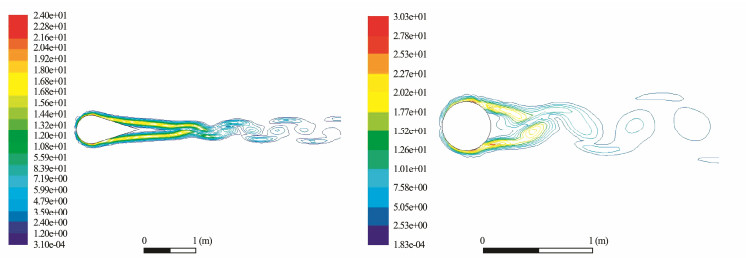
The drag and lift coefficients of the riser and fairing, as well as their surrounding flow field fringe, were obtained through analysis of the load cases. Figs. 4 and 5 compare the velocity field and vorticity near to the riser and fairing and analysis the flow field velocity profile at 1 m s−1.
|
Fig. 4 Velocity field comparison around fairing and riser. |
|
Fig. 5 Vorticity comparison around fairing and riser. |
The velocity field of the wake vortex street of the riser was very obvious, while the wake vortex street of the fairing was not. Based on the vorticity map, the wake vortex of the riser was completely separated, while the vortex of the fairing was not. Therefore, according to the comparison of the velocity field and vorticity, the fairing has better restraining effect. The analysis results were summarized in Table 2.
|
|
Table 2 The results of the analysis of bare riser and fairing |
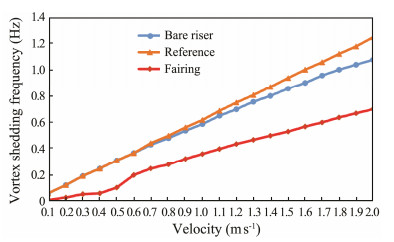
The vortex shedding frequency and flow velocity show a linear relationship. The vortex shedding frequency around the fairing was 35% smaller than that around the riser, as shown in Fig.6.
|
Fig. 6 Vortex shedding frequency comparison of the fairing and riser. |
According to the Zhao (2011), when Re is 10000, St is 0.19. In this paper, after the calculation, the St is between 0.17 and 0.2, which coincides with the reference. This proves the reliability of the calculation method. When Re > 3.37×10⁵, the results are a little bit different because the Reynolds number increased and the vortex shedding frequency was not regular, which is beyond the subcritical state of calculation.
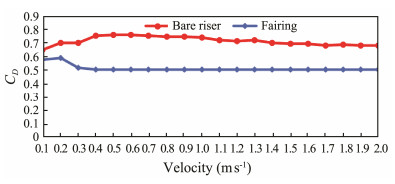
Fig.7 compares the drag coefficient of the fairing (blue curve) and bare riser (red curve) after the comparison of the 20 load cases.
|
Fig. 7 The drag coefficient comparison of the fairing and riser. |
According to the comparison, the drag coefficient of the fairing was about 0.5 and the drag coefficient of the bare riser was about 0.7. Therefore, the drag coefficient of the fairing was about 30% smaller than the drag coefficient of the riser.
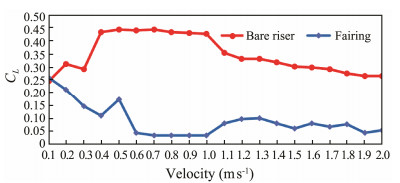
Fig.8 shows the lift coefficient of the fairing (blue curve) and bare riser (red curve) after comparison of the 20 load cases.
|
Fig. 8 Lift coefficient comparison of the fairing and riser |
The lift coefficient of the fairing and riser had obvious fluctuations. The flow velocity was inversely proportional to the fluctuation, i.e., the slower the flow velocity, the larger the fluctuations. Both were steady at the velocity of 0.6–1 m s−1. The lift coefficient changes slightly when the flow velocity is greater than 1 m s−1. Overall, the lift coefficient of the fairing was much less than that of riser.
4 ValidationThe hydrodynamic test pool was 17.3 m long, 6.2 m wide and 2.88 m tall. The test section was 7 m long, 1.7 m wide and maximum 1.5 m deep. The maximum velocity was 2.3 m s−1 and the contraction ratio was 2. A bubble eliminating device and wave eliminating device were both available for ensuring the observing quality of the flow field at high flow velocity and standing wave height no greater than 7 mm when the flow rate was less than 1.5 m s−1. Fig.9 shows the experimental scheme of the bare riser and fairing in the test pool.
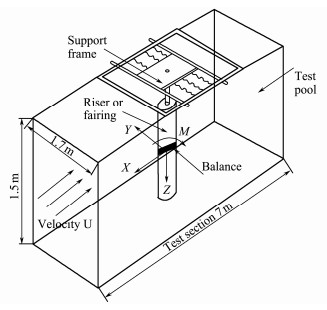
|
Fig. 9 Experimental scheme of the bare riser and fairing in the test pool. |
The test load cases are shown in Table 3.
|
|
Table 3 Load cases of the tests |
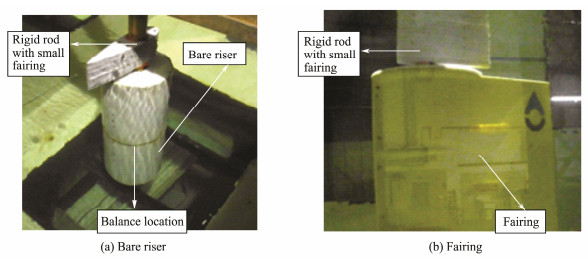
Fig.10 show that the test model (1-m long for the middle part with a 0.02 m thrust ring at two ends) was vertically set in the center of the test pool, and the force balance was in the center of the bare riser and fairing. The shell was connected with the force balance by the internal frame, so that the force of the model can be transferred to the balance. To ensure the swing of the model under the lift force, the model rotates around the rigid rod and the thrust ring at the ends bear the segmental weight, but there is some friction between the thrust ring and shell. One end of the rigid rod is fixed to the balance, and the other end of the rod with a small fairing is fixed to the external support over the pool, thus forming a force measuring system of the cantilever beam type to measure the drag and lift force of the model at different flow velocities.
|
Fig. 10 Bare riser and fairing in the test pool. (a) Bare riser; (b) Fairing. |
The measuring range and parameters of the balance are shown in Figs. 9 and 10, the force of the model is tested by a five-component balance that is used to measure the forces and moments on five degrees of freedom, except the z-axis. When testing, the balance is placed at the origin of the coordinate system. The drag force measured by the balance is negative in the x-axis and the lift force is positive in the y-axis.
The attributes of the force balance are mainly determined by its calculation formula and the formula is determined by the balance processing and strain gauge bonding method. The coupling relationship between the strain and load in all directions are identified according to the voltage output of the strain in the same direction of the balance. By calibrating the balance, the formula of the balance is shown below:
| $Y = 0.0830984{U_1} - 0.00996302X + 2.8305E - 6{X^2} + 0.00098835{M_y} + 8.92511E - 5M_y^2 - 0.22231922{M_x} +\\ \;\;\;\;\; 2.176796E - 4M_x^2 - 0.38015732{M_z} - 4.266693E - 4M_z^2, $ | (8) |
| $X = 0.0849824{U_2} - 0.00082828Y + 2.9425E - 6{Y^2} + 0.26203191{M_y} + 4.46587E - 5M_y^2 - 0.02715192{M_x} +\\ \;\;\;\;1.316494E - 4M_x^2 - 0.09376378{M_z} - 4.19425E - 4M_z^2, $ | (9) |
| ${M_y} = 0.01123868{U_3} - 0.00020704Y - 7.069E - 7{Y^2} - 0.00112623X + 3.124E - 7{X^2} + 0.01707818{M_x} -\\ \;\;\;\;\;2.2957E - 6M_x^2 + 0.01699177{M_z} - 1.24085E - 5M_z^2, $ | (10) |
| ${M_x} = 0.01106635{U_4} + 0.00391153Y - 5.392E - 7{Y^2} + 0.00061019X + 4.755E - 7{X^2} - 0.01998775{M_y} -\\ \;\;\;\;\;1.34601E - 6M_y^2 - 0.0231637{M_z} + 3.2671E - 6M_z^2, $ | (11) |
| ${M_z} = 0.00199115{U_5} - 0.00109555Y - 4.4196E - 6{Y^2} + 0.00013526X - 1.2784E - 6{X^2} - 0.00810979{M_y} +\\ \;\;\;\;\;3.8839E - 5M_y^2 + 0.00206826{M_x} - 3.26365E - 5M_x^2, $ | (12) |
U1–U5 are voltage values, V is the unit of the original voltage with unit of mV. Y, X are forces with unit of N, and My, Mx, Mz are moments with unit of N m.
The calculation method of the drag coefficient and lift coefficient are shown below:
| ${F_d} = \frac{1}{2}\rho {C_D}S{U^2}, $ | (13) |
| ${F_L} = \frac{1}{2}\rho {C_L}{S_L}{U^2} $ | (14) |
where CD is the drag coefficient. CL is the lift coefficient. U is the flow velocity. S is the area corresponding to the drag force. and SL is the area corresponding to the lift force.
The test process is a constant measurement and the drag and lift force oscillates with the vortex shedding cycle; therefore, the average of the lift force and drag are calculated. Fd QUOTE FD is the drag force and FL QUOTE FL is the lift force. The test process lasts 900 s, and the average value of the whole test process determined in the calculation. The drag coefficient, lift coefficient, and vortex frequency of the device at different Reynolds numbers are obtained, as shown in Table 4.
|
|
Table 4 Drag coefficient and lift coefficient of the model at different Reynolds numbers |
As shown in Fig.11 and Fig.12, the drag coefficient under the working condition with the fairing is small. The test proves that the fairing has an obvious drag reduction effect. The maximum drag reduction reaches 55.6% when the flow velocity is 0.6 m s−1, which confirms a previous publication (Allen and Henning, 2008).
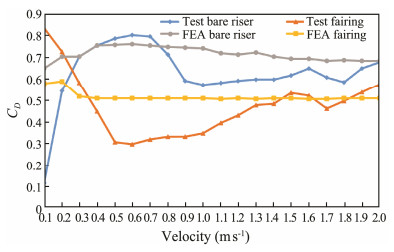
|
Fig. 11 Experimental value of the drag coefficient of the fairing and riser. |
|
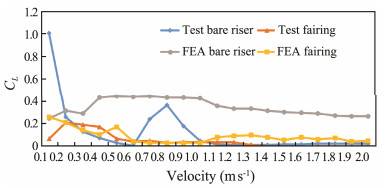
Fig. 12 Lift coefficient of the fairing and riser. |
As shown in the figure, when the velocity is 0.4 m s−1 to 0.9m/s, the lift coefficient varies greatly, which indicates that this is the Frequency locking region of the risers. At this velocity, the Reynolds number is within the range of 1.25×10⁵ to 3×10⁵, and the vortex-induced oscillation of the fairing is the largest, leading to peak lift.
The swing effect occurs in the fairing due to the vortex-induced vibration. There are some differences between the swing frequency and vortex frequency and resonance frequency of pipeline, therefore resonance is avoided. With the increase in velocity, the vortex is broken or the vortex shedding frequency deviates from the resonance range of the model. In this way, the lift coefficient diminishes. This type of fairing has good function of the suppressing vortex-induced vibration.
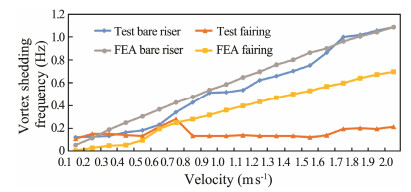
According to the experimental lift forces of the fairing and riser, spectral densities were analyzed and the corresponding peak frequencies (vortex frequencies) are obtained. Notably, some corresponding peak frequencies of the spectral densities are not obvious. In addition, the boundary layer is separated in the test model and turbulence occurs. The calculated and experimental values are also shown in Fig.13, illustrating the vortex shedding frequency comparison of the bare tube and fairing. Based on these results, the calculated values are very close to the experimental values for the bare tubes. For the fairing, the calculated values are close to the experimental values when the Reynolds numbers are low. However, when the velocity reaches 0.7 m s−1, the vortex shedding frequency declines rapidly and when the Reynolds number is higher, the vortex shedding frequency increases rapidly. For smooth risers, the calculation formula of the vortex shedequency at corresponding Reynolds number is given by design specifications.
|
Fig. 13 Vortex shedding frequencies of the riser and attached fairing at different velocities. |
This paper aims to calculate the hydrodynamic coefficient of riser and fairing using a large eddy simulation model and by comparing the test results of risers and fairing by different test speeds. The fairing effectively reduced the vortex-induced vibration.
According to finite element analysis and experimental results, the drag reduction effect of the fairing is more obvious when the flow velocity is 0.4–1.2 m s−1, and the maximum drag reduction reaches 55.6% when the flow velocity is 0.6 m s−1. Additionally, the drag reduction effect is also obvious when the flow velocity is greater than 0.3 m s−1 and less than 1.3.
The maximum lift coefficient of the riser is 0.36 when the flow velocity reaches 0.8 m s−1. At this time the vortex shedding frequency on fairing is much smaller than that on the bare riser. The period change longer by the fairing and avoid the resonant frequency.
This kind of fairing is well used in offshore engineering and provides good properties to reduce drag and suppression vortex-induced vibration.
AcknowledgementsThis work is financially supported by the 7th Generation Ultra Deep-Water Drilling Unit Innovation Project, the National Key Research and Development Plan (No. 2016YFC0303400), the Fundamental Research Funds for the Central Universities (No. 17CX0 2013A), the Natural Foundation of Shandong Province (Nos. ZR2017BEE031, ZR2017LEE032), and the National Natural Science Foundation of China (No. 51609201).
Abbassian, F. and Thanos, M., 1996. The use of air-bubble spoilers to suppress vortex-induced vibrations of risers. SPE Production & Facilities, 11(1): 35-40. (  0) 0) |
Allen, D. W., and Henning, D. L., 2008. Comparisons of various fairing geometries for vortex suppression at high Reynolds numbers. Offshore Technology Conference. Houston, Texas, OTC19377.
(  0) 0) |
Baz, A. and Kim, M., 1993. Active model control of vortex-induced vibrations of a flexible cylinder. Journal of Sound and Vibration, 165(1): 69-84. DOI:10.1006/jsvi.1993.1243 (  0) 0) |
Blevins, R. D. and Burton, T. E., 1976. Fluid forces induced by vortex shedding. Journal of Fluids Engineering, 98: 19-26. DOI:10.1115/1.3448196 (  0) 0) |
DNV, 2001. Offshore Standard DNV-OS-F201: Dynamic Riser. Det Norske Veritas, Oslo, 85-88.
(  0) 0) |
Facchinettia, M. L., de Langre, E. and Biolley, F., 2004. Coupling of structure and wake oscillators in vortex-induced vibrations. Journal of Fluids and Structures, 19: 123-140. DOI:10.1016/j.jfluidstructs.2003.12.004 (  0) 0) |
Gao, Y., Fu, S. X., Ren, T., Xiong, Y. M. and Song, L. J., 2015. VIV response of a long flexible riser fitted with strakes in uniform and linearly sheared currents. Applied Ocean Research, 52: 102-114. DOI:10.1016/j.apor.2015.05.006 (  0) 0) |
Gui, H. B., Qiao, Y. L., and Lu, T. C., 2015. Study on influence of vortex-induced vibration of marine riser attached fairing. Proceeding of the 15th Marine Underwater Noise Symposium. Zhengzhou, 346-353.
(  0) 0) |
Guo, H. Y., Fu, Q. and Lou, M., 2005. Vortex-induced vibrations and fatigue life of marine risers conveying flowing fluid. Engineering Mechanics, 22(4): 221-225. (  0) 0) |
Harwood, C. M., Yong, Y. L. and Ceccio, S. L., 2016. Ventilated cavities on a surface piercing hydrofoil at moderate Froude numbers:Cavity formation, elimination and Stability. Journal of Fluid Mechanics, 800: 5-56. DOI:10.1017/jfm.2016.373 (  0) 0) |
Hong, K. S. and Shah, U. H., 2018. Vortex-inducedvirations and control of riser:A review. Ocean Engineering, 152: 300-315. DOI:10.1016/j.oceaneng.2018.01.086 (  0) 0) |
Huang, K., 2013. Riser VIV and its numerical simulation. Engineering Sciences, 11(4): 55-60. (  0) 0) |
Huang, Y. and Green, M. A., 2015. Detection and tracking of vortex phenomena using Lagrangian coherent structures. Experiments in Fluids, 56(7): 1-12. (  0) 0) |
Kwon, S. H., Cho, J. W. and Park, J. S., 2002. The effects of drag reduction by ribbons attached to cylindrical pipes. Ocean Engineering, 29: 1945-1958. DOI:10.1016/S0029-8018(02)00010-0 (  0) 0) |
Lee, L., Allen, D. W., Henning, D. L., and Mcmullen, D., 2004. Damping characteristic of fairings for suppressing vortex-induced vibrations. OMAE Conference Proceedings. Vancouver, No. 51209.
(  0) 0) |
Lee, L., and Allen, D. W., 2005. The dynamic stability of short fairings. Offshore Technology Conference. Houston, Texas, OTC17125.
(  0) 0) |
Lee, S. J., Lee, S. I. and Park, C. W., 2004. Reducing the drag on a cylinder by upstream installation of a small control rod. Fluid Dynamics Research, 34: 233-250. DOI:10.1016/j.fluiddyn.2004.01.001 (  0) 0) |
Moe, G. and Wu, Z. J., 1990. The lift force on a cylinder vibrating in a current. Journal of offshore Mechanics and Arctic Engineering, 112(4): 297-303. DOI:10.1115/1.2919870 (  0) 0) |
Owen, J. C. and Bearman, P. W., 2001. Passive control of VIV with drag reduction. Journal of Fluids and Structures, 15: 597-605. DOI:10.1006/jfls.2000.0358 (  0) 0) |
Qiu, X., Bi, Z. X., Luo, J. P. and Liu, Y. L., 2017. Vortex shedding in the flow around two side-by-side circular cylinders of different diameters. Journal of Hydrodynamics, 3: 60-65. (  0) 0) |
Rockwood, M. P., and Green, M. A., 2016. Correlation of the surface pressure distribution on a circular cylinder with objective identification of vortex formation and shedding. AIAA Aerospace Sciences Meeting. San Diego, DOI: 10. 2514/6. 2016-2080.
(  0) 0) |
Rockwood, M. P., Taira, K. and Green, M. A., 2017. Detecting vortex formation and shedding in cylinder wakes using lagrangian coherent sturtures. AIAA Journal, 55(1): 1-9. DOI:10.2514/1.J055815 (  0) 0) |
Shah, U. H. and Hong, K. S., 2018. Active vibration control of a flexible rod moving in water:Application to nuclear refuelling machines. Automatica, 93: 231-243. DOI:10.1016/j.automatica.2018.03.048 (  0) 0) |
Trim, A. D., Beaaten, H., Lie, H. and Tognarelli, M. A., 2005. Experimental investigation of vortex-induced vibration of long marine riser. Journal of Fluids and Structures, 21: 335-361. DOI:10.1016/j.jfluidstructs.2005.07.014 (  0) 0) |
Wang, Z. Y., Huang, B., Zhang, M. D., Wang, G. Y. and Zhao, X. A., 2018. Experimental and numerical investigation of ventilates caveating flow structures with special emphasis on vortex shedding dynamics. International Journal of Multiphase Flow, 98: 79-95. DOI:10.1016/j.ijmultiphaseflow.2017.08.014 (  0) 0) |
Williamson, C. H. K. and Govardhan, R., 2004. Vortex-induced vibrations. Annual Reviews, 36(1): 417-439. (  0) 0) |
Wu, X. D., Ge, F. and Hong, Y. S., 2012. A review of recent studies on vortex-induced vibrations of long slender cylinders. Journal of Fluids and Structures, 28: 292-308. DOI:10.1016/j.jfluidstructs.2011.11.010 (  0) 0) |
Zhao, P. L., 2011. Numerical simulation of fluid-structural interaction for vortex-induced vibration of marine riser and attached fairing. Master thesis. Shanghai Jiaotong University.
(  0) 0) |
 2020, Vol. 19


