2) Institute of Sea-Crossing Engineering, Ludong University, Yantai 264025, China;
3) Shandong Provincial Key Laboratory of Ocean Engineering, Qingdao 266100, China
The concept of utilizing oscillating hydrofoils that utilize heaving and pitching motions to extract energy from tidal currents stems from similar principles used in wind energy harvesters (McKinney and DeLaurier, 1985). When compared to rotary turbines, such as horizontal and vertical-axis turbines, oscillating hydrofoils offer several advantages. Notably, they are more environmentally friendly owing to their lower tip speed ratio, suitable for shallow waters and can have their installed capacity scaled up by increasing the foil span laterally (Rostami and Armandei, 2017; Wu et al., 2020).
Control strategies for oscillating hydrofoils can be classified into three categories: fully activated, semi-activated, and fully passive controlling (Poirel et al., 2008; Huxham et al., 2012; Kim et al., 2017). The fully activated control strategy involves prescribed heaving and pitching motions of the hydrofoil, making it more idealized and straightforward to implement (Xiao and Zhu, 2014). Overall, the heaving motion of the hydrofoil using the semi-activated control strategy is induced by the flow, while the pitching motion is prescribed, respectively. The fully passive control strategy features both heaving and pitching motions induced by the flow, leading to potential instability. Owing to the instability and complicated simulating process of the hydrofoil motions, it is relatively difficult to implement the semi-activated and fully passive control strategies in experimental or numerical studies. The fully activated control strategy has been used in many experimental and numerical research efforts. The semi-activated control strategy is used in sea trials for its stability. Therefore, both control strategies will be discussed in our study.
The fully activated oscillating hydrofoil (FAH) has been investigated both as a propulsive mechanism and a device for energy extraction (Jones and Platzer, 1997). Research indicates that the FAH operates in an energy extraction mode rather than a propulsion mode when the effective angle of attack exceeds zero (Kinsey and Dumas, 2008). This angle is determined by the heaving amplitudes, along with frequency. In power extraction mode, many structural, kinematic, and environmental hydrodynamic parameters have been studied. An experimental study conducted on a water flume reported that the cross-sectional profile of the hydrofoil has a minimal influence on power extraction efficiency (Kim et al., 2017). The maximum efficiency recorded was 30.0%, achieved at a reduced frequency of 0.13, with a pitching amplitude of 70˚ and a heaving amplitude equivalent to 0.8 times the chord length of the hydrofoil. Numerical studies further reveal that maximum efficiency can reach about 35.2% at a reduced frequency of 0.11, with the pivot point located at the third chord (Pourmahdavi et al., 2019). The phase shift between heaving and pitching motions plays a significant role in the hydrofoil performance (Davids, 1999; Lindsey, 2002), with optimal energy extraction performance obtained at a 90˚ phase shift, an approach widely used in FAH studies (He et al., 2021; Farooq et al., 2022). The impact of complex hydrodynamic conditions on FAH's energy-harvesting performance has also been studied. The numerical study showed a significant decrease in the energy-harvesting performance of FAH when subjected to high shear rates (Cho and Zhu, 2014; Yu et al., 2018). Beyond the challenges presented by non-uniform flows, the effects of unsteady flows on the energy-harvesting performance of FAH were numerically studied (Chen et al., 2017; Ma et al., 2018). These studies showed that the efficiency of FAH is significantly influenced by the amplitude and frequency of flow fluctuations. The effects of ground (Zhu et al., 2020) and free surface (Deng et al., 2022) were also studied. The results indicated that the ground effect can increase the efficiency. The presence of a free surface has been shown to detrimentally affect the energy-harvesting performance.
The semi-activated hydrofoil (SAH) possesses different parameters compared to the FAH. For FAH, the phase shift or heaving amplitude can be modified directly. By contrast, the phase shift or heaving amplitude of SAH is influenced by multiple parameters, such as the mass and the damping coefficient (Deng et al., 2015), with the optimal phase difference being 82˚. An experimental study on the power generation efficiency of SAH (Huxham et al., 2012) discovered a phase shift of 74˚ between the prescribed pitching motion and the induced heaving motion. The maximum efficiency recorded was 23.8%, obtained with a pitching amplitude of 58˚ at a reduced frequency of 0.1. The optimal pivot location for SAH was identified between 0.3 and 0.4 times the chord length from the leading edge (Zhu and Zhang, 2009; Zhu et al., 2009). Apart from energy-harvesting performance, the dynamic responses of SAH in shear flows were numerically studied (Liu et al., 2019), indicating that SAH is pushed toward the lower-velocity areas owing to the velocity gradient.
Compared with the semi-activated control strategy, certain parameter effects cannot be examined using the fully activated control strategy since it overlooks the dynamic responses of the oscillating hydrofoil under complex hydrodynamic conditions. Nonetheless, the fully activated control strategy can be used in preliminary studies owing to its straightforward implementation. Meanwhile, conclusions about the optimal energy-harvesting performance and corresponding parameter value show certain differences between FAH and SAH. The effects and mechanisms of various control strategies are first studied in this paper.
This paper outlines the motions and performance metrics of oscillating hydrofoils employing both fully activated and semi-activated strategies in Section 2. Section 3 details the development and validation of a 2D numerical model based on the CFD software ANSYS-Fluent. In Section 4, variations in flow fields, hydrodynamic torques, forces, and power efficiencies are analyzed to explore the main differences in kinematic parameters and their effects on the energy-harvesting performance of oscillating hydrofoils. The main conclusions derived from these results are discussed in Section 5.
2 Numerical ModelIn this study, a NACA0015 foil with a chord length (c) of 0.1 m is considered. The distance from the pivot to the leading edge of the hydrofoil is set as c/3. It is assumed that the pivot coincides with the center of mass and principal axis of inertia moment. The incident velocity U is set as 1.0 m s−1.
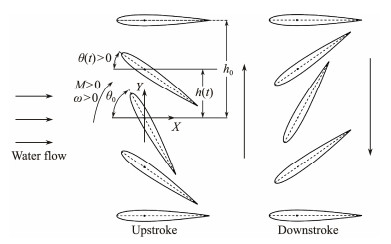
2.1 Description of FAHBoth heaving and pitching motions of FAH are prescribed by an external mechanism. A diagram illustrating the hydrofoil motions is presented in Fig.1. Sinusoidal patterns are employed for both pitching and heaving motions, which are defined as follows:
| $ \theta (t) = {\theta _0}\sin (2{\text{π }}ft + \varphi), $ | (1) |
| $ h(t) = {h_0}\sin (2{\text{π }}ft), $ | (2) |
|
Fig. 1 2D schematic of the FAH. |
where h0 and θ0 denote the heaving and pitching amplitudes, respectively; t is the instantaneous time; f denotes the frequency of motion, with its dimensionless form, reduced frequency, defined as f* = fc/U; φ signifies the phase shift between heaving and pitching motions.
For the FAH, the energy harvesting performance is characterized by the cycle-averaged power efficiency and power coefficient, which are defined as:
| $ \eta = \frac{1}{T}\frac{{\int_0^T {P(t}){\text{d}}t}}{{\frac{1}{2}\rho {U^3}sd}}, $ | (3) |
| $ {C_P} = \frac{1}{T}\frac{{\int_0^T {P(t}){\text{d}}t}}{{\frac{1}{2}\rho {U^3}sc}}, $ | (4) |
| $ P(t) = L(t)h'(t) + M(t)\theta '(t), $ | (5) |
where T is the period; s denotes the span length of the hydrofoil; ρ signifies the density of the water; P(t) represents the instantaneous hydrodynamic power; d is the maximum translational displacement of the leading or trailing edges of the hydrofoil; L(t) and M(t) are the instantaneous lift on vertical component and hydrodynamic torque on pitching pivot, respectively; h′(t) indicates the instantaneous heaving velocity; θ′(t) is the instantaneous pitching angular velocity. In addition, the positive directions for the moment and the angular velocity are defined clockwise, while the positive directions for lift and heaving velocity align with the positive Y axis.
The instantaneous lift coefficient CL(t), hydrodynamic torque coefficient CM(t), and power coefficient CP(t) in the dimensionless form can be defined as follows:
| $ {C_L}(t) = \frac{{L(t)}}{{\frac{1}{2}\rho cs{U^2}}}, $ | (6) |
| $ {C_M}(t) = \frac{{M(t)}}{{\frac{1}{2}\rho {c^2}s{U^2}}}, $ | (7) |
| $ {C_P}(t) = \frac{{P(t)}}{{\frac{1}{2}\rho sc{U^3}}} . $ | (8) |
The instantaneous power coefficient derived from the heaving and pitching motions can be defined as follows:
| $ {C_{Ph}}(t) = \frac{{L(t)h'(t)}}{{\frac{1}{2}\rho sc{U^3}}}, $ | (9) |
| $ {C_{P\theta }}(t) = \frac{{M(t)\theta '(t)}}{{\frac{1}{2}\rho sc{U^3}}} . $ | (10) |
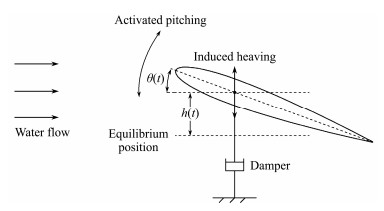
As illustrated in Fig.2, the pitching motions of the hydrofoil are driven by an external mechanism, while the heaving motions are induced by the hydrodynamic lifting force. Consequently, the pitching motion of the SAH can be prescribed as Eq. (2).
|
Fig. 2 2D schematic of the SAH. |
The description of the induced heaving motion of the SAH is based on Newton's second law, which can be defined as:
| $ L(t) = mh''(t) + Dh'(t), $ | (11) |
where m is the heaving mass of the hydrofoil; D is the damping coefficient with unit N s m−1; and h"(t) is the heaving acceleration.
From Eq. (11), at the time of t + Δt, the heaving velocity of the hydrofoil can be calculated using the following equation:
| $ h'(t + \Delta t) = h'(t) + \frac{{L(t) - Dh'(t)}}{m}\Delta t . $ | (12) |
Furthermore, the instantaneous heaving position h (t + ∆t) at the same time is updated as:
| $ h(t + \Delta t) = h(t) + h'(t + \Delta t)\Delta t . $ | (13) |
The power efficiency of SAH uses the same definition as the FAH.
To analyze the pressure distribution, the pressure coefficient Cp is defined as:
| $ {C_p} = \frac{p}{{\frac{1}{2}\rho {U^2}}}, $ | (14) |
where p is the hydrodynamic pressure on the hydrofoil surface.
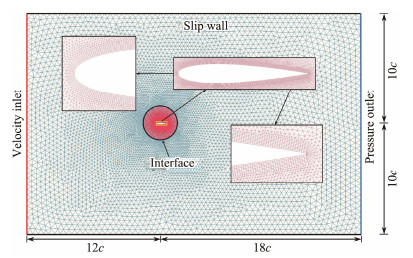
2.3 Numerical Model Set-upAs previously stated, the motions of the oscillating hydrofoil consist of both vertical translation and rotation around a translational pivot point. The dynamic and sliding meshes of Fluent are adopted to realize the translation and rotation in the inertial reference. The computational domain and mesh distributions are displayed in Fig.3. The computational domain comprises a central circular domain and an outer rectangular domain, connected through a couple of non-conformal sliding interfaces to accommodate movement. To mitigate blockage effects (Gauthier et al., 2016; Yang et al., 2023), the width of the rectangular domain is fixed at 20 times the c, with this dimension chosen based on pre-set heaving amplitudes. The slip wall boundaries are positioned 10c away from the hydrofoil, both above and below. The hydrofoil pivot, central to the circular domain, is placed 12c away from the upstream velocity inlet boundary to allow the water flow to fully develop before encountering the hydrofoil. The downstream pressure outlet boundary is 18c away from the pivot to ensure adequate space for wake formation during the pitching and heaving of the hydrofoil. The circular domain, with a radius of 1.5c, synchronizes with the hydrofoil's wall boundary condition during oscillation. The outer rectangular domain features grids that adapt by deformation and reconstruction around the circular domain; consequently, unstructured meshes are utilized to accurately reflect the hydrofoil's complex geometry. Mesh refinement near the hydrofoil's boundary layers addresses the challenges of near-wall turbulence and wake vortex generation. These simulations operate with a Reynolds number of 105, employing the standard k-ω model for turbulence, which has been selected after comparison with various models and validated in preliminary simulations. Enhanced wall treatment was applied to optimize near-wall modeling, maintaining y+ values below 5.0.
|
Fig. 3 Computational domain and mesh distributions. |
The semi-implicit method for the pressure-linked – equation-consistent (SIMPLEC) scheme was used for solving velocity-pressure coupling. Gradient calculations employed the Green-Gauss node-based method in spatial discretization, with pressure interpolation managed by a second-order scheme. Convection terms in each governing equation are addressed using a second-order upwind scheme, and transient phenomena are captured with a second-order implicit scheme. The convergence criterion of iterative computations for critical parameters was a residual of 106, with 50 iterative steps per time step to ensure robust convergence of critical parameters.
2.4 Numerical Model ValidationGiven the similarity in movement patterns between hydrofoils operated under two different control strategies and considering the increased complexity of simulating an SAH compared to a fully activated one, the study leverages experimental data from an SAH, as reported by Huxham et al. (2012), to validate the capability of the above numerical model. The hydrofoil of Huxham is forced to pitch around its pivot by a stepper motor and undergoes an angular passive heaving through its swing arm. Torque measurements are captured using a torque transducer fixed to the output shaft.
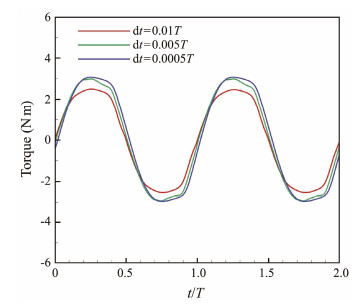
The time step independence study is first conducted. According to the research reported by Hu and Xiao (2014), Sitorus and Ko (2019), and He et al. (2022), three time step sizes of 0.01T, 0.005T, and 0.0005T are calculated. The time history curves of the torque output, shown in Fig.4, reveal that the curve pattern and peak torque value at a time step size of dt = 0.01T differ from those observed at dt = 0.005T and 0.0005T. The average torque values between 0.01T and 0.0005T exhibit a relative difference of 15.6%, while the difference between 0.005T and 0.0005T is 4.4%. A time step size of 0.005T satisfies the numerical accuracy and computational efficiency.
|
Fig. 4 Time histories of torque for various time step sizes. |
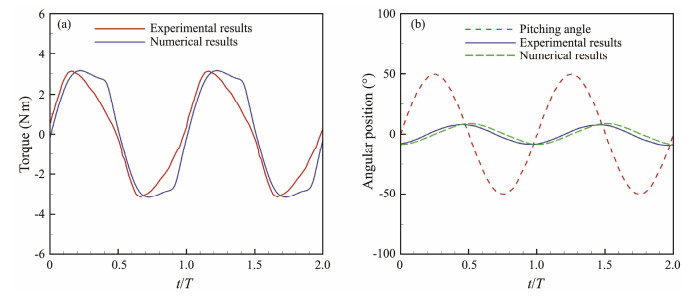
The comparison between experimental and numerical results concerning torque output and angular position is shown in Fig.5. The numerical results align closely with the experimental results. Overall, the validation results have demonstrated the capability and reliability of the present model for subsequent simulations.
|
Fig. 5 Comparison between experimental and numerical results. |
To compare the energy-harvesting performance between FAH and SAH, the effective angle of attack α0, which combines amplitudes of pitching and heaving, oscillating frequency, and incident velocity, serves as a connection. The effective angle of attack is defined as follows:
| $ {\alpha _0} = - \arctan (\frac{{\omega {h_0}}}{U}) + {\theta _0}, $ | (15) |
where ω = 2πf*U/c. Initial simulations focus on varying parameter conditions for SAH before applying the resulting kinematic parameters, namely heaving amplitude and effective angle of attack, to define FAH motions. For SAH simulations, the heaving mass is set to m = 50 kg, and the reduced frequency f* varies as 0.05, 0.075, and 0.1. The pitching amplitude is set to θ0 = 30˚, and the damping coefficient D varies from 100 to 500 with an interval of 100.
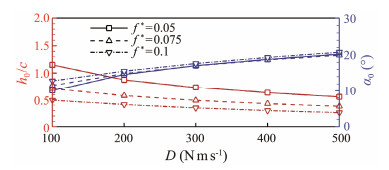
Fig.6 shows the SAH's heaving amplitude and effective angle of attack under various damping coefficients, highlighting a decrease in heaving amplitude with an increase in damping coefficient. Conversely, the effective angle of attack increases as the damping coefficient increases. For the same damping coefficient, the heaving amplitude decreases as the reduced frequency increases. The effective angle of attack shows no significant difference under various reduced frequencies. As previously stated, given that the effective angle of attack is identified as the connection, FAH simulations utilize identical effective angles of attack. In other words, the induced heaving amplitudes from SAH are transferred to FAH simulations. The phase shift φ is assumed to be 90˚ for all FAH simulations. Subsequent sections will explore the efficiencies and hydrodynamic performances of FAH and SAH. With a reduced frequency of 0.1, the heaving amplitude falls below 0.5c, indicating a blockage ratio under 5%. The blockage effects can be ignored. Therefore, the time history and flow field for the reduced frequency of 0.1 are analyzed in subsequent sections.
|
Fig. 6 Heaving amplitude and effective angle of attack under various damping coefficients. |
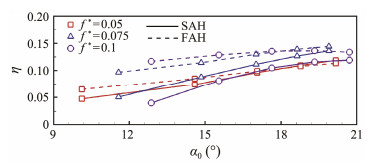
The power efficiencies of FAH and SAH are presented and compared in Fig.7, highlighting significant differences. Notably, SAH's efficiencies are obviously lower than those of FAH under various conditions. For a given f*, the relative difference in efficiencies decreases as α0 increases. At f* = 0.1, the relative efficiency difference is 191% at α0 = 12.8˚, which decreases to 12.4% at α0 = 20.7˚. The relative difference of efficiencies increases with increasing f*. The average relative differences in efficiencies are 9.6%, 30.7%, and 61.7% at f* = 0.05, 0.075, and 0.1, respectively. This suggests that employing a fully activated control strategy may lead to an overestimation of the energy-harvesting performance of oscillating hydrofoils. Further analysis of the hydrodynamic performance of both FAH and SAH would reveal the underlying reasons for these discrepancies.
|
Fig. 7 Power efficiency under various effective angles of attack. |
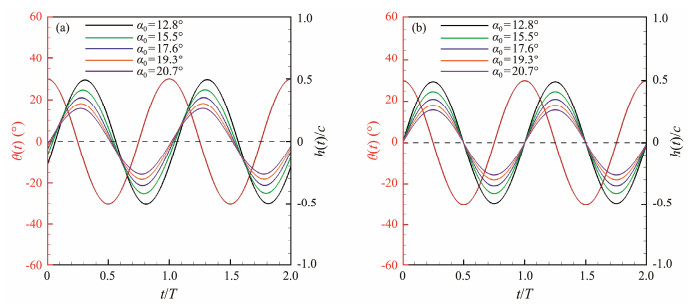
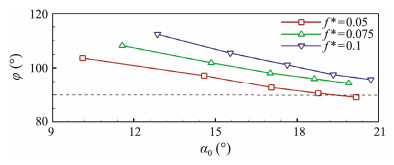
The instantaneous pitching angle and heaving position at f* = 0.1 are presented in Fig.8. For the SAH, the heaving motion is primarily induced by the water flow. The phase shift between the heaving and pitching motions of SAH is uncertain. Observations indicate that the phase shift φ of SAH decreases as the effective angle of attack increases. Specifically, phase shift φ is 112.3˚ at α0 = 12.8˚, and it decreases to 95.8˚ at α0 = 20.7˚.
|
Fig. 8 Time histories of pitching angles and heaving positions. (a), SAH; (b), FAH. |
The phase shifts φ of SAH under various reduced frequencies are presented in Fig.9. In general, the phase shift φ decreases as α0 increases and f* decreases. The effects of phase shift φ on the lift and pitching torque will be further analyzed.
|
Fig. 9 Phase shift φ under various effective angles of attack. |
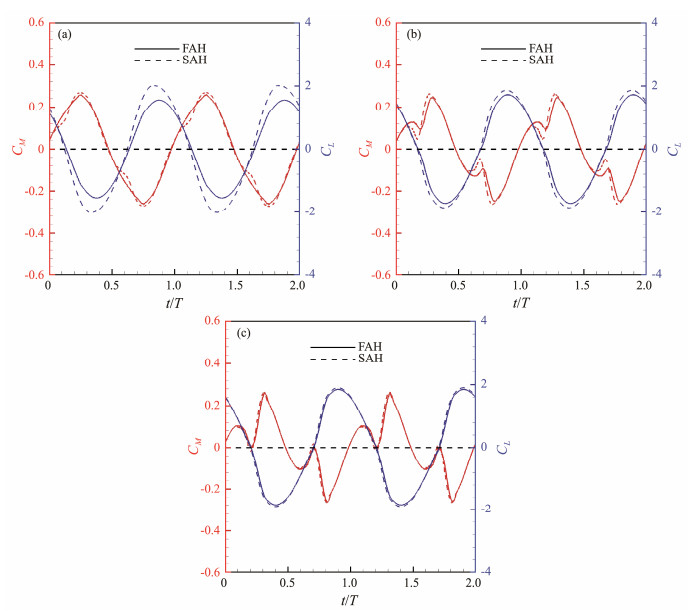
To investigate the differences in energy-harvesting performance, time histories of hydrodynamic lift and torque at f* = 0.1 are compared in Fig.10. The pitching torque of the FAH aligns closely with that of the SAH across various effective angles of attack. Conversely, notable differences in lift between FAH and SAH are observed at lower effective angles of attack, which decrease as the effective angle of attack increases. An excellent match is obtained at α0 = 20.7˚. This indicates that the hydrodynamic performance of oscillating hydrofoils is strongly affected by the phase shift φ under the same effective angle of attack. Considering the differences in hydrodynamic performance, a comparative analysis of the energy-harvesting performance between FAH and SAH should be conducted.
|
Fig. 10 Time histories of lifts and torques. (a), α0 = 12.8˚; (b), α0 = 17.6˚; (c), α0 = 20.7˚. |
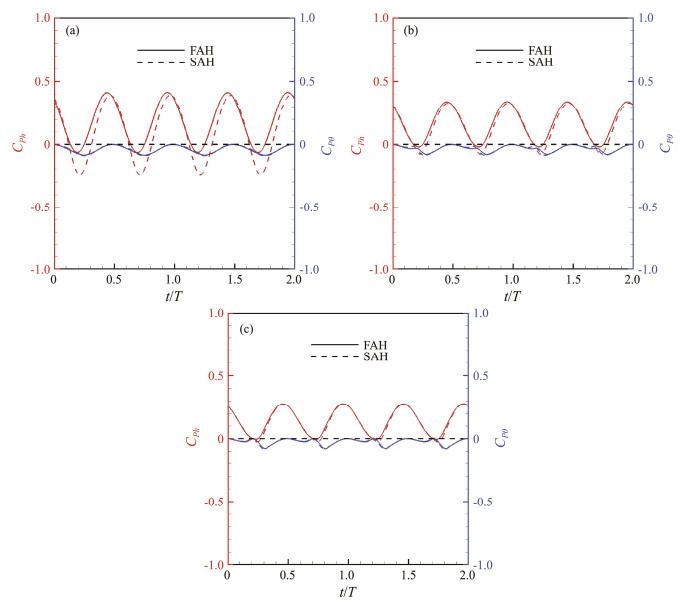
The instantaneous power coefficients of FAH and SAH are analyzed in Fig.11. A slight difference is observed in the power harvested from pitching motion across various effective angles of attack. However, a similar trend is noticed in the power harvested from heaving motion, mirroring the lift patterns noted in Fig.9. Notably, the heaving motion accounts for over 80% of the harvested power. It can be concluded that phase shift φ initially affects the hydrodynamic lift and subsequently affects the power harvested by heaving motion, causing differences in the power coefficient.
|
Fig. 11 Comparison of powers harvested by FAH and SAH. (a), α0 = 12.8˚; (b), α0 = 17.6˚; (c), α0 = 20.7˚. |
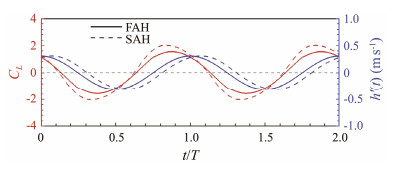
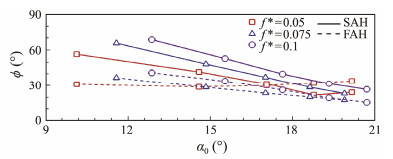
Considering the obvious difference in CPh of FAH and SAH shown in Fig.11(a), the lift and heaving velocity of FAH and SAH for α0 = 12.8˚ are compared in Fig.12. The amplitude of CL of SAH is obviously higher than that of FAH. The h′(t) amplitudes of FAH and SAH show a slight difference. The phase difference between CL and h′(t), represented by ϕ, reveals a substantial variance; FAH demonstrates a much lower difference of 40.7˚ compared to SAH's 68.4˚. This phase difference indicates the coordination of CL and h′(t), where a higher coordination leads to increased positive output power and reduced negative output power.
|
Fig. 12 Time histories of lifts and heaving velocities. |
The phase difference ϕ is presented in Fig.13, where it generally decreases with increasing α0. The phase difference ϕ of FAH is consistently lower than that of SAH. The average relative differences in ϕ are 13.8%, 56.1%, and 62.2% at f* = 0.05, 0.075, and 0.1, respectively. The lower differences in ϕ lead to diminished disparities in efficiency, as shown in Fig.7.
|
Fig. 13 Phase shift ϕ under various effective angles of attack. |
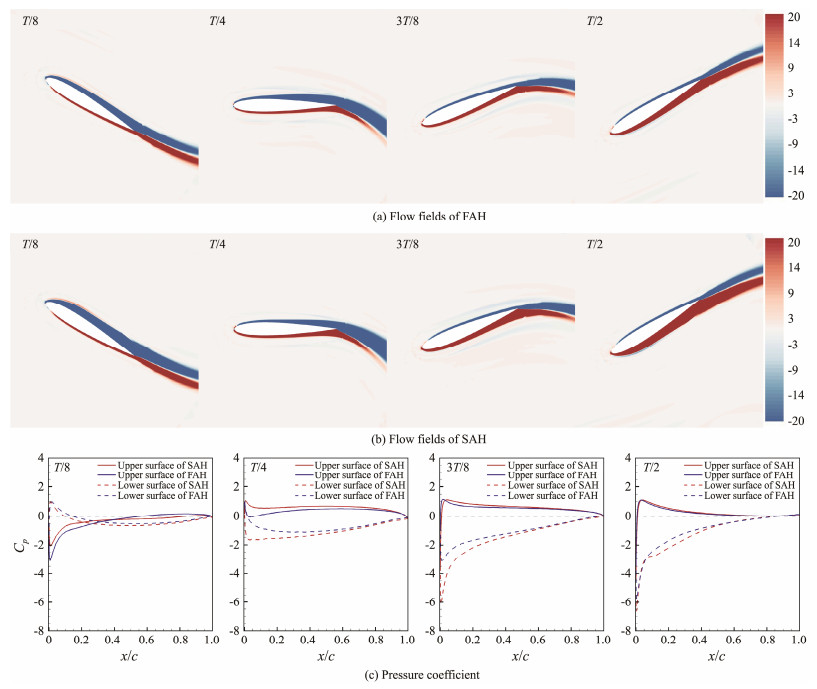
The flow fields and pressure distributions over FAH and SAH during four typical instants in half of a stable cycle are presented in Fig.14. Negative and positive shear layer vortices are distributed on the upper and lower surfaces of the oscillating hydrofoil, respectively. At t = T/8 and T/4, the thickness of the shear layer vortices on the upper surface of SAH exceeds that of FAH. At t = 3T/8 and T/2, the thickness of the shear layer vortices on the lower surface of SAH is larger than that of FAH.
|
Fig. 14 Flow fields and pressure coefficient distributions. |
The pressure distributions on the surface of FAH and SAH show obvious differences. At t = T/8, the negative pressure coefficient on the upper surface of FAH is higher than that of SAH at 0 < x/c < 0.3. At t = T/2, the pressure coefficient on both the upper and lower surfaces of SAH is higher than that of FAH. At t = 3T/8, the negative pressure coefficient on the lower surface of SAH exceeds that of FAH at 0 < x/c < 0.6, potentially enhancing negative lift. The lift of SAH is larger than that of FAH at t = T/2 and 3T/8, as shown in Fig.12. At t = 3T/8, a slight difference in pressure coefficient is shown at 0.1 < x/c < 0.5.
4 ConclusionsIn the present study, the energy-harvesting and hydrodynamic performances of oscillating hydrofoils, employing fully activated and semi-activated control strategies, were numerically examined using a 2D numerical model under identical effective angles of attack. The comparative analysis between FAH and SAH sought to delineate the differences between the two control strategies.
The results for SAH showed that the induced heaving motion and its phase shift relative to pitching motions are strongly affected by the reduced frequency and damping coefficient. The phase shifts in SAH generally exceed those in FAH, reaching 90˚. The shifts decrease as the reduced frequencies decrease and the effective angles of attack increase. The maximum phase shift can reach 112.3˚ at α0 = 12.8˚ and f* = 0.1. The difference in phase shift between FAH and SAH clearly affects the amplitude of lift and the phase difference between lift and heaving velocity, with SAH exhibiting substantially higher phase differences than those in FAH, the maximum being 68.4˚. This phase difference between lift and heaving velocity represents a coordination between them. A higher phase difference causes larger negative power output and lower average power output. As a result, the energy-harvesting performance of FAH is higher than that of SAH with a higher phase difference. The fully activated control strategy, therefore, may cause varying degrees of overestimation in energy-harvesting performance assessment.
AcknowledgementsThe research comes from the project fully supported by the Shandong Natural Science Foundation Youth Project (No. ZR2023QE075), the Open Project Program of Shandong Marine Aerospace Equipment Technological Innovation Center (No. MAETIC202210), and the Shandong Natural Science Foundation Project (No. ZR2022ME145).
Author Contributions
All authors contributed to the study conception and design. Conceptualization, methodology and investigation were performed by Hengliang Qu. The writing-review and editing, funding acquisition and supervision were performed by Xueyan Li. Data curation, methodology and software were performed by Hongyuan Shi and Xiaochen Dong. All authors commented on previous versions of the manuscript. All authors read and approved the final manuscript.
Data Availability
All data generated and analyzed during this study are included in this published article and its additional files.
Declarations
Ethics Approval and Consent to Participate
This article does not contain any studies with human participants or animals performed by any of the authors.
Consent for Publication
Informed consent for publication was obtained from all participants.
Conflict of Interests
The authors declare that they have no conflict of interests.
Chen, Y., Zhan, J., Wu, J., and Wu, J., 2017. A fully-activated flapping foil in wind gust energy harvesting performance. Ocean Engineering, 138: 112-122. DOI:10.1016/j.oceaneng.2017.04.027 (  0) 0) |
Cho, H., and Zhu, Q., 2014. Performance of a flapping foil flow energy harvester in shear flows. Journal of Fluids and Structures, 51: 199-210. DOI:10.1016/j.jfluidstructs.2014.08.007 (  0) 0) |
Davids, S. T., 1999. A Computational and experimental investigation of a flutter generator. Master thesis. Department of Aeronautics and Astronautics, Naval Postgraduate School.
(  0) 0) |
Deng, J., Teng, L., Pan, D., and Shao, X., 2015. Inertial effects of the semi-passive flapping foil on its energy extraction efficiency. Physics of Fluids, 27: 174-191. (  0) 0) |
Deng, J., Wang, S., Kandel, P., and Teng, L., 2022. Effects of free surface on a flapping-foil based ocean current energy extractor. Renewable Energy, 181: 933-944. DOI:10.1016/j.renene.2021.09.098 (  0) 0) |
Farooq, H., Ghommen, M., Khalid, M., and Akhtar, L., 2022. Numerical investigation of hydrodynamic performance of flapping foils for energy harvesting. Ocean Engineering, 260: 112002. DOI:10.1016/j.oceaneng.2022.112002 (  0) 0) |
Gauthier, E., Kinsey, T., and Dumas, G., 2016. Impact of blockage on the hydrodynamic performance of oscillating-foils hydrokinetic turbines. Journal of Fluids Engineering, 138: 091103. DOI:10.1115/1.4033298 (  0) 0) |
He, G. H., Mo, W., Gao, Y., Zhang, Z., Wang, J., Wang, W., et al., 2021. Modification of effective angle of attack on hydrofoil power extraction. Ocean Engineering, 240: 109919. DOI:10.1016/j.oceaneng.2021.109919 (  0) 0) |
He, G. H., Yang, H., Mo, W., Zhao, Z., Wang, W., and Ghassemi, H., 2022. Influence of inter-foil spacing on energy extraction of tandem oscillating hydrofoils. Ocean Engineering, 259: 111953. DOI:10.1016/j.oceaneng.2022.111953 (  0) 0) |
Hu, J., and Xiao, Q., 2014. Three-dimensional effects on the translational locomotion of a passive heaving wing. Journal of Fluids and Structures, 46: 77-88. DOI:10.1016/j.jfluidstructs.2013.12.012 (  0) 0) |
Huxham, G. H., Cochard, S., and Patterson, J., 2012. Experimental parametric investigation of an oscillating hydrofoil tidal stream energy converter. The 18th Australasian Fluid Mechanics Conference. Launceston, Australia, 1-4.
(  0) 0) |
Jones, K. D., and Platzer, M. F., 1997. Numerical computation of flapping-wing propulsion and power extraction. 35th Aerospace Sciences Meeting and Exhibit. Monterey, 1-16.
(  0) 0) |
Kim, D., Strom, B., Mandre, S., and Breuer, K., 2017. Energy harvesting performance and flow structure of an oscillating hydrofoil with finite span. Journal of Fluids and Structures, 70: 314-326. DOI:10.1016/j.jfluidstructs.2017.02.004 (  0) 0) |
Kinsey, T., and Dumas, G., 2008. Parametric study of an oscillating airfoil in power extraction regime. AIAA Journal, 46: 1318-1330. DOI:10.2514/1.26253 (  0) 0) |
Lindsey, K. A., 2002. A feasibility study of oscillating-wing power generators. Master thesis. Department of Aeronautics and Astronautics, Naval Postgraduate School.
(  0) 0) |
Liu, Z., Qu, H. L., and Shi, H. D., 2019. Performance evaluation and enhancement of a semi-activated flapping hydrofoil in shear flows. Energy, 189: 116255. DOI:10.1016/j.energy.2019.116255 (  0) 0) |
Ma, P., Wang, Y., Xie, Y., and Huo, Z., 2018. Effects of time-varying freestream velocity on energy harvesting using an oscillating foil. Ocean Engineering, 153: 353-362. DOI:10.1016/j.oceaneng.2018.01.115 (  0) 0) |
McKinney, W., and DeLaurier, J., 1985. Wingmill: An oscillating-wing windmill. Journal of Energy, 5: 109-115. (  0) 0) |
Poirel, D., Harris, Y., and Benaissa, A., 2008. Self-sustained aeroelastic oscillations of a NACA0012 airfoil at low-to-moderate Reynolds numbers. Journal of Fluids and Structures, 24: 700-719. DOI:10.1016/j.jfluidstructs.2007.11.005 (  0) 0) |
Pourmahdavi, M., Safari, M. N., and Derakhshan, S., 2019. Numerical investigation of the power extraction mechanism of flapping foil tidal energy harvesting devices. Energy and Environment, 30: 193-211. DOI:10.1177/0958305X18787320 (  0) 0) |
Rostami, A. B., and Armandei, M., 2017. Renewable energy harvesting by vortex-induced motions: Review and benchmarking of technologies. Renewable and Sustainable Energy Reviews, 70: 193-214. DOI:10.1016/j.rser.2016.11.202 (  0) 0) |
Sitorus, P., and Ko, J., 2019. Power extraction performance of three types of flapping hydrofoils at a Reynolds number of 1.7E6. Renewable Energy, 132: 106-118. DOI:10.1016/j.renene.2018.07.116 (  0) 0) |
Wu, X., Zhang, X. T., Tian, X. L., Li, X., and Lu, W., 2020. A review on fluid dynamics of flapping foils. Ocean Engineering, 195: 106712. DOI:10.1016/j.oceaneng.2019.106712 (  0) 0) |
Xiao, Q., and Zhu, Q., 2014. A review on flow energy harvesters based on flapping foils. Journal of Fluids and Structures, 46: 174-191. DOI:10.1016/j.jfluidstructs.2014.01.002 (  0) 0) |
Yang, H., He, G. H., Mao, W. H., and Ghassemi, H., 2023. Blockage effect and ground effect on oscillating hydrofoil. Ocean Engineering, 286: 115680. DOI:10.1016/j.oceaneng.2023.115680 (  0) 0) |
Yu, M., Wang, B., Wang, Z. J., and Farokhi, S., 2018. Evolution of vortex structures over flapping foils in shear flows and its impact on aerodynamic performance. Journal of Fluids and Structures, 76: 116-134. DOI:10.1016/j.jfluidstructs.2017.09.012 (  0) 0) |
Zhu, B., Zhang, J., and Zhang, W., 2020. Impact of the ground effect on the energy extraction properties of a flapping wing. Ocean Engineering, 209: 107376. DOI:10.1016/j.oceaneng.2020.107376 (  0) 0) |
Zhu, Q., and Zhang, L. P., 2009. Mode coupling and flow energy harvesting by a flapping foil. Physics of Fluids, 21: 033601. DOI:10.1063/1.3092484 (  0) 0) |
Zhu, Q., Haase, M., and Wu, C. H., 2009. Modeling the capacity of a novel flow-energy harvester. Applied Mathematical Modeling, 33: 2207-2217. DOI:10.1016/j.apm.2008.05.027 (  0) 0) |
 2025, Vol. 24


