2) Physical Oceanography Laboratory, Ocean University of China, Qingdao 266100, China;
3) Qingdao National Laboratory for Marine Science and Technology, Qingdao 266103, China;
4) North China Sea Marine Forecasting Center of State Oceanic Administration, Qingdao 266033, China
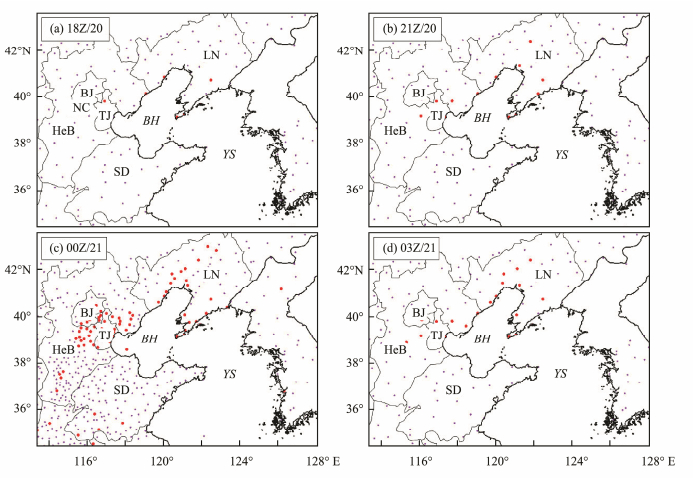
Fog is a boundary-layer weather phenomenon that reduces atmospheric horizontal visibility (AHV) to less than 1 km, with abundant suspended ice crystals or water droplets in the near-surface atmosphere (Glickman, 2000). Fog has a serious adverse impact on transportation (i.e., air, marine, and road traffic). For regions with a high frequency of fog occurrence and increasingly heavy traffic, such as the coastal regions of North China (including Beijing, Tianjin and Hebei, Fig. 1a), fog has become a high-impact weather phenomenon (Niu et al., 2010). Accurate numerical weather prediction of fog is of increasing interest. However, current fog forecasting capabilities are very limited, probably due to lack of understanding of predictability and physical mechanism of fog formation.
|
Fig. 1 Fog coverage (visibility < 1000 m) according to visibility observations of surface stations (denoted by dots). The red and purple dots for observed visibility of < 1000 m and > 1000 m, respectively. LN, Liaoning Province; BJ, Beijing; TJ, Tianjin; HeB, Hebei Province; SD, Shandong Province; BH, Bohai Sea; YS, Yellow Sea; NC, North China. Coastal regions of North China include BJ, TJ and HeB. |
In recent years, studies on fog predictability have focused mainly on providing better description of meso-and small-scale physical processes (i.e., advection, radiation, turbulent mixing, and condensation) associated with fog formation (Zhou and Ferrier, 2008; Zhou, 2011). Finer model resolutions, especially within the planetary boundary layer (PBL), have been used (Muller, 2006). More appropriate physical parameterization schemes, especially PBL and microphysical parameterization schemes, have been applied (Lu et al., 2014). Data assimilation to improve characterization of the initial temperature, moisture and wind conditions, especially within PBL, has been commonly applied for fog forecasting (Wang et al., 2012; Hu et al., 2017a, b). Despite those improvements, current fog forecasting capability cannot satisfy practical operational demands.
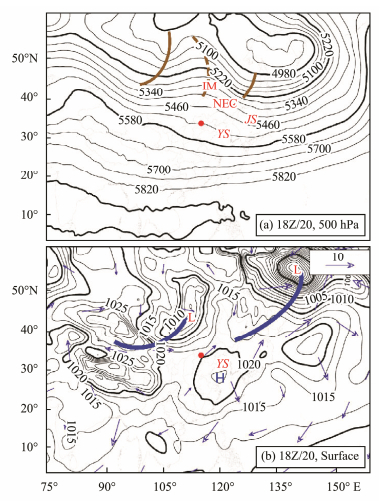
Besides meso-and small-scale physical processes, fog formation has been shown to be closely associated with synoptic-scale circulation (Wang 1985; Huang et al., 2011); here, fog along the coastal regions of North China can serve as an example. Huang et al. (2011) pointed out that in winter and spring, a frequent synoptic pattern favorable for fog formation occurs along the coastal regions of North China: the so-called cold-front synoptic pattern (CFSP). The CFSP is characterized by a surface high over the sea in the southeast direction after the passage of a cold front, accompanied by a dominant high-level ridge behind the trough corresponding to the cold front. Specifically, upper-level circulation moves eastward in a trough-ridge-trough form, with the region of interest being dominated by the ridge. Closer to the surface, passage of the cold front over the region of interest pushes the surface high to the southeast over the sea (schematic diagram in Fig. 2). The CFSP tends to provide synoptic conditions conducive to fog formation: a colder local surface due to cold-front passage, abundant warm moist backflow from the surface high, and stable high-level situation due to the dominant ridge. Despite the frequent occurrence of this synoptic pattern, fog forecasting in coastal regions of North China remains challenging. For example, operational weather prediction systems in China failed to predict a fog event with a typical CFSP in the region on 20 February 2007; the fog event led to serious local economic losses. Thus, there is an increasing interest in improving predictions of fog events, especially those associated with the CFSP.
|
Fig. 2 Schematic diagram of the cold-front synoptic pattern (CFSP), and synoptic review of the fog event of the studied case: synoptic chart at 500-hPa (a) and the surface (b), respectively, at 1200 UTC 20 February 2007 (before actual fog formation). The brown solid and dashed lines in (a) represent the trough and ridge lines. The blue thick lines in (b) represent the locations of cold front. Blue vectors in (b) represent 10-m horizontal wind. IM, Inner Mongolia; NEC, Northeast China; JS, Japan Sea. This figure is plotted based on NCEP Final Analysis (FNL) data. |
Based on this typical fog case, Hu et al. (2014) conducted a preliminary study of CFSP fog using the Weather and Research Forecasting (WRF) model and a 40-member ensemble. Ensemble members are generated by adding small random perturbations to the initial conditions. The results of the study showed considerable variability in fog forecasting performance among ensemble members. Based on budget analyses of temperature and moisture, advection was identified as the key contributor to fog formation in this case. Additionally, compared with the bad-performing ensemble members, good-performing ensemble members tended to show continuous warm moist advection in the regions of interest (Hu et al., 2014). Here, the questions that arise are as follows: are there any significant synoptic-scale differences between good-and bad-performing ensemble members? If so, how do these synoptic-scale differences affect fog forecasting performance with this synoptic pattern? To date, these questions remain unanswered.
In this study, we examined predictability of the CFSP fog case occurring on 20 February 2007 along coastal regions of North China with regard to these two above-mentioned questions. Based on the method adopted by Hu et al.(2014), a 40-member ensemble forecast was conducted using the WRF model with perturbing initial conditions. A group of ensemble members with good fog forecasting performance (hereafter referred to as Group Good) and the other one with bad forecasting performance (hereafter referred to as Group Bad) are selected from the ensemble forecast. Composite analyses were conducted by comparing group-averaged differences of physical fields between these two groups.
This paper is structured as follows. Section 2 presents a case overview. Section 3 describes the methodology, including a brief description of the WRF model, ensemble forecasts, and the evaluation method. Section 4 gives fog forecast results and detailed composite analyses of the performance of Group Good and Group Bad. To verify conclusions obtained from composite analyses, additional analyses based on a simple operational forecast system are also conducted in Section 4. Section 5 includes further discussion and a summary of our findings.
2 Case OverviewFig. 1 shows the surface-observed visibility (denoted by dots) obtained from the meteorological network of the China Meteorological Administration (CMA). At 1800 UTC 20 February 2007 (0200 local standard time (LST) 21 February 2007), fog (red dots) covered Liaoning Province, the northwest coastal region of Bohai Sea, and Tianjin (Fig. 1a). Three hours later, the fog coverage had expanded to Beijing (Fig. 1b). At 0000 UTC 21 February 2007, most of North China was covered by fog (Fig. 1c). Three hours later (0300 UTC 21 February 2007), with the local sunrise, despite dissipation of the fog over southeastern Hebei and southern Shandong provinces, fog coverage largely persisted along the coastal regions of North China (Fig. 1d). This fog event led to the cancellation and delay of 234 and 500 flights, respectively, with over 30, 000 travelers being stranded at Beijing International Airport (Liang et al., 2009).
The main CFSP circulation characteristics were discussed in the previous section. For this fog case (Fig. 2), at 1200 UTC 20 February 2007 (before fog formation), North China was dominated by high-level ridge. At the surface, a cold front (in the east; thick blue line in Fig. 2b) passed downstream. North China was in the transition zone of a surface low over land to the northwest and a surface high over the sea to the southeast. Warm moisture was transported to North China in an anticyclone path from the sea. Both upper-level circulation and surface synoptic conditions were conducive to fog formation along the coastal regions of North China. Fog dissipated when the cold front in the west, accompanied by the trough in the west, arrived in North China. In this study, we focused only on the fog formation stage.
3 Methodology 3.1 Model Configuration for Ensemble ForecastingWe used the Advanced Research WRF model (ARW; version 3.3.1) (Skamarock et al., 2008) for fog forecasts. The model configuration and physical parameterization schemes were as follows. Three two-way nested domains (Fig. 3 of Hu et al., 2014), with horizontal resolutions of 27 km (D01), 9 km (D02), and 3 km (D03), were applied. Each domain has 40 full sigma levels, with 7 sigma levels below 1 km①, and a model top of 50 hPa. More realistic vegetation information was used for D03 based on the 500-m land use data of the year 2000 (Zhang et al., 2007), as opposed to the conventional 30-s United States Geological Survey (USGS) land use data (Hitt, 1994). The WRF single-moment (WSM) 6-class microphysics scheme (Hong and Lim, 2006), rapid radiative transfer model (RRTM) longwave radiation scheme (Mlawer et al., 1997), Dudhia shortwave radiation scheme (Dudhia, 1989), and quasi-normal scale elimination (QNSE) PBL and surface layer schemes (Sukoriansky et al., 2005) were employed for all three domains. The Kain–Fritsch cumulus scheme (Kain, 2004) was applied only for D01 and D02.
① The heights were approximately 27, 94, 184, 299, 444, 630, and 859 m.
|
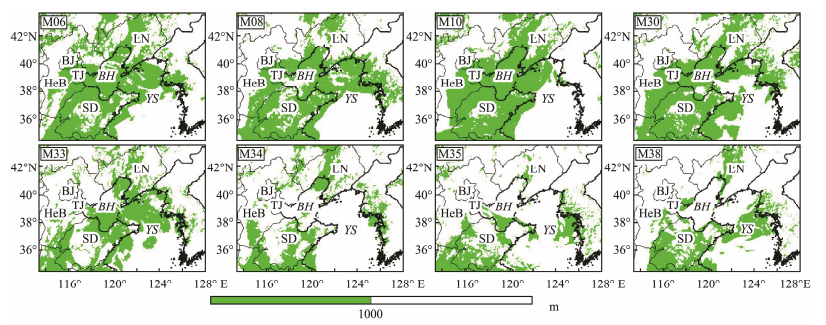
Fig. 3 Simulated fog coverage (area of atmospheric horizontal visibility (AHV) < 1000 m; shaded area) for ensemble members in Group Good (top row) and Group Bad (bottom row) at 0000 UTC 21 February 2007, at the first model vertical level in the innermost model domain (D03: horizontal resolution of 3 km). Abbreviations are the same as in Fig. 1. |
An ensemble forecast of 40 members was generated with the same model configuration, physical parameterization schemes, and boundary conditions, with the exception of the initial conditions. Ensemble forecasts were initialized at 0000 UTC 20 February 2007 and were integrated for 27 h. Boundary conditions for all 40 ensemble members were obtained from the 6-h National Centers for Environmental Prediction (NCEP) final analysis (FNL) data with a horizontal resolution of 1˚×1˚. Similar to Hu et al. (2014), the initial conditions of the ensemble forecasts were generated by randomly perturbing the initial conditions interpolated from FNL data at 0000 UTC 20 February 2007 (the initial time). Perturbations were obtained by random sampling of the background error covariance from the WRF data assimilation system (WRFDA)(Barker et al., 2004). The standard deviations of the initial ensemble were 0.3 g kg−1 for the water vapor mixing ratio (Qv), 3 m s−1 for wind speed, and 1.2 K for air temperature.
3.2 Verification MethodAccurate prediction of AHV is a key criterion for successful fog forecasting. In this study, the AHV calculation applied was the same as that of Hu et al.(2014, 2017a, 2017b). The relationship between visibility and mixed phase water content (MWC) is defined as follows:
| $ AHV= -1000 \times \ln (0.02)/\beta, $ | (1) |
where AHV is in units of m. The extinction coefficient β is given by:
| $ \beta {\rm{=}}144.7MW{C^{0.88}}, $ | (2) |
where MWC is the summation of water vapor, cloud ice, cloud water, snow, and rain, with units of g m−3.
To quantitatively evaluate fog forecasting performance, the equitable threat score (ETS), probability of detection (POD), false alarm ratio (FAR), and missing ratio (MR) were used as accuracy measures. Considering fog observations/forecasts as binary events (1=true, 0=false), the predictive skill scores can be calculated as follows:
| $ ETS = \frac{{H -R}}{{F + O -H -R}}, $ | (3) |
| $ POD = \frac{H}{O}, $ | (4) |
| $ FAR = \frac{{F -H}}{F}, $ | (5) |
| $ MR = \frac{{O -H}}{O}, $ | (6) |
where F, O, and H represent fog forecasts, fog observations, and correct fog forecasts (hits), respectively. R is defined as a random hit penalty, where R=F×O/N, and N is the total number of observation stations at the corresponding verification time (Zhou and Du, 2010). Larger values of ETS and POD (smaller values of FAR and MR) indicate better forecasting performance.
The forecasting performance of each member in the ensemble forecasts is evaluated objectively through comprehensive consideration of predictive skill scores (ETS, POD, FAR and MR). The ensemble members with better forecasting performance are those that have larger ETS and POD values and smaller FAR and MR values. The simulated AHV at the first model vertical level (hereafter referred to as Lev1) at each observation station (dots in Fig. 1) is compared against the corresponding surface-observed visibility every 3 h from 1200 UTC 20 February 2007 to 0300 UTC 21 February 2007. The temporal-averaged predictive skill scores (hereafter referred to as avg-ETS, avg-POD, avg-FAR, and avg-MR) for the 40 ensemble members were calculated; the top and bottom 25% of members for all four predictive skill scores were defined as good and bad members, respectively. For example, a member having both avg-ETS and avg-POD in the top 25%, as well as both avg-FAR and avg-MR in the bottom 25%, among all 40 members was defined as a good member. As mentioned above, the group consisting of good (bad) members is defined as Group Good (Bad) in this study.
4 Results 4.1 Fog Forecast Results of Group Good and Group BadBased on the temporal-averaged scores for 40 ensemble members (Table 1), M06, M08, M10 and M30 were assigned to Group Good; M33, M34, M35 and M38 were assigned to Group Bad. One representative time (0000 UTC 21 February 2007, fog mature stage) was selected to present simulated fog coverage of the two groups (Fig. 3). Compared with surface visibility observations (dots in Fig. 1c), fog coverage in Shandong Province was generally captured by both groups. However, for Beijing, Tianjin, and coastal region of Hebei Province, simulated fog coverage in Group Good was much closer to actual observations than that of Group Bad. In Group Bad, fog coverage in these regions was generally missed.
|
|
Table 1 Average predictive skill scores (avg-ETS, avg-POD, avg-FAR, and avg-MR) for GFS Run, Group Good and Group Bad |
Composite analyses were conducted focusing on three aspects: synoptic-scale circulation, advection, and the synoptic conditions of temperature stratification and moisture. First, as mentioned in the Introduction section, fog formation is significantly associated with synoptic-scale circulation. In this study, we compared the circulation fields in the upper and surface levels between the two groups. Second, our preliminary study showed that advection is the main factor contributing to CFSP fog formation (Hu et al., 2014). How do differences of synoptic-scale circulation affect advection? To answer this question, temperature and moisture advection were analyzed. Third, the ultimate concern of this study is fog forecasting performance. Previous studies have shown that stable temperature stratification and abundant moisture are the required synoptic conditions conducive to fog formation (Wang, 1985; Fu et al., 2010). How do differences of advection affect the synoptic conditions of temperature stratification and moisture, and hence affect fog forecasting performance? To answer this question, composite analyses of temperature stratification and moisture were conducted. To identify significant differences in the physical fields of the two forecasting groups (Group Bad minus Group Good), t-tests were performed, with the level of significance set at 0.1.
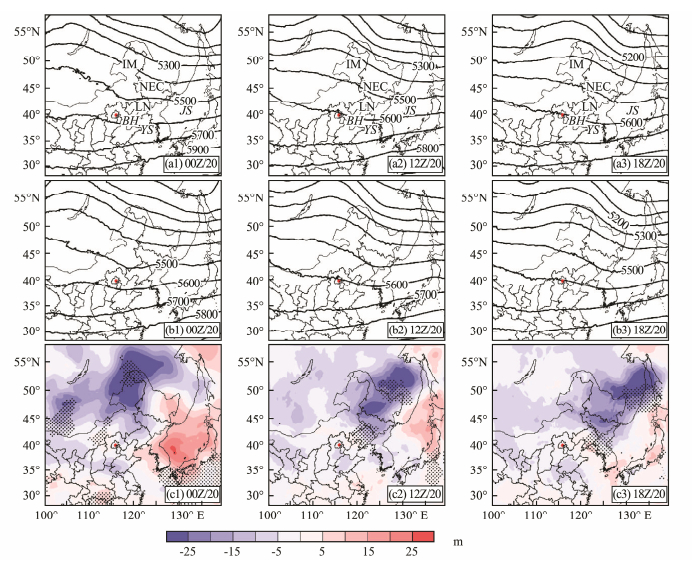
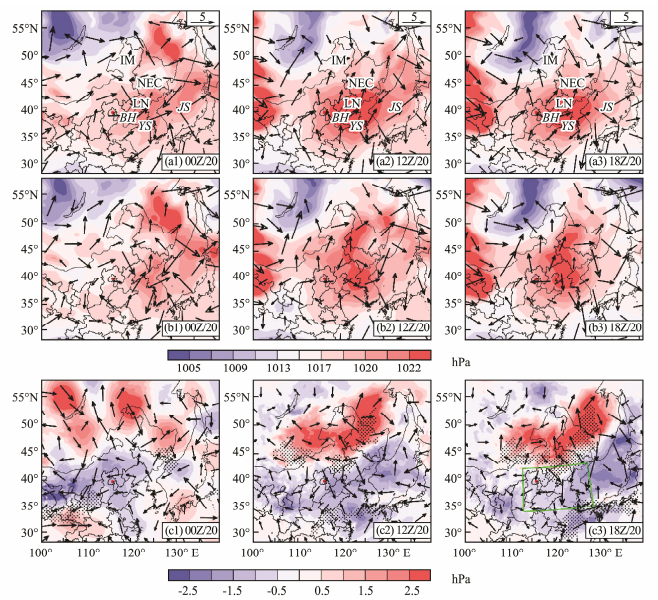
4.2.1 Circulation fieldThe composite fields of 500-hPa height and surface level pressures for the two groups are shown in Figs. 4 and 5, respectively. At 500-hPa, both groups captured the major movements of the trough and subsequent ridge as they traveled eastward (Figs. 4a, b). Correspondingly, both groups also identified a surface low to the northwest of North China over land, and a surface high to the southeast over the sea (Figs. 5a, b). However, compared with Group Good, initially at 500 hPa, Group Bad showed that the ridge was significantly weaker northwest of Inner Mongolia (over land; location in Fig. 4a), and the trough was significantly stronger above the Japan Sea (over the sea; location in Fig. 4a). Additionally, the significantly weaker differences over land moved eastward with movement of the ridge, and the significantly stronger differences over the sea remained (Fig. 4c).
|
Fig. 4 Composite fields of geopotential height at 500-hPa at 0000UTC 20 (initial time), 1200 UTC 20 (before fog formation), and 18 UTC 20 (fog formation stage) February 2007, in D01, for ensemble members in Group Good (top) and Group Bad (middle), and differences (Bad minus Good) between the two groups (bottom). The red dots in all subpanel show the location of Beijing. Stippled areas (black) in the bottom row indicate differences that are significant at the 90% level, based on t test. D01: horizontal resolution of 27 km. Abbreviations are the same as in Fig. 2. |
|
Fig. 5 Same as in Fig. 4, but for sea level pressure (contours every 2.5 hPa) and horizontal wind (reference vector of 5 m s−1), at the first model vertical level in D01. Stippled areas in the bottom row represent significant regions for differences of sea level pressure. The green box in (c3) is the innermost model domain (D03). Figs. 6–9 are plotted in D03. Horizontal resolutions are 27, 9 and 3 km for D01, D02 and D03, respectively. |

|
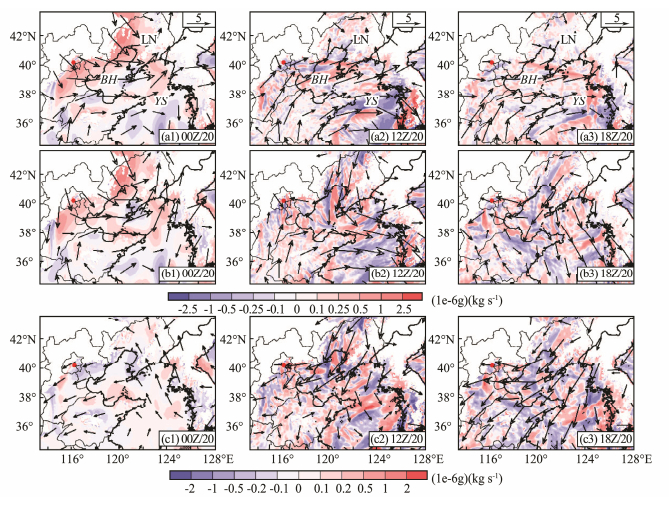
Fig. 6 Same as Fig. 4 but for temperature advection (shading) and wind (reference vector of 5 m s−1) at 975 hPa in D03. Stippled areas in the bottom row represent significant regions for differences of temperature advection. |
|
Fig. 7 Same as Fig. 4 but for specific humidity advection (shading) and wind (reference vector of 5 m s−1) at 975 hPa in D03. Stippled areas in the bottom row represent significant regions for differences of specific humidity advection. |
|
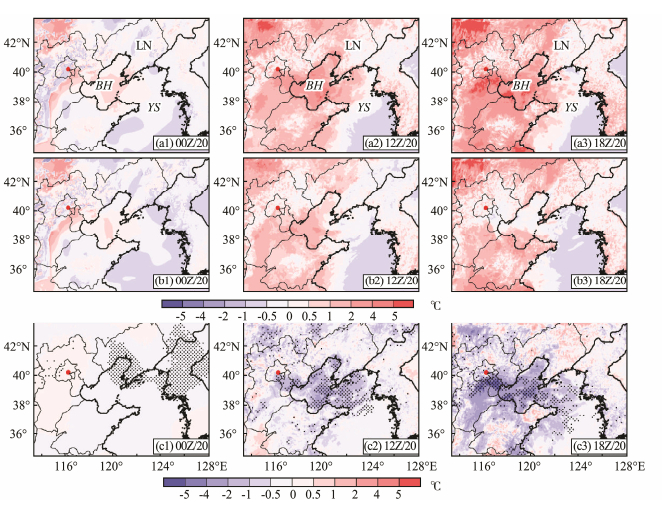
Fig. 8 Same as Fig. 4 but for vertical difference in temperature (T_dif) between the first (Lev1) and second (Lev2) vertical model levels (Lev2 minus Lev1) in D03. Positive T_dif means stable stratification. |
|
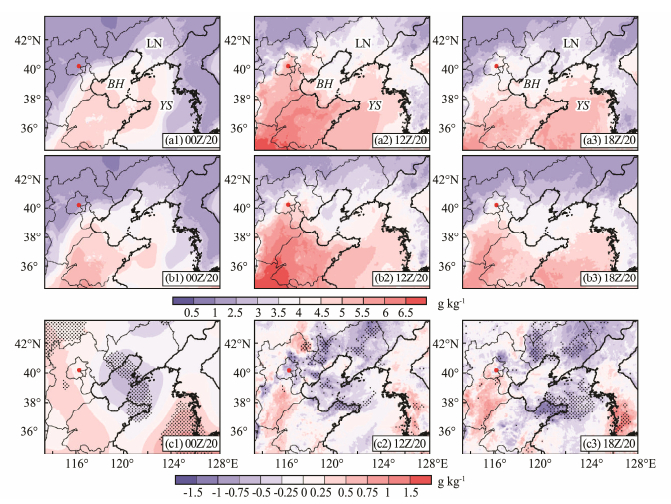
Fig. 9 Same as Fig. 4 but for specific humidity at Lev1 in D03. |
Correspondingly, at the surface, the initial pressure over land northwest of Inner Mongolia was obviously higher in Group Bad (Fig. 5c1). These significantly higher-pressure differences moved eastward with movement of the high-level ridge. Initially, the surface high over the sea was significantly weaker in Group Bad (Fig. 5c1), and this situation persisted (Figs. 5c2–3). The change in pressure gradient, due to a weaker surface high over the sea and higher pressure over land, led to changes in strength and direction of steering flows both in the coastal regions of North China and the Bohai Sea. That is, weaker surface high over the sea and higher pressure over land prevented southerly steering flows from reaching North China and enhanced northerly steering flows to North China. This agrees well with the northerly differences of steering flow in the focus region at 1800 UTC 20 February 2007 (actual fog formation stage; Fig. 5c3). Given that advection is the key factor contributing to fog formation in this CFSP case (Hu et al., 2014), how does the change in steering flow affect advection? To investigate this question in detail, the following analyses were conducted in D03 (green box in Fig. 5c3), mainly covering the coastal regions of North China and the Bohai Sea.
4.2.2 AdvectionIn Group Good, initially, the coastal regions of North China and the Bohai Sea were dominated by warm moist advection moving northward from the sea, and this situation persisted (Figs. 6a, 7a). This agrees well with our preliminary results that good-performing members have continuous warm moist advection to the regions of interest (Hu et al., 2014).
In Group Bad, as differences in steering flow varied with easterly movement of the ridge–trough system, the regions of interest were initially dominated by warm moist advection from the sea (Figs. 6b1, 7b1), but were subsequently controlled by both southerly warm moist advection and northerly cold dry advection at 1200 UTC 20 February 2007 (before actual fog formation). Finally, Group Bad was dominated by cold dry northerly advection at 1800 UTC 20 February 2007 (actual fog formation stage). This agrees well with the situation of the difference field: the differences of advection in the regions of interest gradually became cold and dry, with changes in steering flows (Figs. 6c, 7c). How do cold dry advection differences affect fog forecasts? To answer this question, local synoptic conditions (temperature stratification and moisture) underlying fog formation were discussed in the following subsection.
4.2.3 Temperature stratification and moistureTo compare the temperature stratification, vertical differences of temperature (hereafter referred to as T_dif) between the first and second vertical model levels (hereafter referred to as Lev1 and Lev2, Lev2 minus Lev1) are presented in Fig. 8. Positive T_dif indicates more stable stratification. Compared with Group Good, the temperature stratification in Group Bad was significantly less stable over Liaoning Province at the initial time. At 1800 UTC 20 February 2007 (actual fog formation stage, Fig. 8c), the less stable (negative) differences expanded southwestward to the Bohai and Yellow seas, as well as to most of North China. This agrees well with the northerly cold advection seen in Group Bad (Section 4.2.2). Regarding moisture filed, compared with Group Good (Fig. 9a), regions of Liaoning Province, the northern coastal region of North China and the Bohai Sea were initially significantly drier in Group Bad (Fig. 9c1). Later, the dryness differences expanded southwestward to Tianjin, Beijing, and Shandong Province, with statistically significance, at 1800 UTC 20 February 2007 (Fig. 9c3). This agrees well with the northerly dry advection predicted by Group Bad (Section 4.2.2). The local synoptic conditions of less stable temperature stratification and inadequate moisture over the coastal regions of North China and the Bohai and Yellow seas led to the failure of fog forecast ing in these regions in Group Bad (Fig. 3).
4.3 Validation by Simple Operational ForecastThe results from Section 4.2 suggest that the main synoptic-scale factor allowing successful fog predictions are predicted strength of the ridge over land and of the trough over the sea, and the associated low-high surface system in corresponding regions. Group Bad showed a weaker ridge over land behind a stronger trough over the sea, as well as an associated weaker surface high to the southeast over the sea and higher pressure to the northwest over land. This led to a change in steering flow, both in strength and direction, in the focus regions (coastal regions of North China, the Bohai and Yellow seas), with inhibiting warm moist advection transported from the sea and enhanced cold dry advection transported from land. Consequently, this produced adverse local synoptic conditions for fog formation, with less stable stratification and inadequate moisture in the focus regions.
As mentioned in the Introduction section, the operational weather prediction systems in China failed to predict the 20 February 2007 fog event. Can we explain the failure of the operational prediction systems from perspective of synoptic-scale circulation based on conclusions drawn from the composite analyses? To answer this question, an additional model run was conducted with both initial and boundary conditions provided by data from the Global Forecast System (GFS). All other model configuration and physical parameterization schemes were the same as those of the ensemble forecast (Section 3.1). As GFS data is often used by forecasters for operational weather prediction, the additional run (hereafter referred to as GFS Run) was regarded as a simple operational forecast system in this study.
The predictive skill scores for GFS Run are listed in Table 1. For convenience of comparison, the average scores among 40 ensemble members (hereafter referred to as ensemble mean scores) were also calculated (Table 1). Compared with the ensemble mean scores, the GFS Run scores were slightly worse (smaller values for avg-ETS and avg-POD; larger values for avg-FAR and avg-MR). This indicates that skill of fog forecasting was slightly lower for GFS run than the ensemble mean, which could be considered, to an extent, an evidence to validate our conclusions.
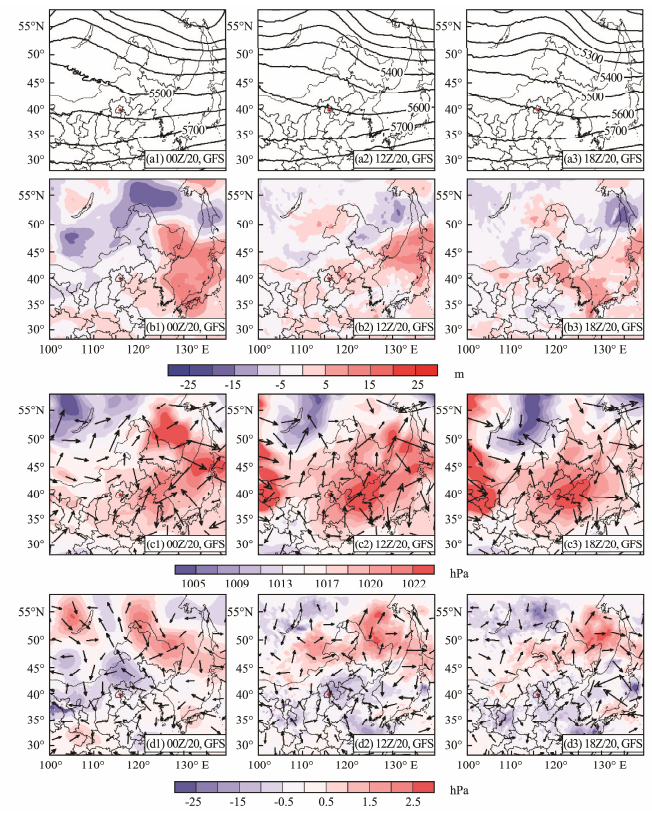
Similar to the physical analyses comparing Group Good and Group Bad, we physically compared Group Good and GFS Run; the physical fields of GFS Run, in stead of averaged fields of Group Bad, were included in this analysis. In general, the key characteristics of synoptic-scale circulation in the upper level and at the surface, especially in the significant regions, and the evolutions thereof, (Section 4.2) were also observed in the comparison between Group Good and GFS Run, although to a lesser extent. Compared with Group Good, GFS Run showed a weaker ridge over land moving eastward and a stronger focus trough over the sea (Fig. 10b). Additionally, higher pressure over land moving eastward and a weaker surface high over the sea persisted (Fig. 10d). The northerly differences in steering flows over the North China and the Bohai Sea were also evident (Fig. 10d). The corresponding advection, temperature stratification and moisture (figures not shown) were similar to the situation discussed in Section 4.2. Thus, conclusions drawn from our composite analyses of Group Good and Group Bad appear to deserve credibility.
|
Fig. 10 First and second rows: field of geopotential height at 500 hPa at 0000UTC 20 (initial time), 1200 UTC 20 (before fog formation), and 18 UTC 20 (fog formation stage), February 2007, in D01 for (a) the Global Forecasting System (GFS) run, and (b) differences between the GFS Run and the composite field of Group Good. Third and fourth rows: same as the first and second rows but for sea level pressure and horizontal wind at Lev1 in D01. The first and second rows correspond to Figs. 4b and 4c, respectively; The third and fourth rows correspond to Figs. 5b and 5c, respectively. |
This study investigated the predictability of a fog event along the coastal region of North China with typical cold-front synoptic pattern (CFSP) on 20 February 2007 from the perspective of synoptic-scale circulation. The CFSP for fog formation is characterized by a surface high over the sea after the passage of a cold front, and a dominant high-level ridge behind a trough corresponding to the cold front. Composite analyses are conducted based on WRFV3 ensemble forecasts. By selecting a group of ensemble members with good forecasting performance and the other one with bad performance, composite analyses are carried out by comparing the averaged fields of each group with respect to synoptic-scale circulation, advection, and the synoptic conditions of temperature stratification and moisture.
Our results showed that for this CFSP fog case, the key characteristics of synoptic-scale circulation determining fog forecasting performance are predicted strengths of cold-front circulation (the high-level dominant ridge and ridge, and the associated surface high) in corresponding regions. Ensemble members with bad forecasting performance tended to show a weaker ridge behind a stronger trough, an associated higher pressure to the northwest over land and a weaker surface high to the east over the sea. This leads to an adverse change in steering flow to the focus regions, with inhibition of warm moist advection transported from the sea and enhanced cold dry advection transported from land. It produced adverse synoptic conditions for fog formation, with less stable stratification and inadequate moisture, and consequently led to the failed fog forecast seen in the region of interest.
This study attempted to better understand fog predictability from the perspective of synoptic-scale circulation. What gains from this study could enhance our understanding of how synoptic-scale circulation affects fog forecast by affecting meso-and small-scale physical processes. Additionally, the study highlights the importance of obtaining initial pressure information upstream over land and downstream over the sea for CFSP fog forecasting. This could give some tips for targeted observations of fog forecasting in the coastal regions of North China. However, this study reveals two issues that requires further work. First, this study was based on only one case. To make the conclusions obtained in this study more persuasive, additional studies with more CFSP cases are required; Second, to expand our understanding of fog predictability from the perspective of synoptic-scale circulations, it is critical to study the predictability of fog with other frequent synoptic patterns.
AcknowledgementsThis study is supported by the National Key R & D Program of China (Nos. 2017YFC1404100 and 2017YFC14 04104), the National Natural Science Foundation of China (Nos. 41705081 and 41575067), and the Global Change Research Program of China (No. 2015CB953904).
Barker, D., Huang, W., Guo, Y., Bourgeois, A. and Xiao, Q., 2004. A three-dimensional variational data assimilation system for MM5: Implementation and initial results. Monthly Weather Review, 132(4): 897-914. DOI:10.1175/1520-0493(2004)132<0897:ATVDAS>2.0.CO;2 (  0) 0) |
Dudhia, J., 1989. Numerical study of convection observed during the winter monsoon experiment using a mesoscale two-dimensional model. Journal of Atmospheric Sciences, 46: 3077-3107. DOI:10.1175/1520-0469(1989)046<3077:NSOCOD>2.0.CO;2 (  0) 0) |
Fu, G., Li, P., Crompton, J., Guo, J., Gao, S. and Zhang, S., 2010. An observational and modeling study of a sea fog event over the Yellow Sea on 1 August 2003. Meteorology & Atmospheric Physics, 107(3-4): 149-159. (  0) 0) |
Glickman, T., 2000. Glossary of Meteorology. 2nd edition. American Meteorology Society, Boston, 855.
(  0) 0) |
Hitt, K., 1994. Refining 1970's land-use data with 1990 population data to indicate new residential development. Water-Resources Investigations Report. US Geological Survey, 94-4250.
(  0) 0) |
Hong, S. and Lim, J., 2006. The WRF single-moment 6-class microphysics scheme (WSM6). Journal of the Korean Meteorological Society, 42: 129-151. (  0) 0) |
Hu, H., Sun, J. and Zhang, Q., 2017a. Assessing the impact of surface and wind profiler data on fog forecasting using WRF 3DVAR: An OSSE study on a dense fog event over North China. Journal Applied Meteorology and Climatology, 56(4): 1059-1081. DOI:10.1175/JAMC-D-16-0246.1 (  0) 0) |
Hu, H., Zhang, Q., Sun, J., Ruan, C., Huang, F. and Zhang, S., 2017b. Impact of high-frequency observations on fog forecasting: A case study of OSSE. Tellus, 69(1): 1396182. DOI:10.1080/16000870.2017.1396182 (  0) 0) |
Hu, H., Zhang, Q., Xie, B., Ying, Y., Zhang, J. and Wang, X., 2014. Predictability of an advection fog event over North China. Part Ⅰ: Sensitivity to initial condition differences. Monthly Weather Review, 142(5): 1803-1822. (  0) 0) |
Huang, B., Mao, D., Kang, Z., Cao, Y. and Xiang, C., 2011. Synoptic and climatic characteristics of Yellow Sea fog and causation analysis. Journal of Tropical Meteorology, 27(6): 920-929 (in Chinese with English abstract). (  0) 0) |
Kain, J., 2004. The Kain-Fritsch convective parameterization: An update. Journal Applied Meteorology, 43(1): 170-181. DOI:10.1175/1520-0450(2004)043<0170:TKCPAU>2.0.CO;2 (  0) 0) |
Liang, A., Zhang, Q., Shen, H., Liu, K., Li, X. and Feng, J., 2009. The analysis and simulation of an advection fog event in Beijing. Journal of Applied Meteorological Science, 20: 612-621 (in Chinese with English abstract). (  0) 0) |
Lu, X., Gao, S., Rao, L. and Wang, Y., 2014. Sensitivity study of WRF parameterization schemes for the spring sea fog in the Yellow Sea. Journal of Applied Meteorological Science, 25(3): 312-320 (in Chinese with English abstract). (  0) 0) |
Mlawer, E., Taubman, S., Brown, P., Iacono, M. and Clough, S., 1997. Radiative transfer for inhomogeneous atmospheres: RRTM, a validated correlated-k model for the longwave. Journal of Geophysical Research Atmospheres (1984Ƀ2012), 102(D14): 16663-16682. DOI:10.1029/97JD00237 (  0) 0) |
Muller, M., 2006. Numerical simulation of fog and radiation in complex terrain. PhD thesis. University of Basel, 90pp.
(  0) 0) |
Niu, S., Lu, C., Yu, H., Zhao, L. and Lu, J., 2010. Fog research in China: An overview. Advances in Atmospheric Sciences, 27(3): 639-662. DOI:10.1007/s00376-009-8174-8 (  0) 0) |
Skamarock, W., Klemp, J., Dudhia, J., Gill, D., Barker, D., Duda, M., Huang, X., Wang, W., and Powers, J., 2008. A Description of the Advanced Research WRF Version 3. NCAR Technical Note NCAR/TN-475+STR, 113pp.
(  0) 0) |
Sukoriansky, S., Galperin, B. and Perov, V., 2005. Application of a new spectral theory of stably stratified turbulence to the atmospheric boundary layer over sea ice. Boundary-Layer Meteorology, 117(2): 231-257. DOI:10.1007/s10546-004-6848-4 (  0) 0) |
Wang, B., 1985. Sea Fog. China Ocean Press, Beijing, 330 (in Chinese).
(  0) 0) |
Wang, Y., Gao, S., Fu, G., Sun, J. and Zhang, S., 2012. Assimilating MTSAT-derived humidity in nowcasting sea fog over the Yellow Sea. Weather and Forecasting, 29(2): 205-225. (  0) 0) |
Zhang, C., Miao, S., Li, Q. and Chen, F., 2007. Impacts of fine-resolution land use information of Beijing on a summer severe rainfall simulation. Chinese Journal of Geophysics, 50(5): 1172-1182 (in Chinese with English abstract). DOI:10.1002/cjg2.1136 (  0) 0) |
Zhou, B., 2011. Introduction to a new fog diagnostic scheme. NCEP Office Note 466, 43pp (Available online: www.emc. ncep.noaa.gov/officenotes/newernotes/on466.pdf).
(  0) 0) |
Zhou, B. and Du, J., 2010. Fog prediction from a multimodel mesoscale ensemble prediction system. Weather and Forecasting, 25(1): 303-322. (  0) 0) |
Zhou, B. and Ferrier, B. S., 2008. Asymptotic analysis of equilibrium in radiation fog. Journal of Applied Meteorology and Climatology, 47(6): 1704-1722. DOI:10.1175/2007JAMC1685.1 (  0) 0) |
 2019, Vol. 18


