2) Polar Research Institute of China, Shanghai 200136, China
Internal solitary waves (ISWs) are frequently observed in the ocean (Alford et al., 2015). Stratified tidal flow over large-amplitude topography, such as sills, continental shelf-slope regions (Vlasenko et al., 2014), and submarine ridges (Buijsman et al., 2010; Xu et al., 2014), were thought to be the main generation mechanism of ISWs. ISWs could propagate with considerable energy and momentum over a long distance until they reach shallow water (Magalhaes et al., 2016). The interaction of ISWs with typical topography features always leads to breaking with energy dissipation and momentum exchange. After about 40 years of research, the life cycle of nonlinear internal waves remains an active subject, but the mechanisms and detailed structure of breaking and dissipation are still unclear (Sutherland et al., 2015; Liapidevskii and Gavrilov, 2018).
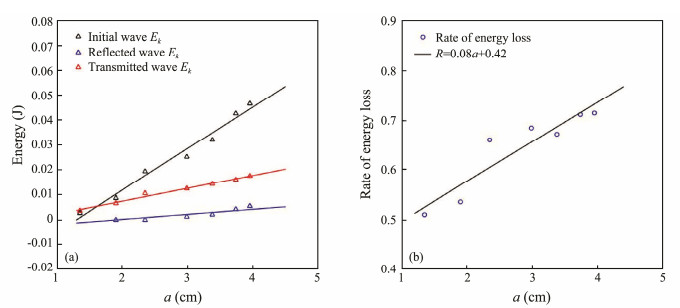
The largest ISW that has ever been captured occurred in the South China Sea (SCS), with an amplitude of over 100 m and wave-induced current velocities of 2 m s-1 (Zhao et al., 2014; Huang et al., 2016, 2017). Such waves were generated by the tide–ridge interaction around the Luzon Strait and propagated toward the northeast of the SCS. After the ISW reached the region near Dongsha Atoll, the breaking and reflecting processes occurred (Bai et al., 2017). Such processes were difficult to fully capture by the in situ or the remote sensing method. As reported in this work, the energy reflected in one single wave could reach only about 2% of the total incident energy, even with a total reflection of about 20%, which explained the scarcity of reflected wave processes in the remote sensing images.
Therefore, the dynamic mechanism of wave breaking and wave-induced mixing are subject to further investigation. The dissipation of turbulence from ISW breaking at steep underwater usually ranged from 10to 6 m2 s-3 to 10-9 m2 s-3 in the ocean and was mainly caused by unstable overturns in density (Nachtigall and Schwartz, 2003). According to their study, ISW propagation along the continental shelf creates waves, including strong turbulence and enhanced sediment resuspension. Turbulence diffusion takes up an important part of ISW energy loss (Klymak and Moum, 2003). Intrinsic instabilities that resulted from the transformation of ISWs over a topography made predicting the occurrence and dynamics through theoretical and applied models difficult.
Experimental studies have been conducted, showing the mixing process and quantifying the energy loss during breaking. The process of ISW shoaling along the slopes was measured by estimating wave energy that was transmitted over and reflected from a ridge (Michallet and Ivey, 1999). Chen (2007) conducted experiments on ISWs across different obstacles in terms of energy loss and found that the maximum mixing efficiency could reach 25% as the characteristic length ratio reached around 0.5. Thus, for the wave breaking events, amplitudes and topographic effects were important for energy transmission and reflection. ISWs that encounter a bottom ridge were determined by the previously mentioned condition, and investigations on the relative transmission and reflection performed measurements according to empirical fits to acquire analytic curves (Davies and Chun, 2002; Sutherland et al., 2015). Another laboratory experiment described large-amplitude internal wave evolution for different types of flows in shallow waters (Liapidevskii and Gavrilov, 2018).
In the examples cited above, a major impediment is that the mixing process with turbulence would not be calculated directly. Some breaking mechanisms of ISWs remain obscure due to lack of observations or experiment conditions. Nevertheless, recent technological developments enable accurate calculations of ISWs to understand these patterns, and we created an environment that was as similar to the ocean as possible. Energy loss and turbulence dissipation as ISWs broke over a ridge were calculated to provide the description of wave breaking from the point of turbulence.
This paper is organized as follows: We introduce the experimental setup in Section 2. We present the data analysisof the observed ISWs in Section 3. We discuss theexperimental results in Section 4. Finally, we provide a summary in Section 5.
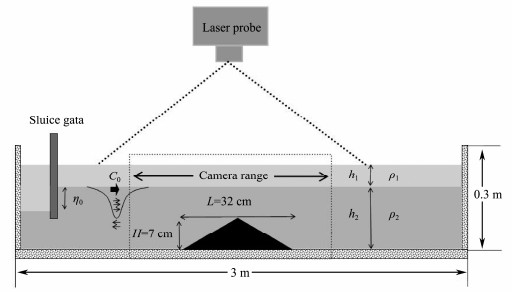
2 Experimental SetupA schematic of the experimental setup is presented in Fig.1. The experiments were undertaken in a two- dimensional flume, which had dimensions of 3 m × 0.15 m × 0.3 m. The upper-layer saltwater had a density of 1.035 g cm-3 to a depth of 4 cm, and the lower-layer saltwater had a density of 1.065 g cm-3 to a depth of 12 cm. The experimental ridge, which was 32 cm long and 7 cm tall, was placed in the middle of the flume (Fig.1). The velocity vectors were obtained using particle image velocimetry (PIV), and the laser beam wavelength was 532 nm with 3 W power and 3 mm thickness. A CCD was used, with a resolution of 1920 × 1080 pixels and a frequency of 50 frames. The query window, which was 32 × 32 pixels, was conducted using image processing software PIVlab, with a 50% overlap. Spatial average speeds were calculated in the upper and lower layers separately to obtain the turbulence dissipation rate by fluctuating velocity.
|
Fig. 1 Experimental setup for the fluid system and an obstacle. |
The ISWs were generated by gravitational collapse. Seven trial ISWs ranging from 2 cm to 8 cm (Table 1) were present.
|
|
Table 1 Examples of laboratory work on internal waves |
Laboratory investigations usually studied the process of ISW breaking with dyed water (Forgia et al., 2017), in which the interface displacement from visualization was calculated for energy loss. The space field of kinetic energy and the turbulence dissipation rate were quantified further in this experiment. The PIV method could provide flow field data to obtain the potential energy, kinetic energy, and turbulence dissipation rate for parameterization in the model.
During the encounter between ISWs and the barrier, potential energy was defined by a time series (Chen et al., 2007; Zhu et al., 2017)
| $ {E_p} = \sum {\frac{1}{2}\Delta \rho g{\eta ^2}\Delta x}, $ | (1) |
where Ep is the potential energy of the ISW, Δρ is the density difference between the two layers, η is the internal solitary wave vertical displacement, and Δx is the horizontal width of a grid with a size of 0.58 cm × 0.58 cm. By using PIV to obtain the wave flow field, we can calculate the kinetic energy Ek (Klymak and Moum, 2003)
| $ {E_k} = \sum {\sum {\frac{1}{2}\rho {v^2}\Delta x\Delta z} }, $ | (2) |
where ρ is the density of saltwater, ν is the flow velocity, and Δx and Δz are the grid with a size of 0.58 cm × 0.58 cm. The energy of the ISW is the sum of the potential energy and kinetic energy. We calculated the energy of the ISW position at the left and right of the ridge to obtain the change in energy loss (Fig.2). Energy loss rate Ed(Chen, 2007) is given by
| ${E_d} = ({E_i} - {E_r} - {E_t})/{E_i}, $ | (3) |
|
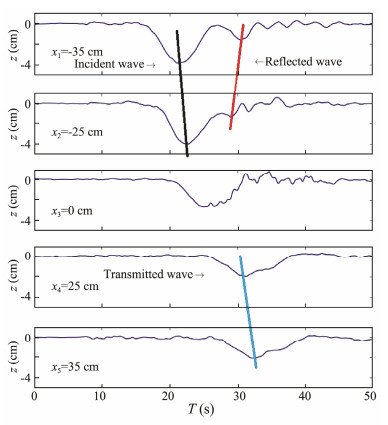
Fig. 2 Wave profiles at different positions from exp06, where x = -35, -25, 0, 25, and 35 cm. |
where Eiis the energy of the ISW, Et is the energy of the ISW after the ridge, and Er is the reflection energy of the ISW, which can be recognized in the timeseries and contains the potential and kinetic energy at that moment.
To explore the overall mixing process, we used the turbulent dissipation rate to examine the evolution of solitary waves over the ridge (Doron et al., 2001)
| $ \varepsilon = 4\upsilon \left[ {\overline {{{\left({\frac{{\partial u}}{{\partial x}}} \right)}^2}} + \overline {{{\left({\frac{{\partial \omega }}{{\partial z}}} \right)}^2}} + \overline {\left({\frac{{\partial u}}{{\partial x}}} \right)\left({\frac{{\partial \omega }}{{\partial z}}} \right)} + \frac{3}{4}\overline {{{\left({\frac{{\partial u}}{{\partial x}} + \frac{{\partial \omega }}{{\partial z}}} \right)}^2}} } \right], $ | (4) |
where ε is the turbulent dissipation rate; u and ω represent the horizontal and vertical fluctuation velocity, respectively; x and z are the horizontal and vertical coordinates, respectively; and υ is the kinematic viscosity coefficient. Turbulence intensity ε/υN2 (Hult et al., 2011) was introduced to evaluate changes in the turbulent dissipation rate, and N represents the buoyancy frequency,
| $ N = {(g'/{l_p})^{1/2}}, $ |
where
| $ g' = 2g({\rho _2} - {\rho _1})/({\rho _2} + {\rho _1}), $ |
lp is the breaking size. Mixing occurred mainly in the experiments where ISWs had large amplitudes; thus, the values of N ranged between 1–2.33 rad s-1. Clear vertical matter and energy transmission was observed in the interaction between internal solitary waves and the ridge. To calculate the buoyancy diffusion rate kp, the following equation was used (Shih et al., 2005):
| $ {k_p} = 0.2\upsilon \left({\frac{\varepsilon }{{\upsilon {N^2}}}} \right), {\rm{ }}7 < \frac{\varepsilon }{{\upsilon {N^2}}} < 100, $ | (5) |
| $ {k_p} = 2\upsilon {\left({\frac{\varepsilon }{{\upsilon {N^2}}}} \right)^{1/2}}, {\rm{ }}\frac{\varepsilon }{{\upsilon {N^2}}} > 100. $ | (6) |
Few laboratory experiments focused on the dissipation of ISWs incident over a triangular barrier. They calculated the energy and structure of the interaction associated with the incident waves and topographic parameters (Sveen et al., 2002). Our experiments will show a good estimation for energy and turbulence of the transmission and reflection, the intensity of which can be relative to the amplitude empirically.
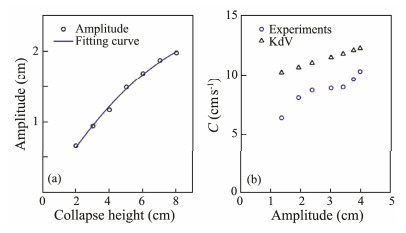
4 Experimental Results 4.1 ISW EvolutionISW amplitudes increased with increased collapse height and reached a maximum, which was consistent with the theoretical upper bounds (Grue et al., 1997). The measured ISW amplitudes in the experiments also had the same trend, and the increase rate appeared smaller over amplitudes (Fig.3a). A velocity comparison was conducted between experiments with the weakly nonlinear Korteweg- de Vries (KdV) theory from Fig.3b, in which the speed of the leading disturbance of the interface in experiments was lower than that of the theoretical depression (Grue et al., 2000a). Good agreement was believed to exist between the experimental and theoretical results when the amplitude approached the thickness of the upper layer (Grue et al., 2000b).
|
Fig. 3 ISW amplitude plotted against collapse (a) and (b) the velocity of ISWs in experiments (circle) and theory (KdV). |
The next experimental results indicated the process of the triangular barrier on ISW propagation. The sequences of interface displacement η profiles were computed from the initial images to investigate the changing structure of the ISWs. From Fig.2a, overturning with mixing could be observed as the wave passed by. In detail, when the ISW approached the ridge, the interface became unstable compared with the incident wave due to the Kelvin- Helmholtz (KH) instability, as most experiments and numerical models described (Maderich et al., 2010; Sutherland et al., 2013). The waveform was squeezed and narrowed upon the facing side of the barrier and the upper layer plunged to a depth such that the lower layer became shallower. As the wave ran upslope, the depression gradually sank and became unstable. After a few moments, a trail appeared and spread to the top left. At the same time, the reflection flow separated from the incident wave interacting with the barrier. Next, the reflection wave caught up to the leading wave and overturned (Sutherland et al., 2015). At the same time, overturning would make pycnocline collapse and the vertical and turbulent region spread out quickly, in which the shearing motion and internal dissipation increased. After the ISW interacted with an obstacle, the wave regained its stability with amplitude reduction and increasing wavelength.
The time series was quantified from Fig.2 to confirm the position of the waves and measure the reflected and transmitted waves. The ISW amplitude increased by about 10% from position X2 to X1 on the slope, which could also be found in Fig.2. As the wave approached the barrier, the waveform became significantly distorted. During this process, the ISWs influenced by the barrier created a fog-like area and the waveform became flexible. Compared with the original wave, the change of waveform could be mainly expressed in a smaller wavelength and larger amplitude. From the time series, the reflected and transmitted waves would be separated accurately. A wave was present behind the initial wave in Fig.2, which was found at t = 30 s. The direction of wave propagation was apposite with the initial wave and could be a reflected wave. These factors provided the initial conditions for analyzing ISW energy loss.
The energy-based calculation was performed, containing the reflection and the transmission waves. Small- amplitude ISWs had minimum wave reflection, meaning that nearly all the energy was transmitted through the barrier without damping. For larger-amplitude ISWs, the reflection wave was evidently related to the incident waves. In detail, the kinetic energy and potential energy would be defined separately. A large incident amplitude corresponded to great energy reflection (Chen, 2009).
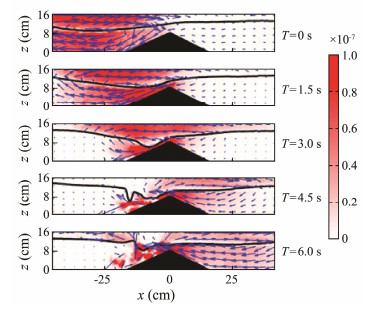
The spatial distribution of kinetic energy at different phase due to wave breaking is shown visually in Fig.4. At that moment of impinging, kinetic energy focused on several overturning patches, and then as the flow separated from the ridge boundary with the development of vortex, the separation vortices were generated on the ridge. Wave instability induced by flow acceleration around the obstacle reproduced the general pattern of the ISWs (Li et al., 2013). The details of initial instability transitions are presented in Section 4.2.
|
Fig. 4 Total distribution of velocity and kinetic energy at different moments (ΔT = 1.5 s) for a portion of a turbulent event in exp05. |
Generally, the overturning and shear along the slope dominated the turbulent energy. ISWs passing over the ridge would inevitably result in energy loss. Thus, to objectively portray the energy loss, the energy dissipation rate was used to measure its level. The energy loss rate (see Eq. (3)) was closely related to the incident wave amplitude. In these experiments, ISW energy loss was illustrated based on the kinetic energy (Fig.5a). For exp01, the kinetic energy of transmission was larger than the incident wave because the velocity increased significantly as a result of the decreased local water depth. As the amplitude of the incoming wave increased, the increase rate of the initial wave was sharper than that of the others, although all of the waves changed from weak to violent. Potential energy was calculated by integrating wave profiles. The potential energy of the reflected and transmitted wave was less than the kinetic energy by one order of magnitude. The potential energy increased as the wave amplitude increased and the growth degree was weak. In particular, about 5% to 10% of the incident wave energy was reflected with large-amplitude ISWs, which was calculated by only the largest reflected wave due to the effect of trailing oscillations, with 50% to 10% of the incident wave energy being transmitted when the amplitude increased. The energy loss distribution relation shown in Fig.5b grew linearly. One important reason for this condition was that constant strengthened wave oscillations following the leading wave due to wave breaking occurred with rising wave amplitudes. The oscillations development of the wave tail were mainly decided by the vortex and viscous effect. In the following section, we further investigate these important factors in energy dissipation.
|
Fig. 5 Kinetic energy of initial, reflected, and transmission wave (a) and the rate of energy dissipation against ISW amplitudes (b). |
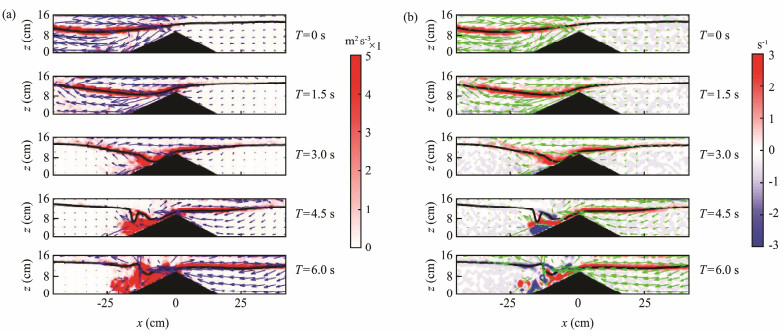
In this section, we used a direct method to estimate turbulent kinetic energy dissipation rate with assumptions of isotropy. Fig.6a illustrates the transition of turbulent dissipation rate caused by ISWs breaking at five phases in exp05. Initially, the high turbulent dissipation rate was mainly concentrated at the interface, which was consistent with the shear structure induced by mode 1 ISW. Interface shear was the leading factor in Phase 1 (Fig.6) As the wave shoaled on the ridge, the velocity in the lower layer increased as the lower layer decreased (Zhi et al., 2018). The gradients of the velocity were significantly larger near the ridge than in other regions. At time t = 3.0 s, wave steeping would expand along the side slope of the ridge, and then the flow separation occurred inevitably, where KH instability appeared due to high shear. KH billow development induced a convective instability when the wave steepness was larger than a critical number in the regime (Fructus et al., 2009). Smaller vortices and turbulence generated in the flow separation could be found in the lower layer. The resuspension beneath the interface occurred in the interaction of the incident wave with the ridge, as described by previous observations (Bai et al., 2017).
|
Fig. 6 (a) ISW turbulent dissipation rate and (b) vorticity at four wave phases in exp05. |
The vorticity field in Fig.6b was associated with clockwise churning and overturning, where the separation induced several larger vortices. These vortices were generated below the interface, broke down into small-scale motion, and eventually dissipated near the top of the ridge. The positive and negative vorticity led to the expansion of gravitational instability as the wave shoaled.
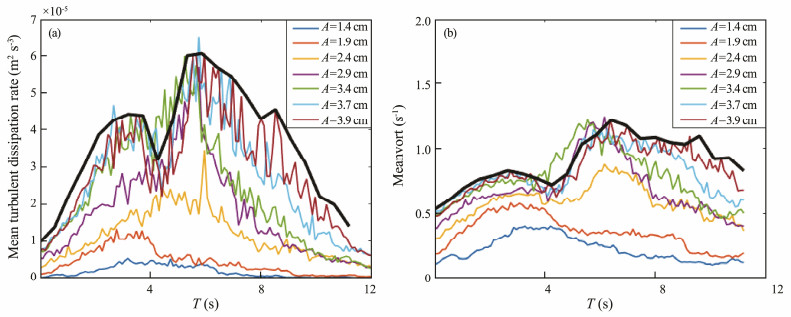
To quantify the degree of interaction, the mean turbulent dissipation rate and vorticities taken on the ridge were measured. Fig.7(a) shows the relation between mean turbulent dissipation rate with amplitudes of the incoming wave, in which turbulent dissipation increased as the wave reached the shallow region. The waves passed over the topography with steepening and distortion; during this phase, the turbulent dissipation rate increased sharply to a maximum with acceleration for 2 s < T < 3 s, where the velocity increased significantly as a result of the decreased local water depth. After 2 s, a larger turbulent dissipation rate was quantified, which was induced by the interaction between the incident and reflected waves. This condition indicates that the first maximum turbulent dissipation rate appeared when the acceleration of the speed induced the high shear along the ridge, and the second was caused by the superposition between the initial and reflected waves. In this phase, the energy in the whole region was transferred from the waves to the turbulence. At the same time, mixing and overturning with shed vortices took place within the lower layer. The change of measured local velocities was similar to that of the turbulent dissipation rate in Fig.7(b). The range of vorticities expanded gradually as the ISWs passed over the ridge and then the structure of the vortex was destroyed in situ by turbulence. The vortex was separated from large into small vortices that eventually disappeared due to friction. The whole process was revealed in the experiments.
|
Fig. 7 Mean turbulent dissipation rate (a) and vortices (b) with different amplitudes and envelope (black solid). The black line was the envelope for exp07. |
From the turbulent dissipation rate and vortex of change over time, the magnitude was about 10-6 m2 s-3 to 10-4 m2 s-3, and these two extremes appeared only during experiments with strong mixing. As the wave with a large amplitude passed the ridge, the acceleration of the velocity was mainly around the top of the ridge and the change of velocity was moderate. A maximum of the turbulent dissipation rate appeared in this process. As the interface on the left of the ridge became steep, the tail of the wave would collapsed where the second maximum appeared near the bottom of the ridge in which the source of turbulence was changed from the interficial shear to the wave steeping. Such a process was not observed in the exp01 and exp02. In the second breaking events, the instabilities grew rapidly enough to result in overturning and breaking with smaller wavelengths. The intensity of mixing and over- turning was seriously affected by the wave amplitudes.
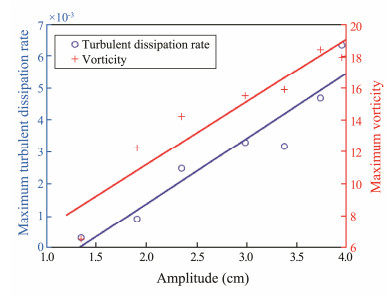
To accurately calculate the relationship between the turbulent dissipation rate and the amplitudes, the maximum turbulent dissipation rate and vortices with wave amplitudes were compared. The maximum value of these factors and the wave amplitude had a linear relationship with increasing amplitudes. During these processes, the energy loss also increased, showing that the turbulence intensity and ISW energy increased simultaneously. In the process of wave breaking, the curve showed that the breaking was decided by the parameters of the incoming wave. As the incident energy increased, the turbulence strengthened as the energy dissipation also increased (Fig.8).
|
Fig. 8 Maximum turbulent dissipation rate and vortices plotted against ISW amplitudes. |
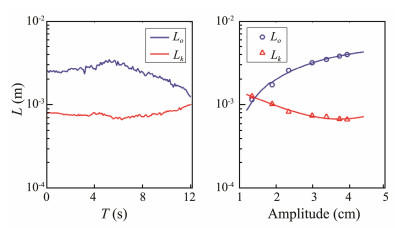
Length scales could be used to compare the relative magnitudes scales of the turbulence in the breaking events. With the use of the direct method to calculate the turbulent dissipation rate and magnitude, turbulence scales were used for standardization. Two scales are often used: Kolmogorov scales
|
Fig. 9 Evolution of turbulent length scales at different times in exp05 (a). Ozmidov dimension (blue) and Kolmogorov scale (red). Scales trend against ISW amplitudes (b). |
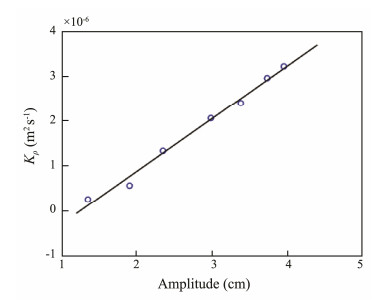
Breaking ISWs with energy dissipation enhanced the vertical transport capacity of energy and materials, and strong mixing was observed. To quantify the process, buoyancy diffusion coefficients were calculated to represent the vertical transport capability of breaking ISWs. Buoyancy diffusion coefficients calculation followed Eq. (5). Fig.10 shows the linear relationship between the buoyancy diffusion coefficients and the amplitude. An assessment of Fig.10 shows that small-amplitude ISWs approached the ridge without breaking and were stable, except at the interface where mixing and vertical transport occurred. When the ISW amplitude increased, strong interaction with the ridge occurred. As a result, a large number of different scale eddies began to be generated, making turbulent fluctuation velocities more obvious, and strong vertical mixing was caused by the shear instability and the nonlinear interaction of the incident wave and the reflected wave. Fig.10 shows that the interaction between a large-amplitude solitary wave and the ridge led to a rapid increase in buoyancy diffusion coefficients, and the buoyancy diffusion coefficients at this moment were more than 10 times greater than when this condition did not occur. The occurrence of breaking at the ridge may be related to the parameters of the incident wave and the ridge. This finding implies that the mixing parameters would increase as the energy of the ISWs increases.
|
Fig. 10 Buoyancy diffusion coefficients plotted against ISW amplitude. |
In this study, experiments were performed to simulate ISW propagation over a ridge. Experiments were performed with different-amplitude ISWs, and the following conclusions were derived:
1) The energy loss of ISWs over the ridge mainly depended on the degree of wave break. Experiments found that a series of small eddies remained when the ISWs passed the obstacle. These eddies could remain at the interface for a period of time, suggesting that one reason for wave breaking was KH instability.
2) The superposition of an incident wave and the reflection wave destroyed the stability of stratification due to nonlinear interactions with the strengthened shear, in which the value for reflected waves was up to 10%, which was less than 20% of the incident wave observed in satellite images, because the calculation in the experiments involved only one reflected wave, ignoring other reflected waves. ISW interaction with the topography produced an unusual pattern compared the incident waves (Li et al., 2013). In these cases, two maximum turbulent dissipation rate and vortices occurred; the smaller one was induced by the acceleration of speed, and the other was caused by the interaction between the incident and reflected waves.
3) Different ISW amplitudes, the maximum turbulent dissipation rate, and buoyancy diffusion coefficients exhibited a linear relationship. During the process of ISW breaking, the energy transfer and mass exchange were closely related to the parameters of the incident wave. The local mixing efficiency within the overturning patch at the interface was investigated by comparing the magnitudes of turbulent length scales, providing some reference to measure the mixing processes. Nevertheless, future experiments should involve the effects of different topography on the mixing and turbulent process.
AcknowledgementsThe work was sponsored by the National Key Research and Development Program of China (No. 2017YFA060 4103), the National Natural Science Foundation of China (Nos. 41476001 and 41276008), and the Fund of Oceanic Telemetry Engineering and Technology Research Center, State Oceanic Administration (No. 2017005).
Alford, M. H., Peacock, T., MacKinnon, J. A., Nash, J. D., Buijsman, M. C., Centurioni, L. R., Chao, S.-Y., Chang, M.-H., Farmer, D. M., Fringer, O. B., Fu, K.-H., Gallacher, P. C., Graber, H. C., Helfrich, K. R., Jachec, S. M., Jackson, C. R., Klymak, J. M., Dong, S. K., Jan, S., Johnston, T. M. S., Legg, S., Lee, I.-H., Lien, R.-C., Mercier, M. J., Moum, J. N., Musgrave, R., Park, J.-H., Pickering, A. I., Pinkel, R., Rainville, L., Ramp, S. R., Rudnick, D. L., Sarkar, S., Scotti, A., Simmons, H. L., St Laurent, L. C., Venayagamoorthy, S. K., Wang, Y.-H., Wang, J., Yang, Y. J., Paluszkiewicz, T. and Tang, T.-Y., 2015. The formation and fate of internal waves in the South China Sea. Nature, 521(7550): 65-69. DOI:10.1038/nature14399 (  0) 0) |
Bai, X., Li, X., Lamb, K. G. and Hu, J., 2017. Internal solitary wave reflection near Dongsha atoll, the South China Sea. Journal of Geophysical Research: Oceans, 122(10): 7765-8325. DOI:10.1002/jgrc.21933 (  0) 0) |
Boegman, L. and Ivey, G. N., 2009. Flow separation and resuspension beneath shoaling nonlinear internal waves. Journal of Geophysical Research: Oceans, 114(C2): 309-321. (  0) 0) |
Buijsman, M. C., Kanarska, Y. and Mcwilliams, J. C., 2010. On the generation and evolution of nonlinear internal waves in the South China Sea. Journal of Geophysical Research: Oceans, 115: C02012. (  0) 0) |
Chen, C. Y., 2007. An experimental study of stratified mixing caused by internal solitary waves in a two-layered fluid system over variable seabed topography. Ocean Engineering, 34(14): 1995-2008. (  0) 0) |
Chen, C. Y., 2009. Amplitude decay and energy dissipation due to the interaction of internal solitary waves with a triangular obstacle in a two-layer fluid system: The blockage parameter. Journal of Marine Science & Technology, 14(4): 499-512. (  0) 0) |
Chen, C. Y., Hsu, J., Chen, H. H., Kuo, C. F. and Cheng, M. H., 2007. Laboratory observations on internal solitary wave evolution on steep and inverse uniform slopes. Ocean Engineering, 34(1): 157-170. DOI:10.1016/j.oceaneng.2005.11.019 (  0) 0) |
Davies, G. and Chun, R., 2002. Gaps between the internal and external perceptions of the corporate brand. Corporate Reputation Review, 5(2-3): 144-158. DOI:10.1057/palgrave.crr.1540171 (  0) 0) |
Dong, J., Zhao, W., Chen, H., Meng, Z., Shi, X. and Tian, J., 2015. Asymmetry of internal waves and its effects on the ecological environment observed in the northern South China Sea. Deep-Sea Research Part I, 98: 94-101. DOI:10.1016/j.dsr.2015.01.003 (  0) 0) |
Doron, P., Bertuccioli, L., Katz, J. and Osborn, T. R., 2001. Turbulence characteristics and dissipation estimates in the coastal ocean bottom boundary layer from PIV data. Journal of Physical Oceanography, 31(8): 2108-2134. DOI:10.1175/1520-0485(2001)031<2108:TCADEI>2.0.CO;2 (  0) 0) |
Forgia, G. L., Adduce, C. and Falcini, F., 2017. Laboratory investigation on internal solitary waves interacting with a uniform slope. Advances in Water Resources, 120: 4-18. (  0) 0) |
Fructus, D., Carr, M., Grue, J., Jensen, A. and Davies, P. A., 2009. Shear-induced breaking of large internal solitary waves. Journal of Fluid Mechanics, 620: 1-29. DOI:10.1017/S0022112008004898 (  0) 0) |
Gargett, A. E. and Holloway, G., 1984. Dissipation and diffusion by internal wave breaking. Journal of Marine Research, 42(1): 15-27. (  0) 0) |
Grue, J., Friis, H. A., Palm, E. and RusaS, P. O., 1997. A method for computing unsteady fully nonlinear interfacial waves. Journal of Fluid Mechanics, 351: 223-252. DOI:10.1017/S0022112097007428 (  0) 0) |
Grue, J., Jensen, A., Rusås, P. O. and Sveen, J. K., 2000a. Breaking and broadening of internal solitary waves. Journal of Fluid Mechanics, 413: 181-217. DOI:10.1017/S0022112000008648 (  0) 0) |
Grue, J., Jensen, A., Rusås, P. and Sveen, J. K., 2000b. Properties of large amplitude internal waves. Journal of Fluid Mechanics, 380: 257-278. (  0) 0) |
Huang, X., Chen, Z., Zhao, W., Zhang, Z., Zhou, C., Yang, Q. and Tian, J., 2016. An extreme internal solitary wave event observed in the northern South China Sea. Scientific Reports, 6: 30041. DOI:10.1038/srep30041 (  0) 0) |
Huang, X., Zhang, Z., Zhang, X., Qian, H., Zhao, W. and Tian, J., 2017. Impacts of a mesoscale eddy pair on internal solitary waves in the northern South China Sea revealed by mooring array observations. Journal of Physical Oceanography, 47(7): 1539-1554. DOI:10.1175/JPO-D-16-0111.1 (  0) 0) |
Hult, E. L., Troy, C. D. and Koseff, J. R., 2011. The mixing efficiency of interfacial waves breaking at a ridge: 2. Local mixing processes. Journal of Geophysical Research: Oceans, 116(C2): 434-441. (  0) 0) |
Klymak, J. M. and Moum, J. N., 2003. Internal solitary waves of elevation advancing on a shoaling shelf. Geophysical Research Letters, 30(20): 315-331. (  0) 0) |
Li, X., Jackson, C. R. and Pichel, W. G., 2013. Internal solitary wave refraction at Dongsha atoll, South China Sea. Geophysical Research Letters, 40(12): 3128-3132. DOI:10.1002/grl.50614 (  0) 0) |
Liapidevskii, V., and Gavrilov, N., 2018. The Ocean in Motion: Circulation, Waves, Polar Oceanography. Springer International Publishing, Cham, 87-108.
(  0) 0) |
Maderich, V., Talipova, T., Grimshaw, R., Terletska, K., Brovchenko, I., Pelinovsky, E. and Choi, B. H., 2010. Interaction of a large amplitude interfacial solitary wave of depression with a bottom step. Physics of Fluids, 22(7): 431. (  0) 0) |
Magalhaes, J. M., Silva, J. C. B. D., Buijsman, M. C. and Garcia, C. A. E., 2016. Effect of the north equatorial counter current on the generation and propagation of internal solitary waves off the Amazon shelf (SAR observations). Ocean Science Discussions, 12(5): 243-255. (  0) 0) |
Maxworthy, T., 1979. A note on the internal solitary waves produced by tidal flow over a three-dimensional ridge. Journal of Geophysical Research: Oceans, 84(C1): 338-346. DOI:10.1029/JC084iC01p00338 (  0) 0) |
Michallet, H. and Ivey, G. N., 1999. Experiments on mixing due to internal solitary waves breaking on uniform slopes. Journal of Geophysical Research, 104(C6): 13467. DOI:10.1029/1999JC900037 (  0) 0) |
Nachtigall, M. J. and Schwartz, L. B., 2003. Structure and generation of turbulence at interfaces strained by internal solitary waves propagating shoreward over the continental shelf. Journal of Physical Oceanography, 33(1): 2093-2112. (  0) 0) |
Shih, L., Koseff, J., Ivey, G. and Ferziger, J., 2005. Parameterization of turbulent fluxes and scales using homogeneous sheared stably stratified turbulence simulations. Journal of Fluid Mechanics, 525: 193-214. DOI:10.1017/S0022112004002587 (  0) 0) |
Smith, W. A. M. N., Katz, J. and Osborn, T. R., 2007. The effect of waves on subgrid-scale stresses, dissipation and model coefficients in the coastal ocean bottom boundary layer. Journal of Fluid Mechanics, 583: 133-160. DOI:10.1017/S0022112007006118 (  0) 0) |
Sutherland, B. R., Barrett, K. J. and Ivey, G. N., 2013. Shoaling internal solitary waves. Journal of Geophysical Research: Oceans, 118(9): 4111-4124. DOI:10.1002/jgrc.20291 (  0) 0) |
Sutherland, B. R., Keating, S. and Shrivastava, I., 2015. Transmission and reflection of internal solitary waves incident upon a triangular barrier. Journal of Fluid Mechanics, 775: 304-327. DOI:10.1017/jfm.2015.306 (  0) 0) |
Sveen, J. K., Guo, Y., Davies, P. A. and Grue, J., 2002. On the breaking of internal solitary waves at a ridge. Journal of Fluid Mechanics, 469: 161-188. DOI:10.1017/S0022112002001556 (  0) 0) |
Vlasenko, V. and Hutter, K., 2002. Numerical experiments on the breaking of solitary internal wavesover a slope shelf topography. Journal of Physical Oceanography, 32(6): 1779-1793. DOI:10.1175/1520-0485(2002)032<1779:NEOTBO>2.0.CO;2 (  0) 0) |
Vlasenko, V., Stashchuk, N., Inall, M. E. and Hopkins, J. E., 2014. Tidal energy conversion in a global hot spot: On the 3‐d dynamics of baroclinic tides at the Celtic Sea shelf break. Journal of Geophysical Research: Oceans, 119(6): 3249-3265. DOI:10.1002/2013JC009708 (  0) 0) |
Xu, Z., Yin, B., Hou, Y. and Liu, A. K., 2014. Seasonal variability and north–south asymmetry of internal tides in the deep basin west of the Luzon Strait. Journal of Marine Systems, 134: 101-112. DOI:10.1016/j.jmarsys.2014.03.002 (  0) 0) |
Zhao, Z., Liu, B. and Li, X., 2014. Internal solitary waves in the China seas observed using satellite remote-sensing techniques: A review and perspectives. International Journal of Remote Sensing, 35: 3926-3946. DOI:10.1080/01431161.2014.916442 (  0) 0) |
Zhi, C., Ke, C. and You, Y., 2018. Internal solitary wave transformation over the slope: Asymptotic theory and numerical simulation. Journal of Ocean Engineering & Science, 3(2): 83-90. (  0) 0) |
Zhu, H., Wang, L. L., Avital, E. J., Tang, H. W. and Williams, J. J. R., 2017. Numerical simulation of shoaling broad-crested internal solitary waves. Journal of Hydraulic Engineering, 143(6): 04017006. DOI:10.1061/(ASCE)HY.1943-7900.0001278 (  0) 0) |
 2019, Vol. 18


