2) Qingdao Meteorological Bureau, Qingdao 266003, China;
3) College of Oceanic and Atmospheric Sciences, Ocean University of China, Qingdao 266100, China
In coastal engineering, typhoons and wave overtopping on dikes are important issues (Dong et al., 2017; Ji and Dong, 2018). The parameters of typhoons and wave overtopping are key to coastal protection and dike research. Many studies have explored the overtopping volume distribution of single waves under a positive freeboard (Xiao et al., 2009; Victor et al., 2012; Nørgaard et al., 2014; Dahmani et al., 2017). For example, Wang et al. (2016) and Lin et al. (2019) recently analyzed the typhoon and wave characteristics near Qingdao.
The combination of extreme waves and storm surges can lead to the overtopping of coastal protection structures, such as dikes, seawalls, and breakwaters. This condition may cause flooding and damage the areas protected by these structures. Wave overtopping is safer under a positive freeboard than under a negative freeboard during storm surges. The flood-side slopes of levees have been found to be exposed to lower velocities and erosive forces than landward-side slopes during wave overtopping (Hughes and Nadal, 2009). The IPCC reports that climate change increases the rate of sea level rise and the duration and intensity of storms. Studies have focused on how the frequency and intensity of coastal hurricanes fluctuate with climate variations (Gray et al., 1993; Lehmiller et al., 1997; Elsner and Jagger, 2004; Shen et al., 2018; Bacmeister et al., 2018). Elsner (2006), Mann and Emanuel (2006), and Hoyos et al. (2006) suggested that hurricanes in the Atlantic present an increasing trend in frequency and intensity partly because of the rise in sea surface temperatures (SSTs) brought on by global warming. Pan et al. (2015) performed an all-sided laboratory study on the distribution of individual wave overtopping volumes over a dike under a negative freeboard. Williams et al. (2014) and Pillai et al. (2017) conducted several experiments to verify the empirical formula for predicting wave overtopping volumes. The study by Sierra et al. (2016) compared the wave overtopping volumes of port breakwaters under three storm conditions during sea level rise.
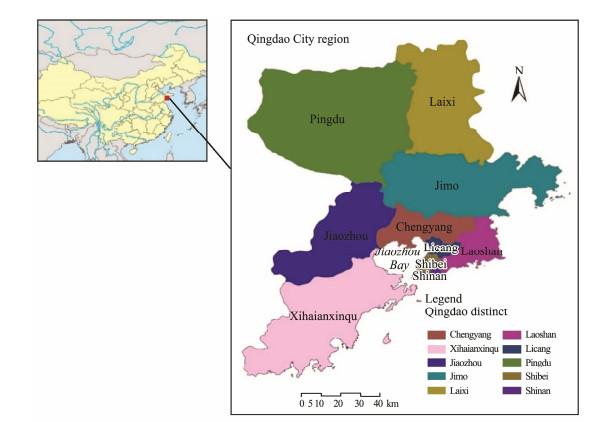
Qingdao is located in the southern part of Shandong Peninsula, particularly between 119˚30΄–121˚00΄E and 35˚35΄–37˚09΄N. It is bordered by the Yellow Sea in the east and south, Yantai City in the northeast, Weifang City in the west, and Rizhao City in the southeast. The city's total area is 11293 km2. The sub-provincial city of Qingdao has seven core districts, namely, Shinan, Shibei, Licang, Laoshan, Xihaianxinqu, Chengyang, and Jimo; and three county-level cities, namely, Jiaozhou, Pingdu, and Laixi (Fig.1). The city's coastline (including the coastline of the island) is twisted and has a total length of 905.2 km, with the mainland coastline measuring 782.3 km and accounting for one-fourth of the coastline of Shandong Province.
|
Fig. 1 Location map of Qingdao. |
Qingdao is located in the north temperate monsoon region and has a temperate monsoon climate. As a result of the direct adjustment of the marine environment, the urban area is affected by the southeast monsoon and by ocean currents and water masses on the ocean surface. Therefore, this area has significant maritime climate characteristics. The air is humid, the rainfall is abundant, the temperature is moderate, and the four seasons are distinct.
The present study aimed to determine the impact of climate change on typhoons and wave overtopping in Qingdao City. The rest of the paper is organized as follows. Section 2 presents the typhoon information analysis and prediction. Section 3 provides further details on typhoon waves. Section 4 describes the wave overtopping results and discussion. Section 5 provides a summary and conclusions.
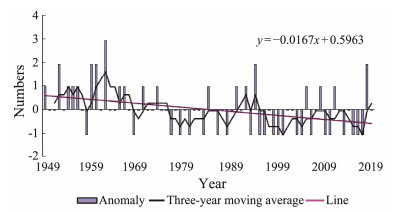
2 Characteristics of Typhoons Affecting Qingdao 2.1 Typhoon Track AnalysisThe climate characteristics of tropical cyclones affecting Qingdao are analyzed on the basis of the Tropical Cyclone Yearbook and local ground observational data from 1949 to 2019. The records show that 75 tropical cyclones hit Qingdao from 1949 to 2019. The annual mean number of tropical cyclones affecting Qingdao is 1.06. The anomalies in the numbers of tropical cyclones affecting Qingdao in each year are drawn in Fig.2. During the period of 1949–2019, the number of tropical cyclones that affected Qingdao showed a decreasing trend, with the annual decreasing rate being 0.0167.
|
Fig. 2 Anomalies in numbers of tropical cyclones affecting Qingdao. |
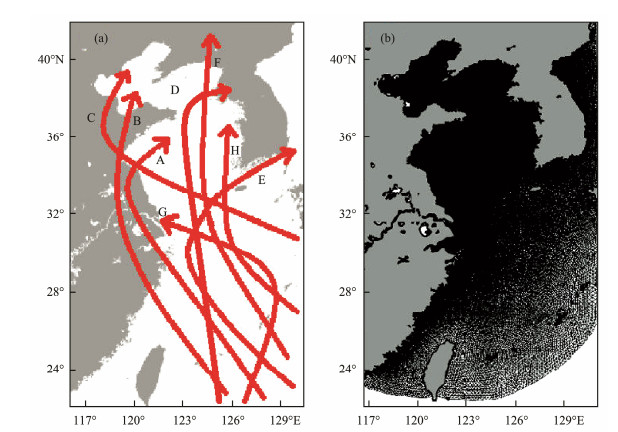
The historical tropical cyclone tracks are also analyzed in this study. The 75 tropical cyclones found to have affected Qingdao are categorized into eight groups according to the text description and path map classification of each typhoon path in the Tropical Cyclone Yearbook and the wind and rain brought by each typhoon that affected Qingdao. The eight categories are denoted as Tracks A to H (Fig.3a). According to the characteristics of each typhoon category, a name is assigned to each track. Track A is characterized as 'making landfall then changing directions'; Track B is 'making landfall then moving northward'; Track C is 'moving westward at high latitudes'; Track D is 'westward in the Yellow Sea'; Track E is 'changing directions at offshore areas'; Track F is 'moving northward at sea'; Track G is 'making landfall and then disappearing' and Track H is 'towards the ocean'. Among the 75 typhoons that affected Qingdao from 1949 to 2019, 18 typhoons were grouped as Track A, 16 as Track B, 9 as Track C, 8 as Track D, 7 as Track E, 5 as Track F, 5 as Track G, and 3 as Track H.
|
Fig. 3 (a) Tracks for the eight categories of typical typhoons and (b) the triple triangular mesh of the SWAN model. |
On the basis of HadISST1 data, Feng and Lin (2009) pointed out that from 1945 to 2006, the SST of the East China Sea increased by an average of 0.015℃ per year. The monthly and annual averages of the SST of South China offshore showed a rising trend, and the annual average SST showed a linear growth trend with 0.12–0.19 ℃ (10 yr)−1 in the last 44 years (Pan et al., 2007). Over the last 150 yr, the SST of most global oceans has linearly increased year by year at a significant speed of about 0.003℃ yr−1, with that of the central North Pacific (0.003 – 0.006℃ yr−1) showing the strongest linearly increasing trend (Sun et al., 2015). Over the past 100 years, the SST in the northwest Pacific Ocean has linearly increased year by year with a significant speed of 3.9×10⁻³℃ yr−1. The SST in most of northwestern Pacific has shown a significant linearly increasing trend year by year, and the increasing trend of the offshore is stronger than that of the ocean. The increasing trend of the offshore basically exceeds 3×10⁻³℃ yr−1. In particular, the increasing trends of the SSTs of the Fujian and Guangdong coast, the waters around Ryukyu islands in Taiwan, and the waters around Japan are the strongest at above 9×10⁻³℃ yr−1, and the high value center is more than 12×10−3℃ yr−1 (Su et al., 2014). From 1900 to 2006, the variation trend of the SST in China's offshore was 0.8℃. If the linear increments from the above historical data analysis are averaged, the linear growth rate of SST in the Northwest Pacific Ocean is predicted to be approximately 0.15℃ (10 yr)−1.
Typhoon intensity is expected to increase due to global warming and SST rise (IPCCAR4). The frequency of tropical cyclones globally will decrease by 6%–34% due to the increase of greenhouse gases, but the proportion of strong typhoons will increase (IWTC). The average intensity of tropical cyclones tends to increase, and by 2100, the global average intensity of tropical cyclones will increase by 2%–11% relative to the current level. Lei (2011) pointed out that the wind speed of tropical cyclones will increase by 3%–5% for every 1℃ of the SST.
According to this information, the increments of wind speed with SST rise in the East China Sea are obtained (Table 1). Then, on the basis of the historical wind speed statistics of each category of tropical cyclone track, the maximum wind speed values for the next three scenarios can be obtained (Table 2).
|
|
Table 1 Increments of wind speed for study periods |
|
|
Table 2 Prediction of maximum wind speed for each category of tropical cyclone track (unit: m s−1) |
The SWAN spectral wave model (Booij et al., 1999; Ris et al., 1999) is used to simulate the wind waves around Qingdao area in this study. The triangular mesh is adopted in this wind wave model (Fig.3b). The simulation domain is 22˚–42˚N and 116˚–130.5˚E. The resolution is 925 m in the Qingdao nearshore. The wave directions are divided into 36 sectors that are 10˚ apart. The frequency range in the model is set from 0.04 to 1 Hz. This model can represent waves in the period from 1 to 25 s, including typical coastal surface waves. The output time step is set to 1 h to speed up the calculation time and to save hard disk space. The wind input data are simulated by the Jelesnianski typhoon model (Jelesnianski, 1965).
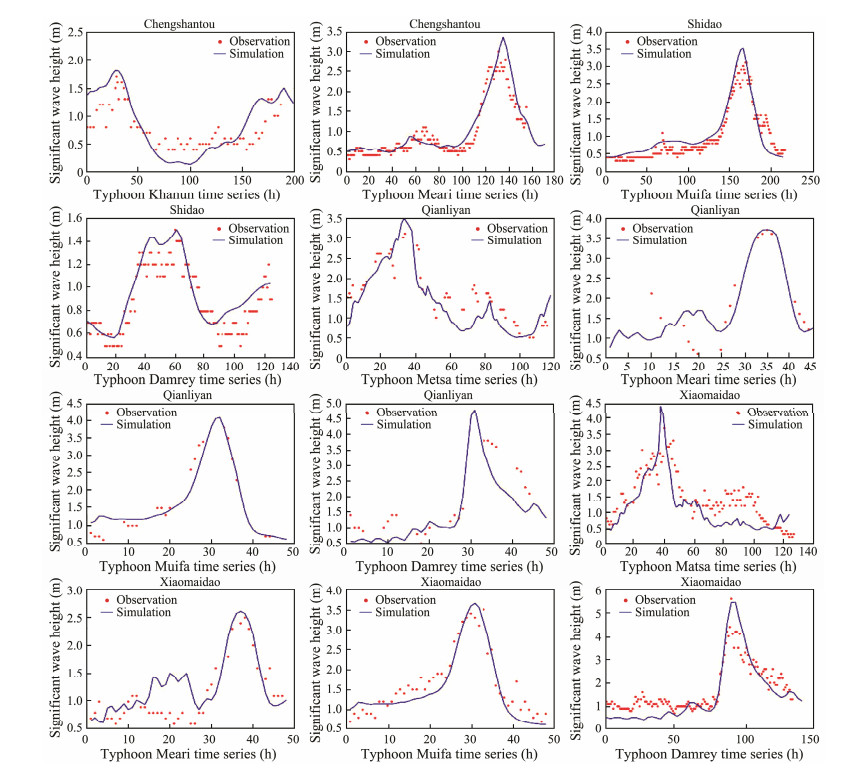
To verify the model, we select Chengshantou, Shidao, Qianliyan, and Xiaomaidao as the verification points (Fig.4). Five typhoon cases are used to simulate the waves: Typhoon Matsa, Typhoon Khanun, Typhoon Meari, Typhoon Muifa, and Typhoon Damrey. The verification results are shown in Fig.5. The observation and simulation results show a good agreement. The amplitude, maximum peaks, and arrival time are well predicted in almost all stations.

|
Fig. 4 Location of observation station. |
|
Fig. 5 Validation of significant wave height at four stations during typhoon progresses. |
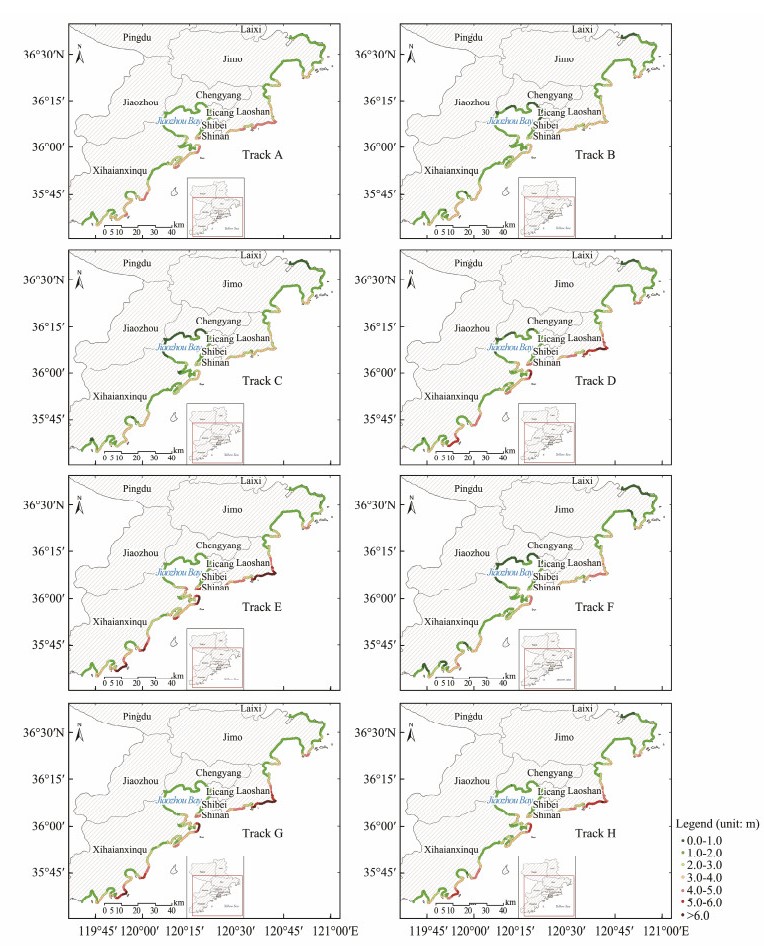
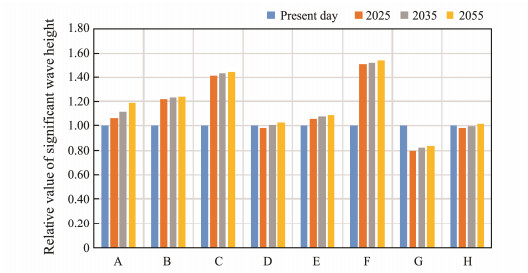
The maximum values of the significant wave heights of 506 typical points of eight typical present-day typhoon progresses are shown in Fig.6. The eight types of typhoons exert different effects on the significant wave height in Qingdao. The distributions of the significant wave heights in the coastal areas of Qingdao greatly vary. The significant wave height outside the bay is larger than that inside the bay. The maximum values of the significant wave heights of the eight typical present-day typhoon progresses inside the bay mainly range from 0 m to 2 m and are mainly distributed near the coastal area of Laoshan. The maximum values of the significant wave heights of the eight typical present-day typhoon progresses are shown in Fig.7. The results indicate that the significant wave height of Track E is the largest among all eight cases. The maximum value is 7.91 m. In addition, the maximum value of the significant wave height of the 506 typical points of Track G is 7.14 m, which is noted near the coastal area of Laoshan.
|
Fig. 6 Maximum values of the significant wave heights of 506 typical points of eight typical present-day typhoon progresses. |
|
Fig. 7 Relative maximum values of significant wave heights of eight typical typhoon progresses in different scenarios. |
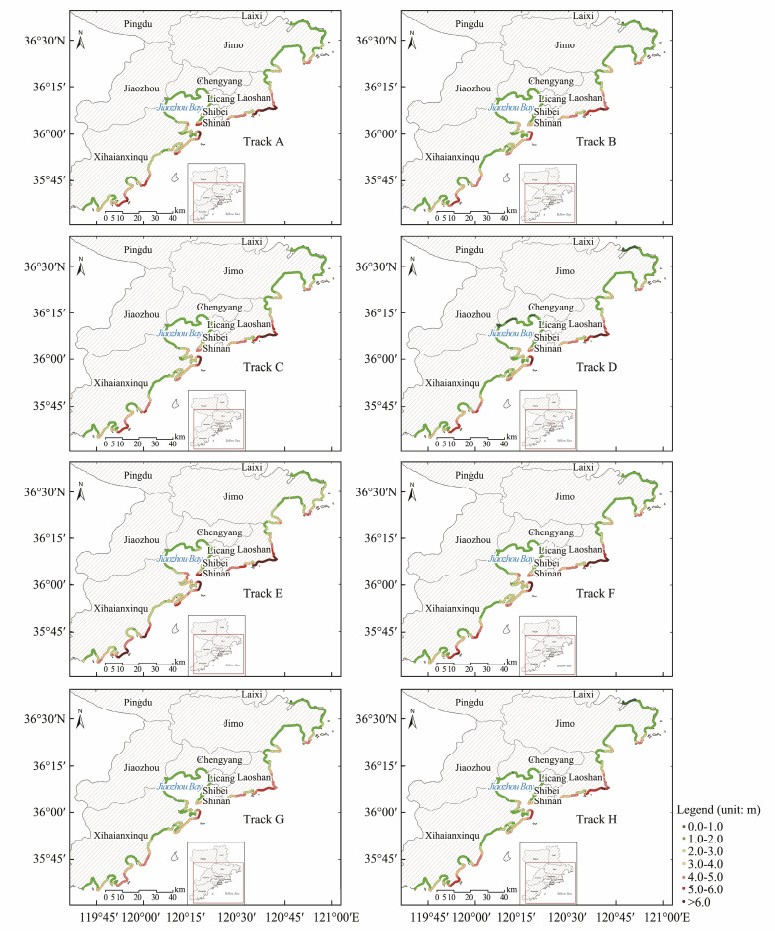
The maximum values of the significant wave heights of the 506 typical points of eight typical future typhoon progresses in the 2055 scenario are shown in Fig.8. The results indicate that these eight types of typhoons exert different effects on the significant wave height in Qingdao. The distributions of the significant wave heights in the coastal areas of Qingdao in future scenarios greatly vary. The significant wave height outside the bay is generally larger than that inside the bay. The maximum values of the significant wave heights of the eight typical typhoon progresses inside the bay in future scenarios are mainly distributed in the range of 0–2 m. The maximum values of the significant wave heights of the eight typical typhoon progresses in future scenarios is mainly distributed near the coastal area of Laoshan, Xihaianxinqu, and south of Jiaozhou Bay.
|
Fig. 8 Maximum values of the significant wave heights of 506 typical points of eight typical typhoon progresses in 2055. |
The relative maximum values of the significant wave heights of the eight typical typhoon progresses in future scenarios are shown in Fig.7. The significant wave heights of the 506 typical points of the eight typical typhoon progresses are projected to gradually increase in the period of 2025–2055, except for Tracks G and H. Compared with those in the historical scenario, the maximum values of the significant wave heights of Tracks G and H in future scenarios are smaller. The increments of Tracks C and F are most obvious. The significant wave height of Track C will increase by 40.8% in 2025, 42.8% in 2035, and 44.4% in 2055. The significant wave height of Track F will increase by 50.5% in 2025, 51.8% in 2035, and 53.4% in 2055.
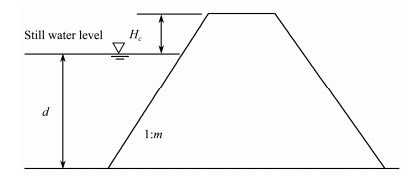
4 Wave Overtopping 4.1 Estimation MethodThe empirical prediction formula used in this study is based on a design code in China ('Code of Hydrology for Harbour and Waterway', JTS145-2015). The formula illustrates wave overtopping under a positive freeboard (Fig.9). The formula of wave overtopping discharge is as follows and is suitable for the case in China:
| $ Q=A{K}_{A}\frac{{H}_{s}^{2}}{{T}_{p}}{\left(\frac{{H}_{c}}{{H}_{s}}\right)}^{-1.7}\left[\frac{1.5}{\sqrt{m}}\text{th}{\left(\frac{d}{{H}_{s}}-2.8\right)}^{2}\right]\mathrm{ln}\sqrt{\frac{g{T}_{p}^{2}m}{2\text{π}{H}_{s}}}, $ | (1) |
|
Fig. 9 Wave overtopping under positive freeboard. |
where Q is the wave discharge, Tp is the peak wave period, Hs is the significant wave height, Hc is the height over the still water level, m is the ramp slope, d is the water depth, g is the earth gravity acceleration, and A and KA are the empirical coefficients corresponding to bank protection structure.
The water level in a 50-year return period in Dagang Station, Qingdao, is 3.09 m, which is calculated with the Gumbel method for the period of 1959–2003. The storm surges in present and future scenarios are considered and are simulated by FVCOM. Thus, Hc in this work denotes the comprehensive value of storm surge, water level for a 50-year return period (3.09 m), and a surplus value of 1.0 m. Exactly 506 representative points are selected in this work to estimate wave overtopping. The data are shown in Table 3. The astronomic tide and storm surge data are obtained from the results of the FVCOM simulation. The wave data are obtained from the SWAN model. The seawall elevations are calculated by extreme high level (50-year return period) plus surplus value (0.5–1 m). The sea level rise is estimated on the basis of the station observation data.
|
|
Table 3 Data used for wave overtopping estimation |
The maximum values of overtopping of the 506 typical points of the eight typical present-day typhoon progresses are shown in Fig.10. The eight types of typhoons exert different effects on overtopping in Qingdao. The distributions of overtopping in the coastal areas of Qingdao significantly vary. The overtopping outside the bay is generally larger than that inside the bay. The maximum values of the overtopping of the eight typical present-day typhoon progresses inside the bay are mainly distributed in the range of 0−60 m3 km−1 s−1. The maximum values of the overtopping of the eight typical present-day typhoon progresses are mainly distributed near the coastal area of Laoshan and Xihaianxinqu.
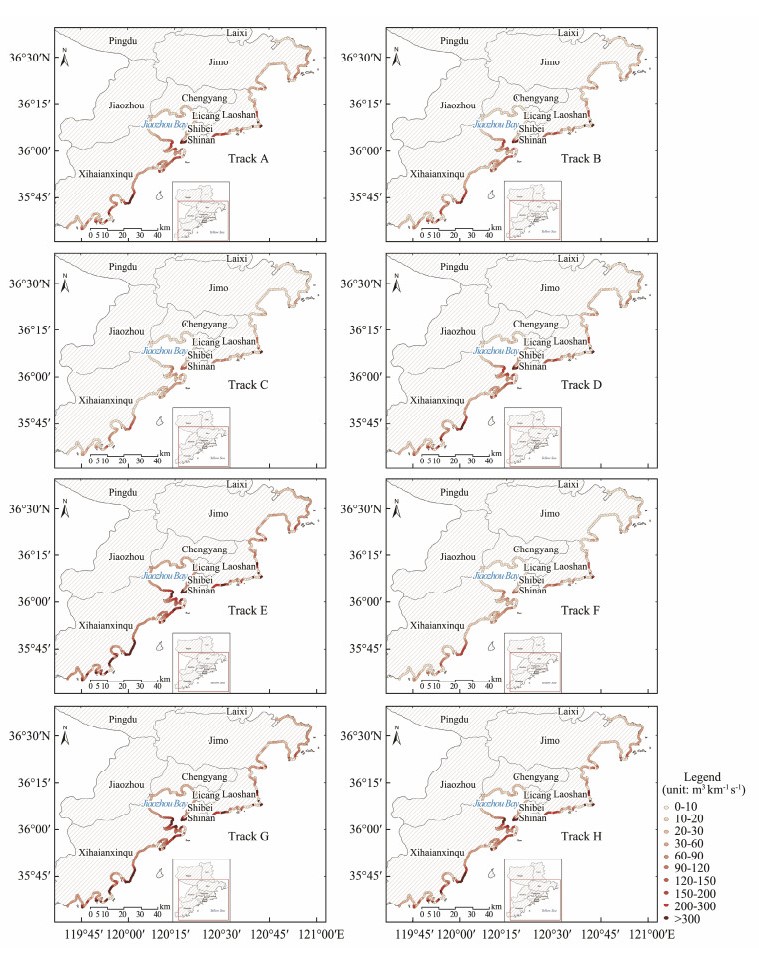
|
Fig. 10 Maximum values of overtopping of 506 typical points of eight typical present-day typhoon progresses. |
The maximum values of overtopping of the eight typical present-day typhoon progresses are shown in Fig.11. The results show that the overtopping of the 506 typical points of Track E is the largest among the eight typhoon progresses. The maximum value is 2344 m3 km−1 s−1 and is noted near the coastal area of Laoshan. In addition, the maximum values of overtopping of the 506 typical points of the other typhoon progresses occur near the coastal area of Laoshan.
|
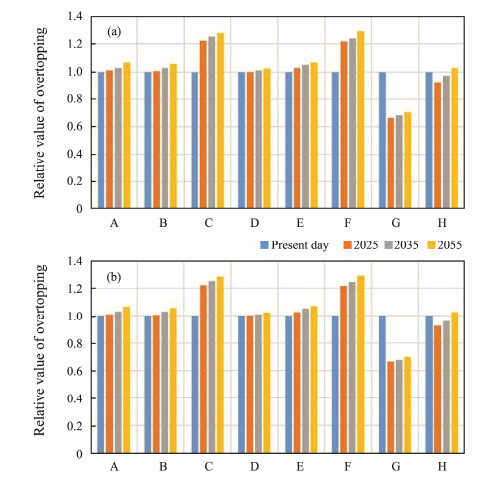
Fig. 11 Relative maximum values of overtopping of eight typical typhoon progresses in the 2℃ scenario (a) and 4℃ scenario (b). |
Future sea level rise is considered. We predict the rate of coastal sea level rise in Qingdao as follows on the basis of the statistical sea level change forecasting model and greenhouse gas emission concentration scenarios, combined with the trends and periodic changes in the coastal sea level history of Qingdao. Under the 2℃ global warming scenario, the rate of coastal sea level rise in Qingdao is 3.0 mm yr−1. Relative to the level in 2010, Qingdao's coastal sea levels in 2025, 2035, and 2055 will increase by 4–10 cm (7±3), 8–16 cm (12±4), and 14–28 cm (21±7), respectively. Under the 4℃ global warming scenario, the rate of Qingdao's coastal sea level rise is 6.5 mm yr−1. Relative to the level in 2010, Qingdao's coast sea levels in 2025, 2035, and 2055 will increase by 5–11 cm (8±3), 10–18 cm (14±4), and 16–32 cm (24±8), respectively.
The maximum values of overtopping of the 506 typical points of the eight typical typhoon progresses in a future 2℃ scenario are shown in Fig.12. The eight types of typhoons exert different effects on overtopping in Qingdao. The distributions of overtopping in the coastal areas of Qingdao under the 2℃ scenario greatly vary. Overtopping outside the bay is generally larger than that inside the bay. The maximum values of overtopping of the eight typical typhoon progresses inside the bay in the 2℃ scenario are mainly distributed in the range of 0–60 m3 km−1 s−1. The maximum values of overtopping of the eight typical typhoon progresses in the 2℃ scenario are mainly distributed near the coastal area of Laoshan, Xihaianxinqu, and south of Jiaozhou Bay.

|
Fig. 12 Maximum values of overtopping of 506 typical points of eight typical typhoon progresses in 2055 under the 2℃ scenario. |
The relative maximum values of overtopping of the eight typical typhoon progresses in the 2℃ scenario are shown in Fig.11a. The overtopping of the 506 typical points of the eight typical typhoon progresses in the 2℃ scenario will gradually increase in the period of 2025– 2055, except for Tracks G and H. Compared with those in the historical scenario, the maximum values of wave overtopping of Tracks G and H in future scenarios is smaller. The increments of Tracks C and F in particular are most obvious. In the 2℃ scenario, the maximum value of wave overtopping of Track C will increase by 22.5% in 2025, 25.4% in 2035, and 28.0% in 2055. The maximum value of wave overtopping of Track F will increase by 21.9% in 2025, 24.3% in 2035, and 29.5% in 2055.
The maximum values of overtopping of the 506 typical points of the eight typical typhoon progresses in a future 4℃ scenario are shown in Fig.13. The results demonstrate that these eight types of typhoons exert different effects on overtopping in Qingdao. The distributions of overtopping in the coastal areas of Qingdao in the 4℃ scenario significantly differ. The overtopping outside the bay is generally larger than that inside the bay. The maximum values of overtopping of the eight typical typhoon progresses inside the bay in the 4℃ scenario are mainly distributed in the range of 0–60 m3 km−1 s−1. The maximum values of overtopping of the eight typical typhoon progresses in the 4℃ scenario are mainly distributed near the coastal area of Laoshan, Xihaianxinqu, and south of Jiao-zhou Bay.
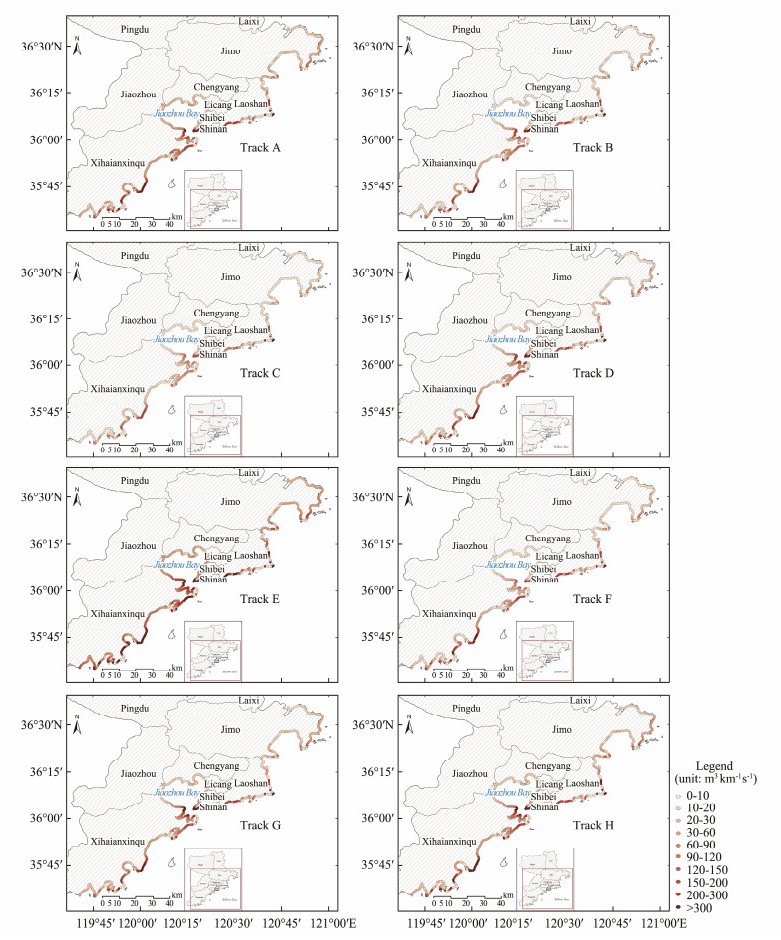
|
Fig. 13 Maximum values of overtopping of 506 typical points of eight typical typhoon progresses in 2055 under the 4℃ scenario. |
The relative maximum values of overtopping of the eight typical typhoon progresses in the 4℃ scenario are shown in Fig.11b. The overtopping of the 506 typical points of the eight typical typhoon progresses in the 4℃ scenario will gradually increase in the period of 2025– 2055, except for Tracks G and H. Compared with those in the historical scenario, the maximum values of wave overtopping of Tracks G and H progress in future scenarios are smaller. The increments of Tracks C and F in particular are most obvious. In the 4℃ scenario, the maximum value of wave overtopping of Track C will increase by 22.5% in 2025, 25.1% in 2035, and 28.3% in 2055. The maximum value of wave overtopping of Track F will increase by 21.9% in 2025, 24.3% in 2035, and 29.5% in 2055.
In sum, the results show that regardless of the global warming scenario, overtopping will present an increasing trend. Overtopping in the same year will slightly increase in the two global warming scenarios.
5 ConclusionsThis work explores the impact of climate change on typhoons and wave overtopping during typhoon progresses in Qingdao. The SWAN wave model is used to simulate the wave elements. The scale coefficients of wave overtopping are estimated using an empirical prediction formula. A total of 75 tropical cyclones affected Qingdao from 1949 to 2019. These cyclones are divided into eight categories according to the typhoon tracks. Typhoon wind speed, except for that of Track G, is projected to increase by 0.35%–0.75% in 2025, 0.69%–1.5% in 2035, and 1.38%–3.0% in 2055.
The SWAN spectral wave model is used to simulate wave elements. Among the 506 typical points selected, the significant wave height outside the bay is larger than that inside the bay. In addition, the maximum value of the significant wave height inside the bay is mainly distributed in the range of 0–2 m. The increments of Tracks C and F are most obvious. The significant wave height of Track C will increase by 40.8% in 2025, 42.8% in 2035, and 44.4% in 2055. The significant wave height of Track F will increase by 50.5% in 2025, 51.8% in 2035, and 53.4% in 2055.
The scale coefficients of wave overtopping are estimated using an empirical prediction formula. Among the 506 typical points selected, wave overtopping outside the bay is larger than that inside the bay. In addition, the maximum value of wave overtopping inside the bay is mainly distributed in the range of 0–60 m3 km−1 s−1. The increments of Tracks C and F are most obvious. In the 2℃ scenario, the maximum value of wave overtopping of Track C is projected to increase by 22.5% in 2025, 25.4% in 2035, and 28.0% in 2055. The maximum value of wave overtopping of Track F is projected to increase by 21.9% in 2025, 24.3% in 2035, and 29.5% in 2055. In the 4℃ scenario, the maximum value of wave overtopping of Track C will increase by 22.5% in 2025, 25.1% in 2035, and 28.3% in 2055. The maximum value of wave overtopping of Track F will increase by 21.9% in 2025, 24.3% in 2035, and 29.5% in 2055.
AcknowledgementsThis study is supported by the National Key Research and Development Program of China (No. 2016YFC1401103), the National Natural Science Foundation of China (No. 51779236), the International Cooperation Projects (No. INTASAVE ACCC-045), and the Open Fund of Shandong Province Key Laboratory of Ocean Engineering.
Bacmeister, J. T., Reed, K. A., Hannay, C., Lawrence, P., Bates, S., Truesdale, J. E., Rosenbloom, N. and Levy, M., 2018. Projected changes in tropical cyclone activity under future warming scenarios using a high-resolution climate model. Climatic Change, 146: 547. DOI:10.1007/s10584-016-1750-x (  0) 0) |
Booij, N., Ris, R. C. and Holthuijsen, L. H., 1999. A third-generation wave model for coastal regions: 1. Model description and validation. Journal of Geophysical Research: Oceans (1978-2012), 104(C4): 7649-7666. DOI:10.1029/98JC02622 (  0) 0) |
Dahmani, A. E. A., Bachari, F., Mezouar, K., and Boudouma, Z., 2017. Physical and numerical modeling complementarity for an overtopping study of the Algerian Center Zone 'The Site of the Sablettes'. Euro-Mediterranean Conference for Environmental Integration. Sousse, Tunisia, 1607-1609.
(  0) 0) |
Dong, S., Huang, W., Li, X. and Tao, S., 2017. Study on temporal and spatial characteristics of cold waves in Shandong Province of China. Natural Hazards, 88(3): 191-219. (  0) 0) |
Elsner, J. B., 2006. Evidence in support of the climate change - Atlantic hurricane hypothesis. Geophysical Research Letters, 33: 16705. DOI:10.1029/2006GL026869 (  0) 0) |
Elsner, J. B. and Jagger, T. H., 2004. A hierarchical Bayesian approach to seasonal hurricane modeling. Journal of Climate, 17: 2813-2827. DOI:10.1175/1520-0442(2004)017<2813:AHBATS>2.0.CO;2 (  0) 0) |
Feng, L. and Lin, X., 2009. Long-term trend of the East China Sea surface temperature during 1945-2006. Periodical of Ocean University of China, 39(1): 13-18 (in Chinese with English abstract). (  0) 0) |
Gray, W. M., Landsea, C. W., Mielke Jr., P. W. and Berry, K. J., 1993. Predicting Atlantic basin seasonal tropical cyclone activity by 1 August. Weather and Forecasting, 8: 73-86. DOI:10.1175/1520-0434(1993)008<0073:PABSTC>2.0.CO;2 (  0) 0) |
Hoyos, C. D., Agudelo, P. A., Webster, P. J. and Curry, J. A., 2006. Deconvolution of the factors contributing to the increase in global hurricane intensity. Science, 312: 94-97. DOI:10.1126/science.1123560 (  0) 0) |
Hughes, S. A. and Nadal, N. C., 2009. Laboratory study of combined wave overtopping and storm surge overflow of a levee. Coastal Engineering, 56(3): 244-259. DOI:10.1016/j.coastaleng.2008.09.005 (  0) 0) |
Jelesnianski, C. P., 1965. A numerical calculation of storm tides induced by a tropical storm impinging on a continental shelf. Monthly Weather Review, 93(6): 83-88. (  0) 0) |
Ji, Q. and Dong, S., 2018. Modelling wave transmission and overtopping based on energy balance equation. Journal of Ocean University of China, 17(5): 1033-1043. DOI:10.1007/s11802-018-3591-x (  0) 0) |
Lehmiller, G. S., Kimberlain, T. B. and Elsner, J. B., 1997. Seasonal prediction models for North Atlantic basin hurricane location. Monthly Weather Review, 125: 1780-1791. DOI:10.1175/1520-0493(1997)125<1780:SPMFNA>2.0.CO;2 (  0) 0) |
Lei, X., 2011. The main assessment conclusions and issues of the impacts of global climate change on tropical cyclone activities. Bulletin of National Natural Science Foundation of China, 2: 85-89 (in Chinese with English abstract). (  0) 0) |
Lin, Y. F., Dong, S., Wang, Z. F. and Soares, C. G., 2019. Wave energy assessment in the China adjacent seas on the basis of a 20-year SWAN simulation with unstructured grids. Renewable Energy, 136: 275-295. DOI:10.1016/j.renene.2019.01.011 (  0) 0) |
Mann, M. E. and Emanuel, K. A., 2006. Atlantic hurricane trends linked to climate change. Eos Transactions American Geophysical Union, 87: 233-244. (  0) 0) |
Nørgaard, J. Q. H., Andersen, T. L. and Burcharth, H. F., 2014. Distribution of individual wave overtopping volumes in shallow water wave conditions. Coastal Engineering, 83: 15-23. DOI:10.1016/j.coastaleng.2013.09.003 (  0) 0) |
Pan, W., Qian, G., Yu, K. and Chen, T., 2007. Study on variation characteristics of SST observed in the past 40 years in the coastal region of South China. Journal of Tropical Meteorology, 13(2): 177-180. (  0) 0) |
Pan, Y., Kuang, C. P., Li, L. and Amini, F., 2015. Full-scale laboratory study on distribution of individual wave overtopping volumes over a levee under negative freeboard. Coastal Engineering, 97: 11-20. DOI:10.1016/j.coastaleng.2014.12.007 (  0) 0) |
Pillai, K., Etemad-Shahidi, A. and Lemckert, C., 2017. Wave overtopping at berm breakwaters: Review and sensitivity analysis of prediction models. Coastal Engineering, 120: 1-21. DOI:10.1016/j.coastaleng.2016.11.003 (  0) 0) |
Ris, R. C., Holthuijsen, L. H. and Booij, N., 1999. A third-generation wave model for coastal regions: 2. Verification. Journal of Geophysical Research: Oceans (1978-2012), 104(C4): 7667-7681. DOI:10.1029/1998JC900123 (  0) 0) |
Shen, Y., Sun, Y., Zhong, Z., Liu, K. F. and Shi, J., 2018. Sensitivity experiments on the poleward shift of tropical cyclones over the western North Pacific under warming ocean conditions. Journal of Meteorological Research, 32: 560. DOI:10.1007/s13351-018-8047-0 (  0) 0) |
Sierra, J. P., Casanovas, I., Mösso, C., Mestres, M. and Sánchez-Arcilla, A., 2016. Vulnerability of Catalan (NW Mediterranean) ports to wave overtopping due to different scenarios of sea level rise. Regional Environmental Change, 16: 1457-1468. DOI:10.1007/s10113-015-0879-x (  0) 0) |
Su, Q., Zheng, C., Yang, Y. and Chen, X., 2014. Long-term trend analysis of ST for past hundred years in the Northwest Pacific Ocean. Marine Forecasts, 31(2): 50-55 (in Chinese with English abstract). (  0) 0) |
Sun, C., Zheng, C. and Chen, X., 2015. Seasonal characteristics and long-term trend analysis of SST in the global ocean. Marine Environmental Science, 34(5): 713-717 (in Chinese with English abstract). (  0) 0) |
Victor, L., Van der Meer, J. W. and Troch, P., 2012. Probability distribution of individual wave overtopping volumes for smooth impermeable steep slopes with low crest freeboards. Coastal Engineering, 64: 87-101. DOI:10.1016/j.coastaleng.2012.01.003 (  0) 0) |
Wang, Z. F., Dong, S., Li, X. and Soares, C. G., 2016. Assessments of wave energy in the Bohai Sea, China. Renewable Energy, 90: 145-156. DOI:10.1016/j.renene.2015.12.060 (  0) 0) |
Williams, H. E., Briganti, R. and Pullen, T., 2014. The role of offshore boundary conditions in the uncertainty of numerical prediction of wave overtopping using non-linear shallow water equations. Coastal Engineering, 89: 30-44. DOI:10.1016/j.coastaleng.2014.03.003 (  0) 0) |
Xiao, H., Huang, W. and Tao, J., 2009. Numerical modeling of wave overtopping a levee during Hurricane Katrina. Computers and Fluids, 38(5): 991-996. DOI:10.1016/j.compfluid.2008.01.025 (  0) 0) |
 2020, Vol. 19


