2) Department of Electronics, Information and Bioengineering, Politecnico di Milano, Milan 20133, Italy;
3) College of Engineering, Ocean University of China, Qingdao 266000, China
Underwater gliders (UGs) have been developed for autonomous oceanic sampling purposes (Kan et al., 2008; Rudnick et al., 2016) and have been deployed for various oceanographic tasks (Liu et al., 2019; Li et al., 2020; Zang et al., 2022a). Path planning techniques have become key solutions to utilize the observation potential of gliders effectively (Chen and Zhu, 2020; Fu et al., 2022; Shi et al., 2022). This study aims to enhance the autonomy of samplings and reduce the involvement of oceanographers by investigating cooperative sampling of a group of UGs with simultaneous launch and recovery (SLR) (Sarda and Dhanak, 2017). The members of the fleet are launched from the same location, and their paths are manipulated to perform cooperative samplings according to the edges of interest. Each UG was required to return to the launch site after sampling for near-synchronous recovery. Therefore, cooperative sampling path planning with SLR (CSPP-SLR) of the UG fleet is investigated.
UGs are buoyancy-driven autonomous robots with limited onboard equipment. The travel speeds of these UGs are comparable to the prevailing currents (Rudnick et al., 2018; Sang et al., 2018; Han et al., 2020). Such properties impose several limitations on UG path planning (Wang et al., 2020). First, the UG can only be remotely controlled via satellite communication on the seawater surface. Second, the interference of currents contributes to the UG positions with significant randomness. Third, UGs move in three dimensions, complicating coordination policies.
Previous works have obtained significant achievements in planning UG paths under the disturbances of currents (Wu et al., 2021; Zang et al., 2022b). The line-of-sight (LOS) method has distinct advantages in ensuring the convergence and effectiveness of path planning (Lekkas and Fossen, 2013; Gao and Guo, 2019). However, the application of LOS in rectangular edge sampling needs further exploration.
Considering multi-UG cooperation, intelligent algorithms show their advantages in solving such complex optimization problems (Shih et al., 2017). Zhuang et al. (2019) and Yao and Qi (2019) investigated simultaneous arrivals. However, cooperative sampling with SLR has not been fully discussed. The CSPP-SLR can maximize UGs in autonomous sampling, improve the high-risk deployment and recovery process of UGs, and ensure the consistency of the collected data (Claustre et al., 2014). Therefore, investigating CSPP-SLR is notably important. The above method is no longer applicable, considering the randomness of the current-disturbed UG locations and the uncertainty of the cooperating instructions (Petritoli and Leccese, 2018). Reinforcement learning (e.g., Bae et al., 2019; Ban, 2020) can provide appropriate solutions by modeling CSPP-SLR as a Markovian decision process.
This article presents the multi-actuation deep-Q network with a clipped-oriented LOS (MADQN-COLOS) framework based on the above discussions to solve the CSPP-SLR problem. The potential contributions are listed as follows.
1) The CSPP-SLR problem is comprehensively described for the first time. This article considers the specific UG kinematic model, current interference, and optimization objectives.
2) The COLOS is proposed to guide the UG to cover sampling paths of interest. The modification to the original LOS maintains computational simplicity while ensuring the loop coverage, which comprises multi-directional edges.
3) The MADQN is designed to coordinate the progress of samplings, which decomposes based on the SLR dynamic planning. Therefore, the sampling progress is coordinated by manipulating the estimated time of arrival, which enables the acquisition of feasible coordinating solutions.
The remaining article is organized as follows. Section 2 describes the path planning problem. Section 3 introduces the proposed methodology. Section 4 presents the simulation results. Section 5 finally summarizes the conclusion.
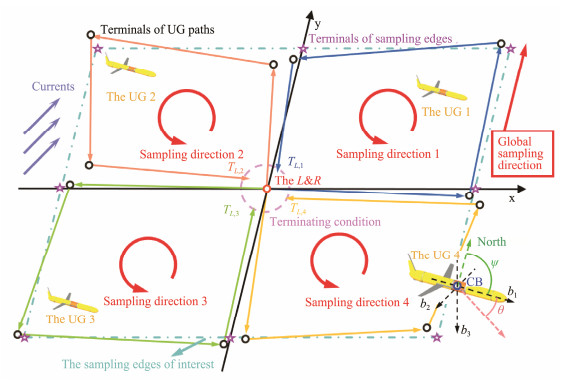
2 Problem FormulationThe illustration of the CSPP-SLR is shown in Fig.1. L & R represents the launch and recovery point, and its coordinates are denoted as p0. The glider fleet must move in the same direction to achieve uniform directionality of the collected data. The members of the fleet start from the same launch point and navigate along their assigned local rectangular edges. The current work considers time-fixed and spatially varying currents, which means that the UGs in the four local samplings have different arrival times TL, i. Therefore, this work can be expressed as Eqs. (1) to (3).
| $ {\text{Minimize}}[\max ({T_{L, i}}) - \min ({T_{L, i}})], \;{\text{where}}\;i = {\text{1, 2, 3, 4}}, $ | (1) |
| $ s.t.\left\{ {\begin{array}{*{20}{c}} {\sum\limits_{i = {\text{1}}}^{\text{4}} {\sum\limits_{k = {\text{1}}}^f {\left\| {{p_{k, i}} - {p_{E, i}}} \right\|_{\text{2}}^{\text{2}} \leqslant {\Gamma _{\text{1}}}} } } \\ {{\psi _l} \leqslant \psi \leqslant {\psi _u}} \\ {{\theta _l} \leqslant \theta \leqslant {\theta _u}} \end{array}} \right., $ | (2) |
| $ {\text{Termination}}{\kern 1pt} {\kern 1pt} {\kern 1pt} {\text{condition: }}\left\| {{p_{f, i}} - {p_{\text{0}}}} \right\|_{\text{2}}^{\text{2}} \leqslant {\Gamma _{\text{2}}}, $ | (3) |
|
Fig. 1 Illustration of the CSPP-SLR mission. |
where pk, i represents the coordinates of the kth waypoint in the local sampling i. The final of the local sampling is represented by the subscript f. The points on the edges of interests are demonstrated as pE, i. The Γ1 and Γ2 are the predefined bounds for the coverage to the edges and the termination tolerance of sampling, respectively. The subscripts l and u respectively demonstrate the lower and upper boundaries of the control parameters that comprise heading ψ and the pitch θ. The kinetic model of UG below is first introduced to address the described problem. The single path planning is then analyzed for local sampling. Finally, the coordination between UGs is discussed.
2.1 Underwater Glider Kinetic ModelAssuming that UG holds the fixed composite velocity V during navigation, the kinetic model of UG is given in Eq. (4).
| $ \left\{ {\begin{array}{*{20}{c}} {{{\dot x}_{k, i}} = V \cdot \cos {\theta _{k, i}} \cdot {{\cos }_{k, i}}} \\ {{{\dot y}_{k, i}} = V \times \cos {\theta _{k, i}} \times \sin {n_{k, i}}} \\ {{{\dot z}_{k, i}} = V \times \sin {\theta _{k, i}}} \end{array}} \right., $ | (4) |
the xk, i, yk, i, and zk, i, which illustrate the kth coordinates of the UG in the local sampling i, θk, i, and ψk, i, respectively, represent the corresponding pitch and heading angles. Such a series of waypoints pk, i in the horizontal plane can be described via the tuples of (xk, i, yk, i).
The time consumption is twice the time taken by either of the two phases considering the symmetric dive and float phases. The single profile time for UG i can then be expressed as Eq. (5).
| $ {t_{k, i}} = \frac{{{\text{2}}D}}{{V\sin {\theta _{k, i}}}}, $ | (5) |
where D denotes the maximum diving depth of the UG. The current-free displacement of the UG can be expressed as Eq. (6).
| $ \left\{ {\begin{array}{*{20}{c}} {{{x'}_{k, i}} = {x_{k, i}} + {{\dot x}_{k, i}}{t_{k, i}}} \\ {{{y'}_{k, i}} = {y_{k, i}} + {{\dot y}_{k, i}}{t_{k, i}}} \end{array}} \right. . $ | (6) |
The current disturbance must be considered for the low speed of the UG. Superimposing the current vector vc, the synthetic velocities ve are obtained in the current field as follows: ve = vc + V. Therefore, the current-influenced positions of the UG can be simulated. However, the current interference has significant randomness and is coupled with the geographical coordinates, as shown in Eq. (7). Random variables X [vc(xk, i, yk, i)] and Y [vc(xk, i, yk, i)] demonstrate current-induced displacement. This randomness causes differences for the TL, i. Moreover, the different determinations of ψ and θ at step k exacerbate the randomness of the TL, i.
| $ \left\{ {\begin{array}{*{20}{c}} {{x_{k + 1, i}} = {{x'}_{k, i}} + X[{v_c}({x_{k, i}}, {y_{k, i}})]} \\ {{y_{k + 1, i}} = {{y'}_{k, i}} + Y[{v_c}({x_{k, i}}, {y_{k, i}})]} \end{array}} \right. . $ | (7) |
The proposed solution architecture can be divided into two parts: single path planning for local sampling and coordination for fleet navigation.
2.2.1 Single path planning for local samplingThe shift in displacement due to currents can be denoted as the vector connecting pk, π and p'k, π. The policy π(ψ, θ) determines the specific heading and pitch instructions sent to the UGs. The resultant waypoints obtained from the planning can then be described as the stochastic process S, as shown in Eq. (8). The series of UG waypoints in one planning can be observed by using the planning policy. Similarly, the set of Cartesian coordinates for a fixed point p under the determination of different π is a random variable. Eq. (9) is obtained by expanding the TL, i, which is also a stochastic process. Solving the coordination to meet the objective in Eq. (1) is difficult via mathematical analysis.
| $ S\left\{ {({x_{k, i}}, {y_{k, i}})|{\text{π }} \in [{{\text{π }}_{\text{1}}}, {{\text{π }}_{\text{2}}}, \cdot \cdot \cdot {\kern 1pt}, {{\text{π }}_n}]} \right\}, $ | (8) |
| $ {T_{L, i}} = \sum\limits_{i = {\text{1}}}^f {{t_{k, i}}} . $ | (9) |
However, without considering coordination, the main demand for single path planning is to cover the edges of interest. Directions of sampling to edges are defined in Eq. (10), where Ns, i demonstrates the switch nodes of edges (the pink star in Fig.1). tan2 is the operator for azimuth calculation. The length of the edge is denoted as L. The switch nodes can then be set on the basis of L to achieve autonomous coverage of the rectangular edges. Specifically, for the current sampling edge Ns, i Ns+1, i, if Eq. (11) holds, then the sampling to the current edge is terminated. The subsequent profile will be set to cover the next edge Ns+1, i Ns+2, i.
| $ {\psi _{{\text{edge}}}} = a\tan {\text{2}}\left({\frac{{{N_{s + {\text{1}}, i, y}} - {N_{s, i, y}}}}{{{N_{s + {\text{1}}, i, x}} - {N_{s, i, x}}}}} \right), s = {\text{1, }} \cdot \cdot \cdot, {\kern 1pt} {\kern 1pt} {\text{4}}, $ | (10) |
| $ {r_{k, i}} = \sqrt {{{({x_{k, i}} - {N_{s + {\text{1}}, i, x}})}^{\text{2}}} + {{({y_{k, i}} - {N_{s + {\text{1}}, i, y}})}^{\text{2}}}} . $ | (11) |
During sampling to local edges, Pgk, i is defined to describe the sampling progress at step k, as shown in Eq. (12). The equation reveals that the samplings to edges can be divided into independent sections. Considering the ideal cases in which the UG navigates strictly along the target edges constantly,
| $ P{g_{k, i}} = \left\{ {\begin{array}{*{20}{c}} {\frac{{{y_{k, i}} - {N_{s, i, y}}}}{{{N_{s + {\text{1}}, i, y}} - {N_{s, i, y}}}}, {N_{s + {\text{1}}, i, x}} = {N_{s, i, x}}} \\ {\frac{{{x_{k, i}} - {N_{s, i, x}}}}{{{N_{s + {\text{1}}, i, x}} - {N_{s, i, x}}}}, {N_{s + {\text{1}}, i, y}} = {N_{s, i, y}}} \end{array}} \right. . $ | (12) |
The ETAk, i is introduced for each local sampling to facilitate fleet coordination. First, the remaining portion of the local sampling is defined as
relevant average velocity of the passed routes is denoted in Eq. (13), and the ETAk, i at step k for UG i can be described through Eq. (14).
| $ {\bar v_{k, i}} = \frac{{\sum\limits_{i = {\text{1}}}^{\text{4}} {\sum\limits_{k = {\text{1}}}^f {P{g_{k, i}}} } }}{{\sum\limits_{i = {\text{1}}}^{\text{4}} {\sum\limits_{k = {\text{1}}}^f {{t_{k, i}}} } }}, $ | (13) |
| $ ET{A_{k, i}} = \frac{{{\text{4}} - \sum\limits_{i = {\text{1}}}^{\text{4}} {\sum\limits_{k = {\text{1}}}^f {P{g_{k, i}}} } }}{{{{\bar v}_{k, i}}}} . $ | (14) |
The members of the UG fleet depart simultaneously. Thus, the SLR is achieved once the equalization of all ETAk, i is guaranteed. From the perspective of a dynamic program, the SLR can be divided into ETAk, i optimization at k for all UGs. Therefore, Eq. (15) is provided to design the reward function for the reinforcement learning approach.
| $ LDP = {\text{minimize}}\left\{ {\max (ET{A_{k, i}}) - \min (ET{A_{k, i}})} \right\} . $ | (15) |
The proposed resolution for CSPP-SLR can be divided into two architectures. First, the coverage path plan for every single sampling is guaranteed by manipulating the heading of the UG with the proposed COLOS. Simultaneously, the proposed MADQN coordinated the pitch of each UG to meet the SLR.
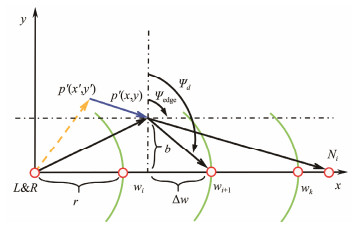
3.1 Description of COLOSReference (Lekkas and Fossen, 2013) introduces the LOS for path planning of marine vehicles. The main principles are demonstrated in Fig.2, where w is the defined separation that is used to anchor the look-ahead distance. The LOS formulation is presented in Eq. (16). The strategy of determining the sign of bias b is constant for monodirectional navigation. The look-ahead distance Δw remains constant positive, while the bias b resolves the direction of adjusting the ψd.
| $ {\psi _d} = {\psi _{{\text{edge}}}} + \arctan \frac{b}{{\Delta w}} . $ | (16) |
|
Fig. 2 Naive line-of-sight guidance law. |
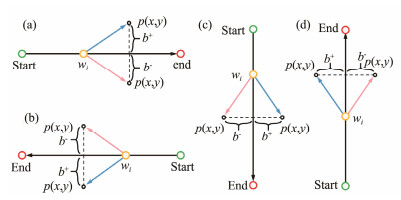
LOS is inapplicable for rectangular sampling. The LOS is modified in accordance with the sampling edge, and the COLOS, which is presented in Eq. (17), is proposed. The LOS for each local sampling can be divided into the combinations of the directed edges shown in Fig.3. Furthermore, the LOS can be divided into navigation along the x-axis direction and navigation along the y-axis. The determination of b* is illustrated by Eq. (19), where δx = Ns + 1, i, x − Ns, i, x, δy = Ns+1, i, y − Ns, i, y. Notably, the calculated ψd needs further clipping to ensure coverage and efficiency. The ψdu and the ψdl are the clipped boundaries, as respectively shown in Eqs. (17) and (18):
| $ {\psi _d} = {\psi _{{\text{edge}}}} + \arctan \frac{{{b^*}}}{{\Delta w}}, $ |
| $ s.t.\quad {\psi _{dl}} \leqslant {\psi _d} \leqslant {\psi _{du}}, $ | (17) |
| $ \left\{ {\begin{array}{*{20}{c}} {{\psi _{dl}} = \min \left\{ {{\psi _{{\text{edge}}}}, {\psi _{{\text{edge}}}} + \sin g({b^*}) \cdot \frac{{\text{π }}}{{\text{2}}}} \right\}} \\ {{\psi _{du}} = \max \left\{ {{\psi _{{\text{edge}}}}, {\psi _{{\text{edge}}}} + \sin g({b^*}) \cdot \frac{{\text{π }}}{{\text{2}}}} \right\}} \end{array}} \right., $ | (18) |
| $ {b^*} = \left\{ {\begin{array}{*{20}{c}} {({y_{k, i}} - {N_{s, i, y}}) \cdot {\delta _x}, {N_{s + {\text{1}}, i, y}} = {N_{s, i, y}}} \\ { - ({x_{k, i}} - {N_{s, i, x}}) \cdot {\delta _y}, {N_{s + {\text{1}}, i, x}} = {N_{s, i, x}}} \end{array}} \right. . $ | (19) |
|
Fig. 3 Clipped-oriented line-of-sight guidance law. |
Proposition 1: using the COLOS guidance law in Eq. (17), the convergence of waypoints to the edges is guaranteed.
Proof: the following Lyapunov function candidate is denoted below.
| $ {V_{\text{1}}} = \frac{{\text{1}}}{{\text{2}}}{({b^*})^{\text{2}}} . $ | (20) |
Differentiating the above equation, the following is obtained:
| $ {\dot V_{\text{1}}} = {b^*}{\dot b^*} . $ | (21) |
Differentiating Eq. (19),
| $ {\dot b^*} = \left\{ {\begin{array}{*{20}{c}} {{{\dot y}_{k, i}} \cdot {\delta _x}, {N_{s + {\text{1}}, i, y}} = {N_{s, i, y}}} \\ { - {{\dot x}_{k, i}} \cdot {\delta _y}, {N_{s + {\text{1}}, i, x}} = {N_{s, i, x}}} \end{array}} \right. . $ | (22) |
Eqs. (22) and (19) are then substituted into Eq. (21):
| $ {\dot V_{\text{1}}} = \left\{ {\begin{array}{*{20}{c}} {V\cos \theta \sin {\psi _d}({y_{k, i}} - {N_{s, i, y}}) \cdot \delta _x^{\text{2}}, {N_{s + {\text{1}}, i, y}} = {N_{s, i, y}}} \\ { - V\cos \theta \cos {\psi _d}({x_{k, i}} - {N_{s, i, x}}) \cdot \delta _y^{\text{2}}, {N_{s + {\text{1}}, i, x}} = {N_{s, i, x}}} \end{array}} \right., $ | (23) |
where V and cosθ are constantly positive. ψd has the constraint as shown in Eq. (18); if yk, i > Ns, i, y, then the ψd is located in the third or the fourth quadrant. Hence, (yk, i − Ns, i, y)sinψd < 0, and other cases have similar conclusions. Therefore, the derivative of V1 is negative anywhere except the origin. The COLOS can guide the UG convergence to a specified compact set around the origin of b*.
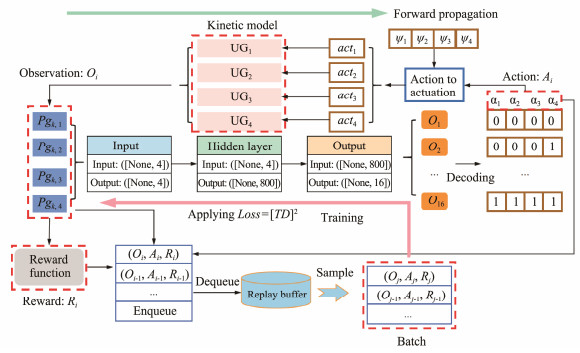
3.2 Description of the MADQNThe MADQN is demonstrated in Fig.4. Pgk, i is summarized as the input for forward propagation. Decoding the action Ai, the actuation signal of acti on the θi of each glider is obtained. The detailed encoding is listed in Table 1, where the MADQN algorithm creates actions. The actuation signals for gliders in the fleet are assigned sequentially. The reward function evaluates the control effect through the forward propagation loop. The results of each forward propagation are collected to construct the replay buffer. The MADQN is trained by sampling batches from the replay
|
Fig. 4 Overview of MADQN. buffer. |
|
|
Table 1 Encoding of action to actuation |
Table 2 depicts the MADQN algorithm. The MADQN comprises two sets of neural networks that share the same structure. The two neural networks are called the evaluated neural network Qe and the target neural network
| $ {w_{{\text{new}}}} = {w_{{\text{old}}}} + {\alpha _l}\frac{{\text{1}}}{B}\sum\limits_{i \in B} {T{D_i}\nabla {Q_e}({O_i};{A_i};{w_{{\text{old}}}})}, $ | (24) |
|
|
Table 2 Pseudocode of MADQN |
where B represents the batch data sampled from the experience replay pool ξ, and αl, wnew, and wold denote the learning rate and training parameters. The trained parameters of Qe and
| $ TD = {Q_{{\text{true}}}} - {Q_e}({O_i}), $ | (25) |
where Qtrue is defined in Eq. (26), and γ represents the discount rate. The mean squared error is selected as the optimization metric to minimize the loss between Qtrue and Qe(Oi).
| $ {Q_{{\text{true}}}} = {R_i} + \gamma \max {\bar Q_e}({O_i}) . $ | (26) |
Qe and
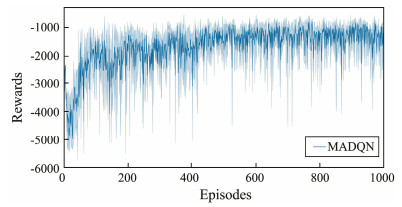
This section presents the simulation results. The COLOS-MADQN path planning framework was trained for 1000 episodes, and the simulation settings are detailed in Table 3. The episode rewards are shown in Fig.5, and the best performing policy, as determined by the episode reward, is selected for further validation. The validation simulation comprises five episodes, and a trained path planner is used.
|
|
Table 3 Simulation parameters |
|
Fig. 5 Episode rewards of training. |
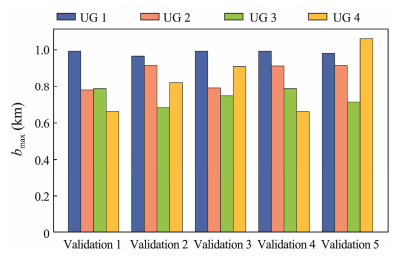
The results of Fig.6 show that the maximum b* of all cases is lower than 1.1 km. The low level of maximum b* indicates that the proposed COLOS can effectively guide the paths of UGs to achieve coverage to the edges of interest. If a highly strict Γ1 is provided to achieve high-accuracy coverage at the edges, according to Eq. (17), decreasing the value of Δw or narrowing the range of ψd will result in an aggressive heading adjustment strategy. Consequently, such an aggressive strategy will cause frequent path oscillations. Future work will focus on the further tradeoff regarding Γ1, maximum b*, and path oscillations.
|
Fig. 6 Maximum biases of the planned path considering the edge. |
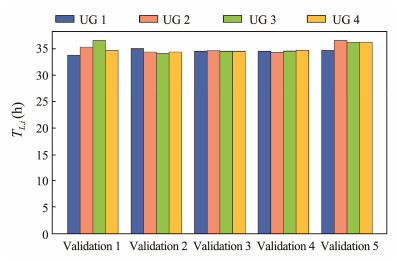
The difference in TL, i is demonstrated in Fig.7. The detailed differences are listed in Table 4. Validation 3 has the best performance on the path planning objective defined in Eq. (1). The worst case 1 still guarantees that the difference between the maximum TL, i and the minimum TL, i is within 3 h. The results indicate that the proposed method introduces at least a 56.735% improvement in the SLR metrics compared to the stochastic cooperative policies. The difference in the performance of the trained policies is attributed to the selection of the minor probability actions determined by the ε-greedy principle. The entire path planning process is a sequential decision process; thus, small differences will impact the overall results. Future research will focus on examining the uncertainty in the adaptability of co-operators despite new environments and the impact on the quality of cooperating results.
|
Fig. 7 Statistic results of sampling time of UGs in the fleet. |
|
|
Table 4 Validation results of SLR |
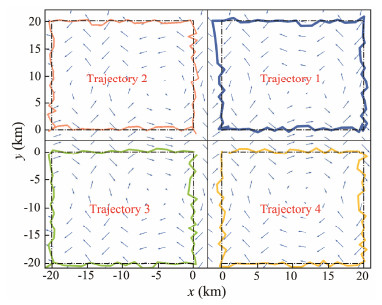
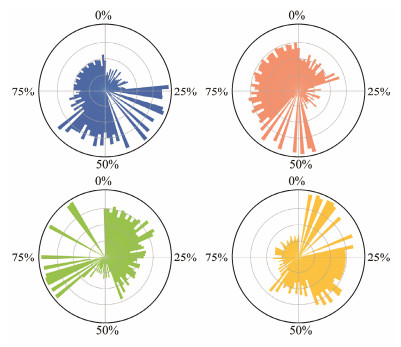
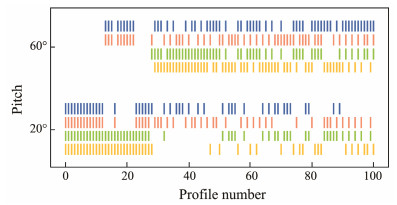
For validation 3, Figs.8 – 10 present the sampling paths and relevant target signals of ψ and θ. The blue arrows in Fig.8 represent the spatially varying currents. All expected sampling directions are counterclockwise. The planned navigation headings are presented in Fig.9. The target heading illustration adopts a polar form, where the radius represents the value of the heading signal, while the angle of the coordinate depicts the progress of the entire navigation. Furthermore, the radii are divided into 90-degree increments. The center of the circle indicates that the planned target heading angle is 0°, while the outermost circle indicates a heading angle of 360°. Taking the first glider as an example, the headings to the first sampling edge are around 90°, which drives the glider to move eastward. The target headings then point to 360° (equivalent to 0°), the glider moves northward and switches to cover the second sampling edges, and other cases have similar analyses. Fig.10 presents the event plot of the pitches considering the profile numbers, which can be set as the attitude operating schedule in longitudinal manipulation. A pitch of 20° generally produces a large horizontal gliding speed, which benefits the acceleration of the sampling progress. Otherwise, a pitch of 60° will decelerate the progress.
|
Fig. 8 Simulated sampling paths of UG fleet. |
|
Fig. 9 Planned heading angles of the fleet. |
|
Fig. 10 Planed pitch angles of the fleet. |
The optimization objective of CSPP-SLR provided in Eq. (15) can be solved by metaheuristic approaches. Simulated annealing (SA) and genetic algorithm (GA) are selected as the comparison methods in this work to examine the effectiveness of the proposed methods. All the comparison methods adopt the same action-to-actuation relationship listed in Table 2. The reciprocal of sampling progress Pgk, i is used to determine the coding length of candidate solutions. The settings of the SA algorithm are as follows. The initial temperature is 800, while the terminated temperature is 0.001. The length of the Markov chain is 5, and the decay scale is set as 0.9. The settings of the GA are as follows. The crossover rate is 0.4, while the mutation rate is 0.5. The population size is set as 5. The maximum iteration time was fixed at 100. Three comparison scenarios are tested, and the settings can be concluded as follows. Scenario 1 compared the optimizing results of SA and GA to the current work. The lengths of the sampling edge Ns, iNs+1, i are set as 20 km in scenarios 1 and 2, while the length is set as 40 km in scenario 3. The current settings remain the same between scenarios 1 and 3, with the formation of 0.1sin(X) m s−1 in the eastern direction and 0.1sin(Y) m s−1 in the northern direction. Scenario 2 shows the use of constant currents of 0.2 and 0.15 m s−1 in the eastern and northern directions, respectively. The comparison results are listed in Table 5, which presents the best results achieved in the optimization of each method. The max(b*) metric is also illustrated to manifest the sampling effect. Furthermore, the runtime of the comparison methods is presented to examine their computational efficiency. The SLR metrics in the proposed methods infer the action directly from the trained algorithm, and the 100-episode runtime is summarized for comparison.
|
|
Table 5 Comparisons with metaheuristic optimizations |
The comparison results revealed that the proposed methods achieve the best performance on SLR metrics in scenario 1 and on max(b*) metric in scenario 3. However, the optimization results of the proposed method are close to the best in the remaining cases. Moreover, the proposed methods completed the optimization with minimum runtime in all three scenarios. The inference using the trained reinforcement learning algorithm avoids the required repetitive optimization when faced with similar optimization tasks, which reduces the runtime of the CSPP-SLR task.
5 ConclusionsA cooperative sampling path planning framework for a UG fleet with SLR is proposed in this paper. The COLOS modification addresses the insufficiency of basic LOS in generating an adequate target heading when navigating through paths with different orientations. In the numerical simulation, COLOS effectively guides the UGs to cover their assigned sampling edges in the specific mesh. Additionally, the MADQN algorithm merges the multi-glider status and coordinates their navigation, demonstrating its potential in guiding and controlling fleets of robots. The proposed MADQN algorithm coordinates each UG in the fleet to satisfy the SLR metric based on simulation results. Compared with metaheuristic solutions, the proposed method achieves improved computation efficiency. This work provides a reference for collaborative glider sampling, reducing the risk of glider recovery in sea trials.
AcknowledgementsThis work is supported by the National Natural Science Foundation of China (No. 51909252), and the Fundamental Research Funds for the Central Universities (No. 2020610 04). This work is also partly supported by the China Scholar Council.
Bae H., Kim G., Kim J., Qian D., Lee S.. 2019. Multirobot path planning method using reinforcement learning. Applied Sciences, 9: 3057. DOI:10.3390/app9153057 (  0) 0) |
Ban T. W.. 2020. An autonomous transmission scheme using dueling DQN for D2D communication networks. IEEE Transactions on Vehicular Technology, 69: 16348-16352. DOI:10.1109/TVT.2020.3041458 (  0) 0) |
Chen M., Zhu D.. 2020. Optimal time-consuming path planning for autonomous underwater vehicles based on a dynamic neural network model in ocean current environments. IEEE Transactions on Vehicular Technology, 69: 14401-14412. DOI:10.1109/TVT.2020.3034628 (  0) 0) |
Claustre, H., Beguery, L., and Pla, P., 2014. SeaExplorer glider breaks two world records multisensor UUV achieves global milestones for endurance, distance. In: Sea Technology. Compass Publications Inc., Arlington, 1-3.
(  0) 0) |
Fu J., Poletti M., Liu M., Iovene E., Su H., Ferrigno G., et al. 2022. Teleoperation control of an underactuated bionic hand: Comparison between wearable and vision-tracking-based methods. Robotics, 11: 61. DOI:10.3390/robotics11030061 (  0) 0) |
Gao Z., Guo G.. 2019. Velocity free leader-follower formation control for autonomous underwater vehicles with line-of-sight range and angle constraints. Information Sciences, 486: 359-378. DOI:10.1016/j.ins.2019.02.050 (  0) 0) |
Han G., Zhou Z., Zhang T., Wang H., Liu L., Peng Y., et al. 2020. Ant-colony-based complete-coverage path-planning algorithm for underwater gliders in ocean areas with thermoclines. IEEE Transactions on Vehicular Technology, 69: 8959-8971. DOI:10.1109/TVT.2020.2998137 (  0) 0) |
Kan L., Zhang Y., Fan H., Yang W., Chen Z.. 2008. Matlab-based simulation of buoyancy-driven underwater glider motion. Journal of Ocean University of China, 7: 113-118. DOI:10.1007/s11802-008-0113-2 (  0) 0) |
Lekkas A. M., Fossen T. I.. 2013. Line-of-sight guidance for path following of marine vehicles. Advanced in Marine Robotics, 5: 63-92. (  0) 0) |
Li S., Zhang F., Wang S., Wang Y., Yang S.. 2020. Constructing the three-dimensional structure of an anticyclonic eddy with the optimal configuration of an underwater glider network. Applied Ocean Research, 95: 101893. DOI:10.1016/j.apor.2019.101893 (  0) 0) |
Liu Z., Chen X., Yu J., Xu D., Sun C.. 2019. Kuroshio intrusion into the South China Sea with an anticyclonic eddy: Evidence from underwater glider observation. Journal of Oceanology and Limnology, 37: 1469-1480. DOI:10.1007/s00343-019-8290-y (  0) 0) |
Petritoli E., Leccese F.. 2018. High accuracy attitude and navigation system for an autonomous underwater vehicle (AUV). Acta Imeko, 7(2): 3-9. DOI:10.21014/acta_imeko.v7i2.535 (  0) 0) |
Rudnick D. L., Davis R. E., Sherman J. T.. 2016. Spray underwater glider operations. Journal of Atmospheric and Oceanic Technology, 33: 1113-1122. DOI:10.1175/JTECH-D-15-0252.1 (  0) 0) |
Rudnick D. L., Sherman J. T., Wu A. P.. 2018. Depth-average velocity from spray underwater gliders. Journal of Atmospheric and Oceanic Technology, 35: 1665-1673. DOI:10.1175/JTECH-D-17-0200.1 (  0) 0) |
Sang H., Zhou Y., Sun X., Yang S.. 2018. Heading tracking control with an adaptive hybrid control for under actuated underwater glider. ISA Transactions, 80: 554-563. DOI:10.1016/j.isatra.2018.06.012 (  0) 0) |
Sarda E. I., Dhanak M. R.. 2017. A USV-based automated launch and recovery system for AUVs. IEEE Journal of Oceanic Engineering, 42: 37-55. (  0) 0) |
Shi M., Cheng Y., Rong B., Zhao W., Yao Z., Yu C.. 2022. Research on vibration suppression and trajectory tracking control strategy of a flexible link manipulator. Applied Mathematical Modelling, 110: 78-98. DOI:10.1016/j.apm.2022.05.030 (  0) 0) |
Shih C. C., Horng M. F., Pan T. S., Pan J. S., Chen C. Y.. 2017. A genetic-based effective approach to path-planning of autonomous underwater glider with upstream-current avoidance in variable oceans. Soft Computing, 21: 5369-5386. DOI:10.1007/s00500-016-2122-1 (  0) 0) |
Wang P., Wang D., Zhang X., Li X., Peng T., Lu H., et al. 2020. Numerical and experimental study on the maneuverability of an active propeller control based wave glider. Applied Ocean Research, 104: 102369. DOI:10.1016/j.apor.2020.102369 (  0) 0) |
Wu H., Niu W., Wang S., Yan S.. 2021. An analysis method and a compensation strategy of motion accuracy for underwater glider considering uncertain current. Ocean Engineering, 226: 108877. DOI:10.1016/j.oceaneng.2021.108877 (  0) 0) |
Yao P., Qi S.. 2019. Obstacle-avoiding path planning for multiple autonomous underwater vehicles with simultaneous arrival. Science China Technological Sciences, 62: 121-132. DOI:10.1007/s11431-017-9198-6 (  0) 0) |
Zang W., Yao P., Song D.. 2022a. Standoff tracking control of underwater glider to moving target. Applied Mathematical Modelling, 102: 1-20. DOI:10.1016/j.apm.2021.09.011 (  0) 0) |
Zang W., Yao P., Song D.. 2022b. Underwater gliders linear trajectory tracking: The experience breeding actor-critic approach. ISA Transactions, 129: 415-423. DOI:10.1016/j.isatra.2021.12.029 (  0) 0) |
Zhuang Y., Huang H., Sharma S., Xu D., Zhang Q.. 2019. Cooperative path planning of multiple autonomous underwater vehicles operating in dynamic ocean environment. ISA Transactions, 94: 174-186. DOI:10.1016/j.isatra.2019.04.012 (  0) 0) |
 2023, Vol. 22


