2) Department of Physics and Electronic Science, Weifang University, Weifang 261061, China
Polycyclic aromatic hydrocarbons (PAHs) are known as persistent organic pollutants, which widely exist in the ocean. It had been demonstrated by animal experiments that PAHs have a variety of toxic, such as hematological toxicity, reproductive and developmental toxicity and immune toxicity, and they have carcinogenic, teratogenic and mutagenic effects even at very low concentration (Burchiel and Luster, 2001; Ding et al., 2005; Kim et al., 2008).
Since 1974, surface-enhanced Raman spectroscopy (SERS) as a highly specific and sensitive technique has attracted more and more attention. It can provide vibrational spectroscopic fingerprints and it can be developed into a rapid and in situ detection method (Fleischmann et al., 1974; Kubackova et al., 2014). In the last ten years, the use of SERS in the detection of PAHs has been demonstrated by lots of studies. Heinz-Detlef. Kronfeldt et al. developed a kind of SERS sensor based on calixarene-functionalized silver nanoparticles embedded in a sol-gel matrix and applied it to the in-situ detection of PAHs in the seawater (Kwon et al., 2011; Pfannkuche et al., 2012). Mohamed Dribek's group prepared the gold nanoparticles (AuNPs) labeled by 5, 5'-dithiobis (succinimidyl-2-nitrobenzoate) (DSNB) and functionalized with monoclonal antibodies anti-BaP and used it as substrate to detect benzo[a]pyrene (BaP) in seawater (Dribek et al., 2014). Jingjing Du reported a kind of magnetic SERS substrate which was made of AuNPs grafted on Fe3O4. This magnetic substrate had been applied to detect the 16 EPA priority PAHs, and the limits of detection (LODs) achieved by this method were between 5×10⁻⁹ to 1×10⁻⁷ mol L-1 (Du et al., 2016).
Glycidyl methacrylate-ethylene dimethacrylate (GMA-EDMA) is hydrophobic polymer material with rich porous and it can provide a large active surface to metal nanoparticles. Metal nanoparticles fixed on the GMA-EDMA material will produce more SERS 'hot spots', which is of benefit to improve the enhancement effect. Kumacheva et al. demonstrated the use of SERS in detection of multiple analytes on the surface of polymer-based porous hybrid materials (PHM) coated with gold nanorods (Lee et al., 2011). In the work of Yiping Du, GMA-EDMA polymer decorated by AuNPs was developed as the SERS substrate. Anthracene, phenanthrene and pyrene were then detected and their LODs were 9.3×10⁻⁸ mol L-1, 4.5 × 10⁻⁷ mol L-1 and 1.1×10⁻⁷ mol L-1 respectively (Wang et al., 2015).
The concentrations of PAHs in the environment are generally very low, which makes the sensitivity of SERS substrate essential. However, the sensitivities of SERS substrates in the previous studies are not good enough so far to detect PAHs in the environment. A lot of studies (Wang et al., 2015; Shi et al., 2015; Du et al., 2016) show that a large number of hot spots can be produced in 3-D SERS-active substrate, which significantly improves the enhancement. In the present work, GMA-EDMA porous material was prepared, and then smashed and loaded into syringe filter. Combined with AuNPs (size 57 nm and pH 13), the 3-D SERS-active substrate was fabricated. The characteristics of this kind of substrate, such as surface topography, SERS enhancement effect and detection repeatability were studied. Four kinds of PAHs, i.e., phenanthrene, pyrene, benzo(a)pyrene, and benzo(k)fluoranthene, in different concentrations and their mixture were detected using this 3-D SERS-active substrate, and their LODs were obtained. To further test the performance, the detection results with SERS using this 3-D SERS-active substrate were also compared with that of fluorescence spectroscopy.
2 Experiment 2.1 Chemical and MaterialsAll the reagents were used without further purification. Chloroauric acid (HAuCl4·4H2O), trisodium citrate, methanol, absolute ethyl alcohol, dodecanol, cyclohexanol were purchased from sinopharm (Shanghai, China). Azobisisobutyronitrile (AIBN) was got from Damao Chemical Reagent Co. (Tianjing, China). Glycidyl methacrylate (GMA), ethylene dimethacrylate (EDMA) were obtained from Aladdin Chemical Industry Co. (Shanghai, China), and all the PAHs, phenanthrene, pyrene, benzo(a)pyrene, benzo(k)fluoranthene were from Sigma-Aldrich (USA).
In the process of preparing PAH (phenanthrene, pyrene, benzo(a)pyrene, benzo(k)fluoranthene) samples, solid PAHs were dissolved in methanol first and their standard solution concentrations were 5×10⁻⁵, 4×10⁻⁵, 4×10⁻⁵ and 2×10⁻⁵ mol L-1, respectively. And then the standard solutions were diluted with the distilled water to different concentrations.
2.2 InstrumentsThe SERS spectra were obtained using a portable Raman spectrometer (QE65000, Ocean Optics), which was equipped with a grating of 1200 g mm-1 allowing a 6 cm-1 spectral resolution. A narrow line-width laser emitting at 785 nm (SFOLT Co., Ltd) was used as the light source and the laser power arriving at sample was 30 mW. The structure of this portable Raman system was introduced in our previous work (Shi et al., 2015).
The fluorescence spectra were detected by the fluorescence spectrometer (RF-5301PC series) produced by Shimadzu Corporation. The RF-5301PC was based on a highly efficient blazing holographic grating of 1300 g mm-1 and 150 mW xenon lamp.
2.2.1 Preparation of 3-D SERS substrateGold colloid solution: The gold colloid solution was prepared following a procedure of Frens (1973). It was synthesized by reducing chloroauric acid with sodium citrate as a reductant. The colour of this original gold colloid solution was purple red and its pH was 6. Based on the results of our previous study, the average diameter of AuNPs was about 57 nm, and it had impressive enhancement for Raman signal of PAHs by changing its pH value to 13 (Shi et al., 2015).
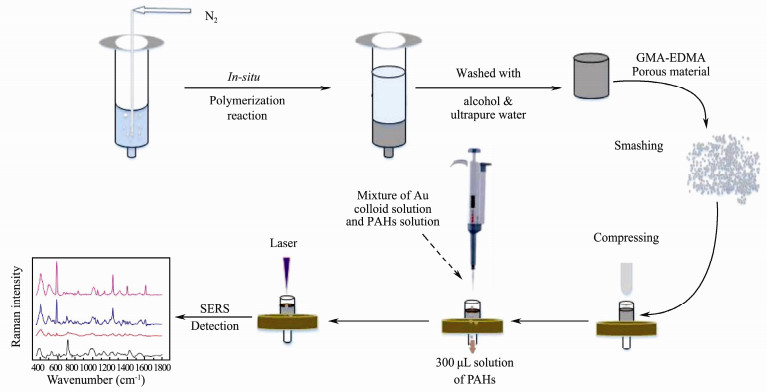
GMA-EDMA porous material: The preparation of GMA-EDMA porous material was based on Svec's method (Svec and Fréchet, 1992). The monomers (GMA), cross-linking agent (EDMA), porogenic solvents (dodecanol, cyclohexanol) and thermal initiator (AIBN) were mixed in a certain proportion (VGMA:VEDMA:Vcyclohexanol: Vdodecanol=15:15:49:21), and then the mixture was purged with nitrogen for several minutes. The reaction proceeded at 65℃ for 12 h. After polymerization, the material was washed with alcohol and ultrapure water to remove residue porogen. In the end, a white cylinderical porous material was obtained. To make the SERS substrate more sensitive, economic and convenient, the GMA-EDMA porous material was dried for 3 h at 20℃ in the thermostatic drying chamber and then it was smashed and the average size of the smashed GMA-EDMA porous material was 15.93 μm. The smashed porous material was then loaded into syringe filter whose membrane pore size is 0.22 μm with optimal force (20 N).
2.2.2 Methods of SERS detectionSERS detection using gold colloid solution: The mixture of PAH solution and gold colloid solution (V: V=3:1) was injected into the quartz cells, then NaOH solution was fed into it to adjust the pH to 13. Five measurements for each sample were made.
SERS detection using 3-D SERS substrate: PAH solution, gold colloid solution and NaOH solution were mixed evenly. The pH of mixture was 13. Then, 300 µL mixture was slowly added onto the surface of syringe filter loaded with smashed GMA-EDMA porous material with a pipettor. When this procedure was finished, the 3-D SERS-active substrate was fabricated and the SERS spectra could be detected. The flow chart of detection is shown in Fig. 1.
|
Fig. 1 Schematic diagram of three-dimensional SERS substrates preparation and SERS detection. |
SERS detection using cyclindrical GMA-EDMA porous material: PAH solution, gold colloid solution and NaOH solution were mixed evenly. The pH of mixture was 13. Then 6.4 mL mixture was added onto the surface of cyclindrical GMA-EDMA porous material and the SERS spectra were measured. For comparison, the mixture of PAH solution and gold colloid solution (pH 6) was also added onto the surface of syringe filter loaded with smashed GMA-EDMA porous material and the SERS spectra were measured. Their SERS spectra were compared with that of 3-D SERS-active substrate.
SERS detection of blank 3-D SERS substrate: 300 µL mixture mixed by pH 13 gold colloid solution and an equal amount of ultrapure water instead of PAH was added onto the surface of the SERS substrate based on syringe filter and smashed GMA-EDMA material. And then the Raman spectra of blank 3-D SERS substrate were measured.
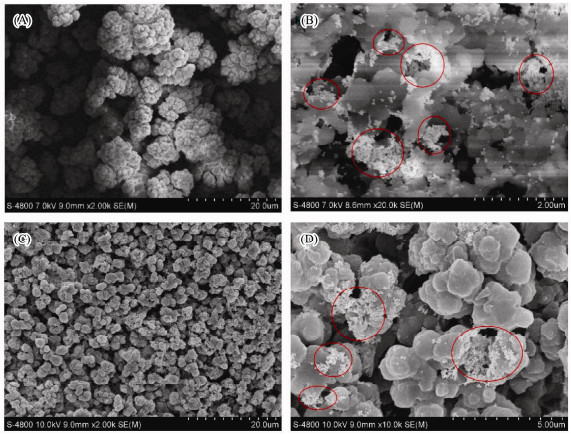
3 Results and Discussion 3.1 Characterization of 3-D SERS Substrate Based on GMA-EDMA Porous Material and pH 13 AuNPsThe GMA-EDMA porous material has a rich porous morphological structure which provides the prerequisite to form 3-D SERS substrate. The SEM image of the blank GMA-EDMA monolithic column is displayed in Fig. 2A. From the image, it can be seen that the porous structure of the GMA-EDMA material is connected by small polymer particles, the pore size being of about micron dimension. For more details about the 3-D SERS substrates, the image of the cylindrical GMA-EDMA porous material absorbed pH 13 AuNPs is shown in Fig. 2B. The AuNPs with huge aggregation are marked in the red circle and the porous material can be seen as a 3-D carrier. It is demonstrated that the AuNPs are immobilized into the pore of the porous material. Compared with cylindrical GMA-EDMA porous material, the smashed GMA-EDMA porous material loaded into syringe filter is more uniform (Fig. 2C), which will be of benefit to collect more SERS signals. There are more AuNPs aggregations on the surface of GMA-EDMA monolithic column than smashed one since more AuNPs were dropped onto the surface of GMA-EDMA monolithic column.
|
Fig. 2 SEM images of blank GMA-EDMA porous material (A), GMA-EDMA porous material adsorbed pH 13 AuNPs (B), syringe filter loaded with smashed GMA-EDMA porous material (C) and 3-D SERS substrate based on syringe filter loaded with smashed GMA-EDMA porous material adsorbed pH 13 AuNPs (D). |
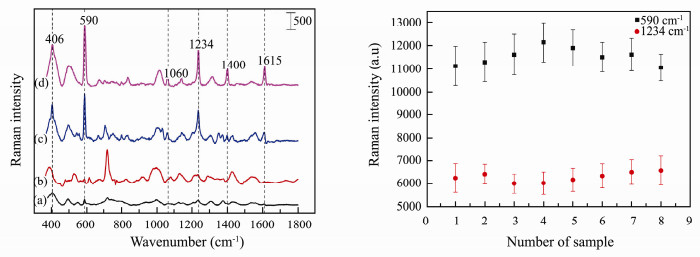
In order to evaluate the enhancement effect provided by 3-D SERS substrate based on syringe filter and smashed GMA-EDMA porous material, four SERS spectra of 1×10⁻⁸ mol L-1 pyrene with different substrates were measured following the method introduced previously. As can be seen (Figs. 3 (left) (b) (d)), the Raman signal of 1×10⁻⁸ mol L-1 pyrene is very weak when only natural AuNPs were dropped onto the syringe filter loaded with smashed GMA-EDMA material while it is about 12 times better when pH 13 AuNPs replaced natural AuNPs. It demonstrates that the pH value is very important for the pyrene detection since the ions of OH- promote the aggregation of AuNPs and also make the molecules of pyrene easier to connect with AuNPs (Hu et al., 2000; Li et al., 2009; Shi et al., 2015). And also, the GMA-EDMA porous material is also crucial for the 3-D SERS substrate, the enhancement effect of the substrate based on pH 13 AuNPs and cylindrical GMA-EDMA porous material (Fig. 3 (left) (c)) is about 8 times better than that of pH 13 gold colloid solution (Fig. 3 (left) (a)). Especially, the 3-D SERS substrate based on pH 13 AuNPs, the syringe filter and GMA-EDMA porous material has superior enhancement effect (Fig. 3 (left) (d)). The possible reason is that the controlled 3-D porous structure of this GMA-EDMA material can adjust the distribution of AuNPs and increase their aggregations. The GMA-EDMA porous material makes the gap between AuNPs decrease obviously and more 'hot spots' are generated (Lin et al., 2009; Jiao et al., 2015). The syringe filter loaded with smashed GMA-EDMA porous material further optimizes the distribution of AuNPs and makes the enhancement better.
|
Fig. 3 Panel left: SERS spectra of 1×10⁻⁸ mol L-1 pyrene on different SERS substrates: gold colloid solution with pH 13 (a); syringe filter loaded with smashed GMA-EDMA material absorbed natural AuNPs (b); cylindrical GMA-EDMA porous material absorbed pH 13 AuNPs (c); syringe filter loaded with smashed GMA-EDMA material absorbed pH 13 AuNPs (d). Panel right: repeatability of different optimal 3-D SERS substrates using 1×10⁻⁷ mol L-1 pyrene as probe molecule. |
To test the repeatability, the SERS spectra of 1 × 10⁻⁷ mol L-1 pyrene acquired from eight substrates as well as the relative standard deviations (RSDs) resulting from five different positions in each substrate were obtained (Fig. 3 (right)). The intensities' RSDs of intra-substrate are from 5.72% to 8.66% at 590 cm-1 and from 4.18% to 6.28% at 1237 cm-1. The intensities' RSDs of inter-substrate are 3.69% at 590 cm-1 and 2.11% at 1237 cm-1 respectively. The RSDs of intra-substrate and inter-substrate are both small, which means this optimal 3-D substrate has good repeatability and is suitable for quantitative analysis. The shelf time of such SERS substrate was also studied, which is one week.
3.2 PAHs SERS DetectionThe SERS signal of PAHs were detected using the optimal 3-D SERS substrate, five measurements in different positions for each sample were made, and the laser power on the sample was 30 mW, the integration time was 10 s. The baselines of the original spectra were removed using Origin 8.1.
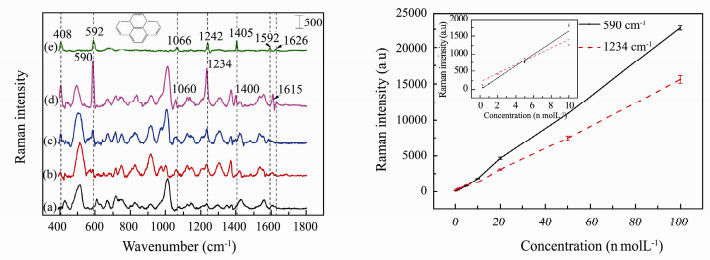
The SERS spectra of pyrene with concentrations ranging from 2 × 10⁻¹⁰ mol L-1 to 1 × 10⁻⁷ mol L-1 on optimal 3-D SERS substrates were measured. The typical SERS spectra and the Raman spectrum of solid pyrene are shown in Fig. 4 (left). Through comparing the Raman spectrum of blank 3-D SERS substrates (Fig. 4 (left) (a)) and solid pyrene (Fig. 4 (left) (e)), it can be seen that there is no characteristic peak overlapped, which means the 3-D SERS substrate has no influence on the detection. Six Raman peaks of pyrene in the aqueous can be detected at 406 (C-C-C bending), 590 (C-C-C bending), 1060 (C-C stretching, C-H bending), 1234 (C-C stretching), 1400 (C-C stretching) and 1615 cm-1 (Shinohara et al., 1998; Frank et al., 2007). It would be specially mentioned that the SERS band at 1615 cm-1 of pyrene solution appeared instead of 1592 and 1626 cm-1 from C-C stretching of solid pyrene. The possible explanation is that the photochemistry reaction happened when the pyrene molecules adsorbed on AuNPs are radiated by laser (Olson et al., 2004; Costa et al., 2006). When the concentration of pyrene solution decreases to 3 × 10⁻¹⁰ mol L-1, the Raman peaks at 590 and 1234 cm-1 can still be observed.
|
Fig. 4 Panel left: Raman and SERS spectra of pyrene. Raman spectrum of blank 3-D SERS substrate (a); SERS spectrum of 3×10⁻¹⁰ mol L-1 (b); 1×10⁻⁹ mol L-1 (c); 1×10⁻⁸ mol L-1 (d) of pyrene; Raman spectrum of solid pyrene (e). Panel right: dependence of Raman intensity at 590 cm-1 and 1234 cm-1 on concentration of pyrene (The inset is the linear relationship in low concentration). The error bars are standard deviations resulting from five different positions for each sample. |
Comparing with Raman spectrum of solid pyrene, there are wavenumbers shifts with a maximum of 11 cm-1. The possible reason is that there are chemical bonding effects between pyrene molecules and AuNPs, which causes the charge transfer between them (Costa et al., 2006). In order to quantitatively analyze pyrene in water, the dependence of the Raman intensities of 590 and 1234 cm-1 band on concentrations is plotted in Fig. 4 (right), the error bars being standard deviations resulted from five different positions for each sample. A linear relationship is found in low concentration range between 3 × 10⁻¹⁰ and 1 × 10⁻⁸ mol L-1 (shown in the inset of Fig. 4 (right)), and its linear equations and correlation coefficients are shown in Table 1. It shows that there are high correlations between Raman intensities and concentrations, which can be used for quantitative analysis. The LOD of pyrene is 2.1 × 10⁻¹⁰ mol L-1 as calculated by the formula below using the most intensive Raman peak at 590 cm-1.
|
|
Table 1 Regression equations between Raman intensities and concentrations of Pyrene (3×10⁻¹⁰-1×10⁻⁸ mol L-1) and Benzo(a)pyrene (1×10⁻⁹-2×10⁻⁸ mol L-1) |
| $ LOD = \frac{{3\sigma }}{k}, $ |
where σ means the standard deviation of the detection for blank SERS substrate for 10 times. Another value k represents the slope in the linear fitting of the equation (Thomsen et al., 2003).
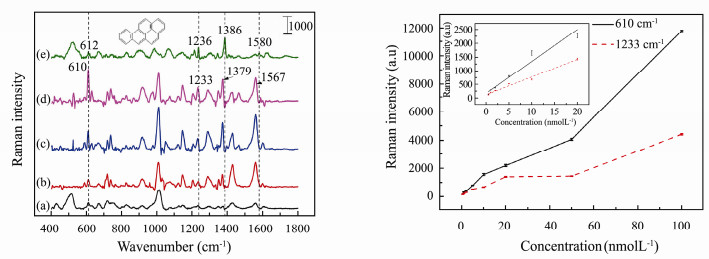
Fig. 5 (left) shows the SERS spectra of benzo(a)pyrene at different concentrations, the Raman spectrum of solid benzo(a)pyrene and blank SERS substrate being also exhibited as a comparison. Since benzo(a)pyrene has the strong fluorescence, in the aqueous only four Raman peaks can be recognized obviously from the high fluorescence background. These four bands of benzo(a)pyrene in the aqueous are located at 610 (C-H bending), 1233 (C-H bending), 1379 (C-H bending, C-C-C stretching) and 1567 cm-1 (C-H bending, C-C stretching), respectively (Onchoke et al., 2006; Chiang et al., 2015).
|
Fig. 5 Panel left: Raman and SERS spectra of benzo(a)pyrene. Raman spectrum of blank 3-D substrate (a); SERS spectrum of 1×10⁻⁹ mol L-1 (b); 1×10⁻⁸ mol L-1 (c); 2×10⁻⁸ mol L-1 (d) of benzo(a)pyrene; Raman spectrum of solid benzo(a)pyrene (e). Panel right: dependence of Raman intensity at 610 cm-1 and 1233 cm-1 on concentration of benzo(a)pyrene. The inset is the linear realationship in low concentration. The error bars are standard deviations resulted from five different positions for each sample. |
As can be seen in Fig. 5 (left), although the Raman signal of benzo(a)pyrene at 1×10⁻⁹ mol L-1 is already week, the peaks at 610 and 1233 cm-1 still can be distinguished clearly. The dependence of Raman intensities at 610 and 1233 cm-1 on concentrations within the range from 1 × 10⁻⁹ to 1 × 10⁻⁸ mol L-1 are presented in Fig. 5. For the quantitative analysis of benzo(a)pyrene in water, the linear fitting curve between Raman intensities and concentrations (under 2 × 10⁻⁸ mol L-1) was obtained and is shown in the inset of Fig. 5 (right), and its linear equations and correlation coefficients are exhibited in Table 1. The LOD of benzo-(a)pyrene is calculated to be 3.8 × 10⁻¹⁰ mol L-1 at 610 cm-1.
In this work, another two kinds of PAHs (phenanthrene, benzo(k)fluoranthene) were detected and analyzed under the same procedure, they have the similar properties with pyrene and benzo(a)pyrene. Their limits of quantity (LOQs) and limits of detection (LODs) for all these four PAHs are summarized in Table 2. It can be seen that all of them reached the detection level of pmol L-1.
|
|
Table 2 LOQs and LODs of four PAHs |
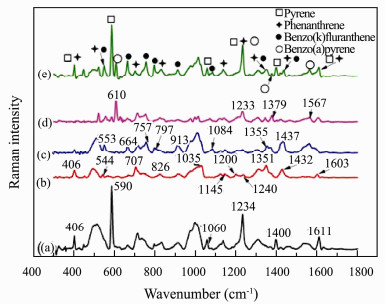
The SERS spectrum of a mixture of these four PAHs (Fig. 6(e)) was also measured. Figs. 6(a), (b), (c), (d) and (e) are the SERS spectra of 1 × 10⁻⁸ mol L-1 pyrene, 1 × 10⁻⁸ mol L-1 phenanthrene, 1 × 10⁻⁸ mol L-1 benzo(k)fluoranthene, 1 × 10⁻⁸ mol L-1 benzo(a)pyrene and their mixture, respectively. As shown in Fig. 6(e), all these four PAHs can be distinguished, although some Raman bands (around 406, 553, 1233, 1355, 1437 and 1611 cm-1) overlap slightly. So for the spectral resolution, this compact field-based Raman spectrometer is good enough for the field detection. It also shows that most Raman intensities in the SERS spectrum of the PAHs mixture decrease comparing with that of pure PAH since there are competitive adsorption among PAHs on the AuNPs. This phenomenon means that the quantitative analysis of the PAHs mixture is a big challenge and so a better quantitative analysis method is needed.
|
Fig. 6 SERS spectra of 1×10⁻⁸ mol L-1 pyrene (a), 1×10⁻⁸ mol L-1 phenanthrene (b), 1×10⁻⁸ mol L-1 benzo(k)fluoranthene (c), 1×10⁻⁸ mol L-1 benzo(a)pyrene (d) and their mixture (e). |
The LODs of phenanthrane and pyrene of 3-D SERS substrate in the present work are 8.3×10⁻¹⁰ mol L-1 and 2.1×10⁻¹⁰ mol L-1 while they are 4.5×10⁻⁷ mol L-1 and 1.1×10⁻⁷ mol L-1 in the literature (Wang et al., 2015). This indicates that the enhancement effect of this optimal 3-D SERS substrate based on GMA-EDMA porous material, syringe filter and pH 13 AuNPs is 3 orders of magnitude better than that of the substrate only based on porous material and natural AuNPs.
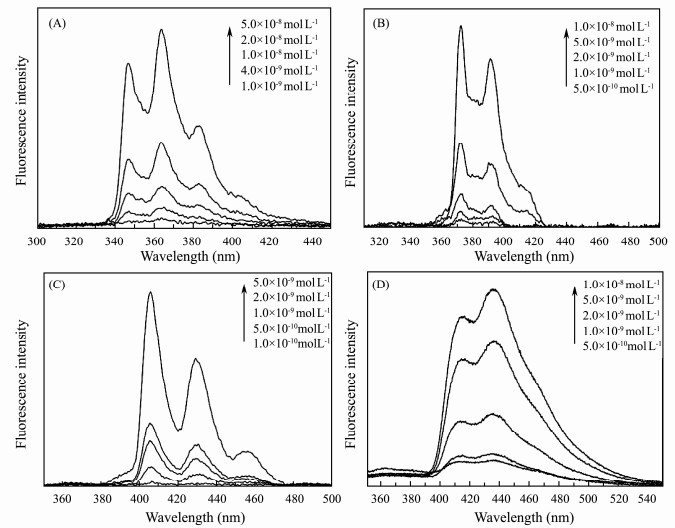
The fluorescence spectroscopy is widely used to investigate PAHs since PAHs always have high fluorescence quantum yields. Therefore, the fluorescence spectra of phenanthrene, pyrene, benzo(a)pyrene, benzo(k)fluoranthene in different concentrations showed in Fig. 7 were detected in order to evaluate the sensitivity of SERS technology using optimal 3-D SERS substrates. As can be seen, all these four kinds of PAHs have strong fluorescence. The biggest fluorescence peaks of them were λex/λem = 248/346 nm, λex/λem = 248/364 nm, λex/λem = 248/382 nm (phenanthrene); λex/λem = 270/372 nm, λex/λem = 270/391 nm (pyrene); λex/λem = 293/406 nm, λex/λem = 293/430 nm (benzo(a)pyrene) and λex/λem = 302/414 nm, λex/λem = 302/436 nm (benzo(k)fluoranthene), respectively.
|
Fig. 7 Fluorescence spectra of phenanthrene (A), pyrene (B), benzo(a)pyrene (C), benzo(k)fluoranthene (D) in different concentrations. |
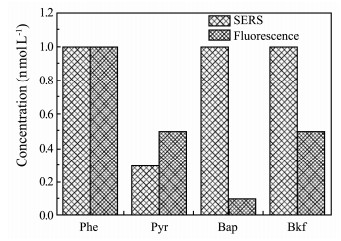
Analyzing the fluorescence spectroscopy, the minimum detectable concentrations of phenanthrene, pyrene, benzo(a)pyrene and benzo(k)fluoranthene are 1×10⁻⁹, 5×10⁻¹⁰, 1×10⁻¹⁰ and 5×10⁻¹⁰ mol L-1 respectively. The comparison of the minimum detectable concentration by these two methods is presented in Fig. 8. It indicates that the detection performance of the SERS technology even using the portable Raman system is very close to the method of fluorescence, except benzo(a)pyrene which has very strong fluorescence. Especially, the SERS detection result of pyrene is already better than that of fluorescence spectroscopy, which demonstrates that the SERS technology using optimal 3-D substrates can be compared to the traditional fluorescence spectroscopy technology in sensitivity and has big advantage over fluorescence spectroscopy in selectivity of PAHs distinguishing. Therefore, SERS technology would become an excellent candidate for the trace PAHs detection.
|
Fig. 8 Comparison of the detection results between SERS using 3-D substrate and fluorescence spectroscopy. |
In the present work, a SERS substrate with high sensitivity was first developed for the detection of trace-level PAHs. It was fabricated using syringe filter, smashed GMA-EDMA porous material and pH 13 AuNPs. This optimal 3-D SERS substrate had impressive enhancement effect which was about 8 times higher than that of pH 13 gold colloid solution and about 12 times higher than that of substrate using natural AuNPs and GMA-EDMA porous material, which means both pH 13 AuNPs and GMA-EDMA porous material are important for sensitivity of this 3-D SERS substrate. Good repeatability of the optimal 3-D substrate was obtained since the RSD on the same substrate is less than 8.66% and less than 3.69% on other different substrates. Four kinds of PAHs (phenanthrene, pyrene, benzo(a)pyrene, benzo(k)fluoranthene) were detected, and the good linear relationships between the SERS intensities and the concentrations in low concentration range were found. Even using the portable SERS detection system, the LODs of phenanthrene, pyrene, benzo(a)pyrene and benzo(k)fluoranthene were obtained at 8.3×10⁻¹⁰, 2.1×10⁻¹⁰, 3.8×10⁻¹⁰ and 1.7×10⁻¹⁰ mol L-1, respectively. All of them reached the level of p mol L-1. In addition, the sensitivity of SERS using the optimal 3-D SERS substrate for PAHs detection had already being close to that of the method of fluorescence spectroscopy. And the use of a syringe filter makes this 3-D SERS substrate economic and convenient besides sensitive. Therefore, this SERS detection method based on syringe filter, smashed GMA-EDMA porous material and pH 13 AuNPs can be used to realize the detection of trace-level PAHs in water, and has a great potential to monitor environment pollutants in the field.
AcknowledgementsThis research was supported by the National Natural Science Foundation of China (No. 41476081), the Major Research and Development Project in Shandong Province (Nos. 2016GSF115020, 2019GHY112027) and the Shandong Provincial Natural Science Foundation (No. ZR2015DM007).
Burchiel, S. W. and Luster, M. I., 2001. Signaling by environmental polycyclic aromatic hydrocarbons in human lymphocytes. Clinical Immunology, 98(1): 2-10. DOI:10.1006/clim.2000.4934 (  0) 0) |
Chiang, H. P., Mou, B., Li, K. P., Chiang, P., Wang, D., Lin, S. J. and Tse, W. S., 2015. FT-Raman, FT-IR and normal-mode analysis of carcinogenic polycyclic aromatic hydrocarbons. Part I-A density functional theory study of benzo (a) pyrene (BaP) and benzo (e) pyrene (BeP). Journal of Raman Spectroscopy, 32(1): 45-51. (  0) 0) |
Costa, J. C. S., SantoAna, A. C., Corio, P. and Temperini, M. L. A., 2006. Chemical analysis of polycyclic aromatic hydrocarbons by surface-enhanced Raman spectroscopy. Talanta, 70(5): 1011-1016. DOI:10.1016/j.talanta.2006.01.036 (  0) 0) |
Ding, Y. S., Trommel, J. S., Yan, X. J., Ashley, D. and Watson, C. H., 2005. Determination of 14 polycyclic aromatic hydrocarbons in mainstream smoke from domestic cigarettes. Environmental Science & Technology, 39(2): 471-478. DOI:10.1021/es048690k (  0) 0) |
Dribek, M., Rinnert, E., Colas, F., Crassous, M. P., Thioune, N., David, C., Chapelle, M. and Compére, C., 2014. Organometallic nanoprobe to enhance optical response on the polycyclic aromatic hydrocarbon benzo. Environmental Science and Pollution Research, 24(35): 27070-27076. DOI:10.1007/s11356-014-3384-8 (  0) 0) |
Du, J., Xu, J., Sun, Z. and Jing, C., 2016. Au nanoparticles grafted on Fe3O4 as effective SERS substrates for label-free detection of the 16 EPA priority polycyclic aromatic hydrocarbons. Analytica Chimica Acta, 915: 81-89. DOI:10.1016/j.aca.2016.02.009 (  0) 0) |
Fleischmann, M., Hendra, P. J. and McQuillan, A. J., 1974. Raman spectra of pyridine adsorbed at a silver electrode. Chemical Physics Letters, 26(2): 163-166. DOI:10.1016/0009-2614(74)85388-1 (  0) 0) |
Frank, O., Jehlička, J. and Edwards, H. G. M., 2007. Raman spectroscopy as tool for the characterization of thio-polyaromatic hydrocarbons in organic minerals. Spectrochimica Acta Part A-Molecular and Biomolecular Spectroscopy, 68(4): 1065-1069. DOI:10.1016/j.saa.2006.12.033 (  0) 0) |
Frens, G., 1973. Controlled nucleation for the regulation of the particle size in monodisperse gold suspensions. Nature Physical Science, 241(105): 20-22. DOI:10.1038/physci241020a0 (  0) 0) |
Hu, J., Fang, Q., Sheng, R. S., Xu, Z. S. and Zeng, Y. E., 2000. Surface-enhanced Raman spectroscopy of biliverdin. Acta Laser Biology Sinica, 9(3): 221-227. DOI:10.3969/j.issn.1007-7146.2000.03.016 (  0) 0) |
Jiao, X., Shen, S. and Shi, T., 2015. One-pot preparation of a novel monolith for high performance liquid chromatography applications. Journal of Chromatography B, 1007: 100-109. DOI:10.1016/j.jchromb.2015.10.028 (  0) 0) |
Kim, S. R., Halden, R. U. and Buckley, T. J., 2008. Polycyclic aromatic hydrocarbons in human milk of nonsmoking US women. Environmental Science & Technology, 42(7): 2663-2667. DOI:10.1021/es702275x (  0) 0) |
Kubackova, J., Fabriciova, G., Miskovsky, P., Jancura, D. and Sanchezcortes, S., 2014. Sensitive surface-enhanced raman spectroscopy (SERS) detection of organochlorine pesticides by alkyl dithiol-functionalized metal nanoparticles-induced plasmonic hot spots. Analytical Chemistry, 87(1): 663-669. DOI:10.1021/ac503672f (  0) 0) |
Kwon, Y. H., Kolomijeca, A., Sowoidnich, K., and Kronfeldt, H. D., 2011. High sensitivity calixarene SERS substrates for the continuous in-situ detection of PAHs in seawater. SPIE Defense, Security, and Sensing, Orlando, Florida, USA, IV, 525-529.
(  0) 0) |
Lee, A., Dubinsky, S., Tumarkin, E., Moulin, M., Beharry, A. A. and Kumacheva, E., 2011. Multifunctional hybrid polymer-based porous materials. Advanced Functional Materials, 21(11): 1959-1969. DOI:10.1002/adfm.201002453 (  0) 0) |
Li, D. F., Cao, B., Yang, G., Li, Z. W., Gao, S. Q., Zhou, M. M, Men, Z. W. and Zhang, X. Y., 2009. Effect of pH value in silver colloids system on surface-enhanced Raman scattering spectroscopy of crystal violet. The Journal of Light Scattering, 21(2): 132-135 (in Chinese with English abstract). DOI:10.13883/j.issn1004-5929.2009.02.006 (  0) 0) |
Lin, X. M., Cui, Y., Xu, Y. H., Ren, B. and Tian, Z. Q., 2009. Surface-enhanced Raman spectroscopy: Substrate-related issues. Analytical and Bioanalytical Chemistry, 394(7): 1729-1745. DOI:10.1007/s00216-009-2761-5 (  0) 0) |
Olson, L. G., Uibel, R. H. and Harris, J. M., 2004. C18-modified metal-colloid substrates for surface-enhanced Raman detection of trace-level polycyclic aromatic hydrocarbons in aqueous solution. Applied Spectrocopy, 58(12): 1394-1400. DOI:10.1366/0003702042641380 (  0) 0) |
Onchoke, K. K., Hadad, C. M. and Dutta, P. K., 2006. Structure and vibrational spectra of mononitrated benzo[a]pyrenes. The Journal of Physical Chemistry A, 110(1): 76-84. DOI:10.1021/jp054881d (  0) 0) |
Pfannkuche, J., Lubecki, L., Schmidt, H., Kowalewska, G. and Kronfeldt, H. D., 2012. The use of surface-enhanced Raman scattering (SERS) for detection of PAHs in the Gulf of Gdańsk (Baltic Sea). Marine Pollution Bulletin, 64(3): 614-626. DOI:10.1016/j.marpolbul.2011.12.008 (  0) 0) |
Shi, X. F., Liu, S., Han, X. H., Ma, J., Jiang, Y. C. and Yu, G. F., 2015. High-sensitivity surface-enhanced Raman scattering (SERS) substrate based on a gold colloid solution with a pH change for detection of trace-level polycyclic aromatic hydrocarbons in aqueous solution. Applied Spectroscopy, 69: 574-579. DOI:10.1366/14-07614R (  0) 0) |
Shinohara, H., Yamakita, Y. and Ohno, K., 1998. Raman spectra of polycyclic aromatic hydrocarbons. Comparison of calculated Raman intensity distributions with observed spectra for naphthalene, anthracene, pyrene, and perylene. Journal of Molecular Structure, 442(1-3): 221-234. DOI:10.1016/S0022-2860(97)00335-9 (  0) 0) |
Svec, F. and Fréchet, J. M. J., 1992. Continuous rods of macroporous polymer as high-performance liquid chromatography separation media. Analytical Chemistry, 64(7): 820-822. DOI:10.1021/ac00031a022 (  0) 0) |
Thomsen, V., Schatzlein, D. and Mercuro, D., 2003. Limits of detection in spectroscopy. Spectroscopy, 18(12): 112-114. (  0) 0) |
Wang, X., Hao, W., Zhang, H., Pan, Y., Kang, Y., Zhang, X., Zou, M., Tong, P. and Du, Y., 2015. Analysis of polycyclic aromatic hydrocarbons in water with gold nanoparticles decorated hydrophobic porous polymer as surface-enhanced Raman spectroscopy substrate. Spectrochimica Acta Part A: Molecular and Biomolecular Spectroscopy, 139: 214-221. DOI:10.1016/j.saa.2014.11.104 (  0) 0) |
 2019, Vol. 18


