2) Physical Oceanography Laboratory, Ocean University of China, Qingdao 266100, China;
3) Tianjin Key Laboratory for Oceanic Meteorology, Tianjin 300074, China;
4) Tianjin Institute of Meteorological Science, Tianjin 300074, China
The South China Sea is the largest marginal sea in the Western Pacific. The region has a tropical monsoon climate, with northeast winds prevailing in winter and southwest winds prevailing in summer. The Luzon Strait lies between Taiwan Island and Luzon Island and plays an important role in water transport and dynamic interactions between the South China Sea and the Western Pacific. The water transport between the Western Pacific and the South China Sea displays a 'sandwich structure' in the vertical direction (Chen and Huang, 1996; Qu, 2002; Yuan, 2002; Tian et al., 2006; Yuan et al., 2014a; Gan et al., 2016). The Western Pacific water enters the South China Sea from the surface and bottom layers and flows out of the South China Sea from the middle layer. The South China Sea circulation is cyclonic circulation in the upper and bottom layers and anticyclonic circulation in the middle layer. A stronger Luzon Strait Transport (LST) into the South China Sea would lead to an eastward brand dominant upper layer circulation pattern in summer. Instead, the northward branch dominant it (Zu et al., 2020). Kuroshio intrusion affect the circulation and water mass properties in the southern South China Sea through the western boundary current advection (Zu et al., 2019). The interannual variability in the surface and subsurface salinity levels in the South China Sea is affected by the intensity of the Kuroshio intrusion. Zeng et al. (2014) suggested that the surface water desalination in the South China Sea in 2012 was caused by a large freshwater input and the weakening of the Kuroshio intrusion. After 2012, the salinization of seawater above 150 m was mainly due to the decrease in evaporation and the increase in the Kuroshio intrusion (Zeng et al., 2018). Nan et al. (2016) found that the salinity of the South China Sea above a depth of 100 m decreased at a rate of −0.012 yr−1 from 1993 to 2012, and desalination was most obvious on the west side of the Luzon Strait; additionally, it was suggested that desalination was related to the weakening of the Kuroshio intrusion. Chen et al. (2019) found that the surface salinization of the entire South China Sea from 2016 to 2017 extended from the subsurface layer in the northeastern part of the South China Sea to the southwestern part of the South China Sea and believed that this was related to the intensified Kuroshio intrusion. In addition, the mesoscale eddies and circulations in the South China Sea are affected by the Kuroshio intrusion; when the Kuroshio current intrudes into the South China Sea, there is a maximum velocity layer between 40 – 70 m in the subsurface layer. The conversion of strong baroclinic pressure causes the mesoscale eddy in the northeastern South China Sea to become more active. This maximum velocity layer is a bridge connecting the Kuroshio and the mesoscale eddy in the South China Sea (Wang et al., 2020). Li et al. (2015) suggested that the water in the Western Pacific affects the South China Sea in the form of mesoscale eddies in summer, and in autumn, this water intrudes and affects the South China Sea in the form of land slope currents. Shu et al.(2016, 2019) and Liu et al. (2019) analyzed temperature and salinity data obtained by underwater gliders in the South China Sea and concluded that the captured anticyclonic eddies, with notably different from temperatures and salinities than the rest of the South China Sea, were associated with the Kuroshio. Additionally, water transport in the Luzon Strait can transmit the El Niño-Southern Oscillation (ENSO) signals to the South China Sea (Qu et al., 2004).
The Kuroshio is the northward branch of the North Equatorial Current (NEC) on the east side of Luzon Island. This current is characterized by strong flow velocities, large flows, a narrow flow range, high temperatures and high salinities and is one of the most important ocean currents in the world. As an important part of LST, the Kuroshio intrusion has an important impact on the South China Sea. The Kuroshio intrusion is affected by many factors, such as monsoons, sea surface pressure gradients, mesoscale eddies, β effects, sea surface temperature gradients, ENSO, Pacific Decadal Oscillation (PDO, and typhoons. Farris and Wimbush (1996) found that the Kuroshio can intrude into the South China Sea only when the southerly component of the ground wind stress is greater than 0.08 N m−2 and that local wind stress has an important influence on the path of the Kuroshio in the Luzon Strait. Yuan (2002) suggested that water transport in the Luzon Strait caused by monsoons only occurs at the surface, with westward movement in winter and eastward movement in summer. Kuehl and Sheremet (2009) also confirmed through laboratory experiments that the Ekman transport caused by wind stress determines the angle and flux of the Kuroshio intrusion into the South China Sea. Hsin et al. (2012) used a numerical model to quantify the effect of the East Asian monsoon on LSTs. The results indicated that the annual average LST at 120.75˚E is −4.0 ± 5.1 Sv and that the intrusion direction is westward. If the East Asian monsoon influence is excluded, the annual average LST is approximately 4 Sv, and the intrusion direction is eastward. However, some studies have indicated that the amount of water transport due to wind stress is small compared to that associated with the Kuroshio intrusion and that the pressure gradient caused by monsoons is most important for water transport in the Luzon Strait (Qu et al., 2004; Nan et al., 2013). The accumulation of seawater caused by the East Asian monsoon creates a sea surface pressure gradient between the Western Pacific and the South China Sea, which has an important impact on water transport via the Luzon Strait (Metzger and Hurlburt, 1996). In the Pacific Ocean from 20˚ – 25˚N, mesoscale eddies propagate westward, and up to 60% of the eddies in the Western Pacific that intrude into the South China Sea through the Kuroshio current (Zheng et al., 2011). When an eddy reaches the western boundary of the Pacific, it interacts with the western boundary current; the western boundary current blocks the westward propagation of the eddy, and the eddy changes the intensity and path of the western boundary current. The cyclonic eddies weaken the Kuroshio intrusion, and anticyclonic eddies enhance the Kuroshio intrusion (Lien et al., 2014). Lien et al. (2014) suggested that the intensity of the Kuroshio intrusion into the South China Sea is closely related to the local sea level anomaly (SLA) gradient. An anticyclonic eddy can increase the SLA gradient and enhance the Kuroshio intrusion into the South China Sea. Conversely, an cyclonic eddy reduces the SLA gradient and weakens the Kuroshio intrusion into the South China Sea. Yuan (2002) used a balance equation
The Western Pacific is a typhoon-prone area. Typhoons passing through the Kuroshio area will have an important impact on the Kuroshio intrusion into the South China Sea. Hsu et al. (2018) believed that when the rotating wind speed of a typhoon coincides with the direction of the main velocity of the Kuroshio current, the Kuroshio current speed increases, and vice versa. Tada et al. (2018) studied the impact of typhoons on the Kuroshio axis near Japan and believed that typhoons cause significant changes in the Kuroshio axis. Most of the Kuroshio axis turns counterclockwise, which promotes northward flow near the coast. Kuo et al. (2018) found that after a typhoon, the ocean temperature near the Luzon Strait significantly decreases, and the decrease in temperature is greater than that east of Luzon Island. Hsu and Ho (2019) analyzed underwater glider observation data and found that a typhoon in the Kuroshio area near Taiwan will cause the temperature of the subsurface seawater to increase and the salinity of the subsurface water to decrease. Lü et al. (2021) found that the super typhoon Soudelor caused the thermocline to rise and the thickness of the thermocline to increase, which led to the reverse intrusion of the Kuroshio tributaries into the continental shelf of the East China Sea. Although many intrusion-related processes are well understood, the effects of typhoons on the Kuroshio intrusion are still relatively unclear. This paper selects a typical typhoon that moves north along the axis of the Kuroshio and uses the COAWST coupling model to assess the impact of the typhoon on the Kuroshio axis and the impact of the Kuroshio intrusion on the South China Sea. Section 2 describes the selected typhoon, the COAWST coupling model verified by measurement data and the main research objectives. Section 3 analyzes the impact of the typhoon on the Kuroshio axis, the influence of the Kuroshio intrusion on the water, heat, and salt fluxes in the South China Sea, and the impact of the Kuroshio intrusion on the temperature and salinity in the South China Sea after the typhoon passes. Section 4 provides a discussion and conclusions.
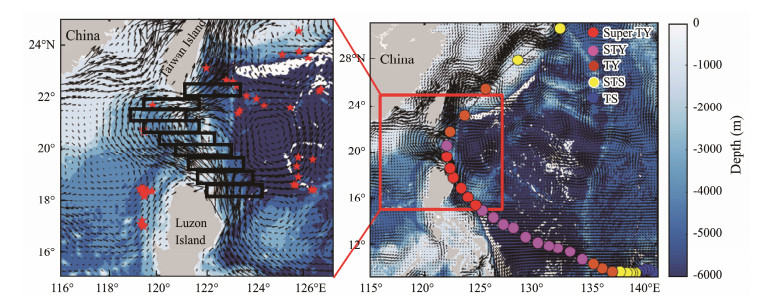
2 Data Methods and Models 2.1 Typhoon Information and Research AreaThis article focuses on Typhoon No. 1506, called the 'Hongxia' typhoon, which started as a tropical storm (TS) in the Northwest Pacific (9.4˚N/140.7˚E) at 18:00 on May 3, 2015 (Universal Time, as used throughout the paper). Hongxia moved westward in the initial stage. At the beginning of the formation of Hongxia, it was located at the weak point of the subtropical high; it moved relatively slowly, and the vertical wind shear increased, which was not conducive to typhoon development. However, the high sea surface temperature of 28 – 29℃ in the Northwest Pacific maintained and increased the intensity of red clouds. At 14:00 on May 6, the direction of movement changed to northwest and west. After reaching typhoon (TY) and strong typhoon (STY) statuses, the position of Hongxia was close to the axis of the Kuroshio current at 12:00 on May 9, and the sea surface temperature east of Luzon reached above 30℃, which provided energy for Hongxia and promoted its evolution into a super typhoon (super TY). At 00:00 on May 11, due to the friction of the Luzon terrain, the status of Hongxia on the east side of the Luzon Strait changed from a super TY to an STY, and the system moved northeast to east. At 06:00 on May 11, the status of Hongxia on the east side of the southernmost tip of Taiwan Island weakened from an STY to a TY, and the system moved northeastward. At 00:00 on May 12, Hongxia weakened into a severe tropical storm. Hongxia landed in Japan that day, leading to considerable precipitation. The specific information for Typhoon Hongxia is shown in Table 1. The typhoon path and the main research area in this paper are shown in Fig. 1.
|
|
Table 1 Information for Typhoon 'Hongxia' |
|
Fig. 1 Schematic diagram of the path of Typhoon Hongxia and the main research area (the color of the base map indicates the water depth, which is taken from ETOPO2; the black arrow indicates the monthly average surface geostrophic current velocity in May 2015; the red five-pointed stars are used to denote the Mass Argo buoy positions; the black rectangular frame is used to show the axis of the Kuroshio current; the red line segments are 18.5˚N and 21˚N; colored dots indicate the center position and intensity of the typhoon). |
The regional coupled ocean-atmosphere-wave numerical model describes the typhoon motion processes at three different temporal and spatial scales and the different physical properties of the mesoscale atmosphere, ocean, and sea surface waves in three dimensions. Both the atmosphere and the ocean are fluid systems on Earth, and their motion is governed by the control equation for Earth fluid motion. Ocean waves are small-scale waves that occur at the sea-air interface, and their motion follows the law of the development and propagation of waves. The numerical model used in this paper to study the ocean-atmosphere-wave interactions during a typhoon is the ocean-atmosphere-wave-sediment transport COAWST model system (Warner et al., 2010, 2012). The COAWST coupled modeling system uses a mature numerical model and advanced modeling technology, including ocean, atmosphere, ocean wave, sediment transport modules and couplers.
In recent years, relevant scholars have evaluated and analyzed the typhoon simulation capabilities of the COAWST model. Research has shown that the COAWST model can effectively simulate the typhoon movement direction and intensity changes in the fully coupled state. Overall, the simulation results of the COAWST model for typhoon processes are in good agreement with observed data (Warner et al., 2010, 2012; Liu et al., 2015).
The WRF has 29 floors vertically, with a horizontal resolution of 9 km. The parameterization schemes selected were the WSM3 microphysics scheme, the RRTM longwave radiation and Dudhia shortwave radiation scheme, the MM5 similar theoretical surface layer scheme, the Yonsei University (YSU) planetary boundary layer scheme, and the Kain-Fritsch cumulus convection scheme. The Regional Ocean Model System (ROMS) has a horizontal resolution of 9 km, 20 layers vertically, a surface stretch coefficient of 4.0, and a bottom stretch coefficient of 0.1; additionally, a GLS parameterized scheme is used for vertical mixing. The SWAN model uses the same grid as ROMS, and the roughness is based on the Taylor and Yelland parameterization scheme. The grid weight interpolation among models is based on the SCRIP toolkit. The initial field and boundary value field of the atmospheric model use NCEP FNL reanalysis data with a temporal resolution of 4 h and a spatial (horizontal) resolution of 1˚×1˚. Assimilation data with a 0.083˚×0.083˚ resolution from HYCOM are used for the initial and boundary fields of the ocean, and ETOPO1 is used for the terrain data. The integral DT is 60 s in the model, and the coupled exchange DT is 600 s.
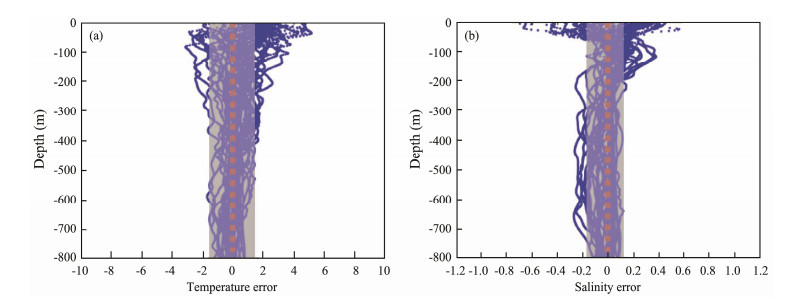
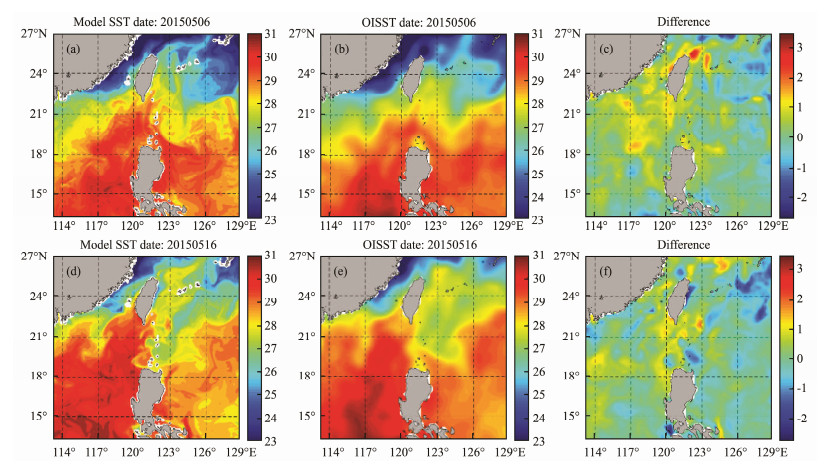
Before and after the typhoon, 42 buoy profile data series obtained near the Luzon Strait (shown in Fig. 1 with the red five-pointed stars) were compared with the model data from the same locations and simulated at the same times to verify the credibility of the model data. A comparison of the results suggests that the model data are consistent with the measured buoy profiles. The temperature error is basically controlled in the range of 1.0℃, and the salinity error is generally within 0.1 (Fig. 2). The mean square error of temperature is 1.029℃, and the mean square error of salinity is 0.011. Fig. 3 shows a comparison of the sea surface temperature (SST) of the model and the optimal interpolated sea surface temperature (OISST) of NOAA before and after the typhoon on May 6 and May 14, respectively. Figs. 3c and 3f show the differences between the two datasets. The mode SST and OISST differences are basically controlled within 0.5℃; only near the northeastern part of Taiwan Island and the south side of the Ryukyu Islands is the difference comparatively large. Therefore, the model data and the measured data are consistent, and the quality of the simulated pattern data is sufficient.
|
Fig. 2 (a) Temperature error and (b) salinity error of the model data based on buoy data verification (shadows represent the mean square errors). |
|
Fig. 3 Comparison of model SST and optimal interpolated SST. The first row indicates pre-typhoon; the second row represents post-typhoon; the first column represents model data; the second column represents satellite remote sensing data; the third column represents the difference between the two. |
Typhoon Hongxia formed on May 4, 2015. The simulation period in this paper starts at 00:00 on May 3, 2015, runs 75 d, and ends at 00:00 on July 17, 2015. The model range is 12˚ – 27.5˚N and 112.5˚ – 129.0˚E, the grid horizontal resolution is 9 km, and the number of grids is 180 × 180. The model results are output every 6 h. The vertical stratification is divided into 20 layers, and the stratification in areas with a water depth greater than 1000 m includes layers at 2.2, 6.8, 12.2, 18.7, 26.9, 37.6, 51.5, 69.4, 92.0, 119.5, 151.8, 188.8, 230.9, 279.5, 336.8, 406.2, 491.6, 598.1, 731.7, and 900.0 m. There are 301 output results for each layer.
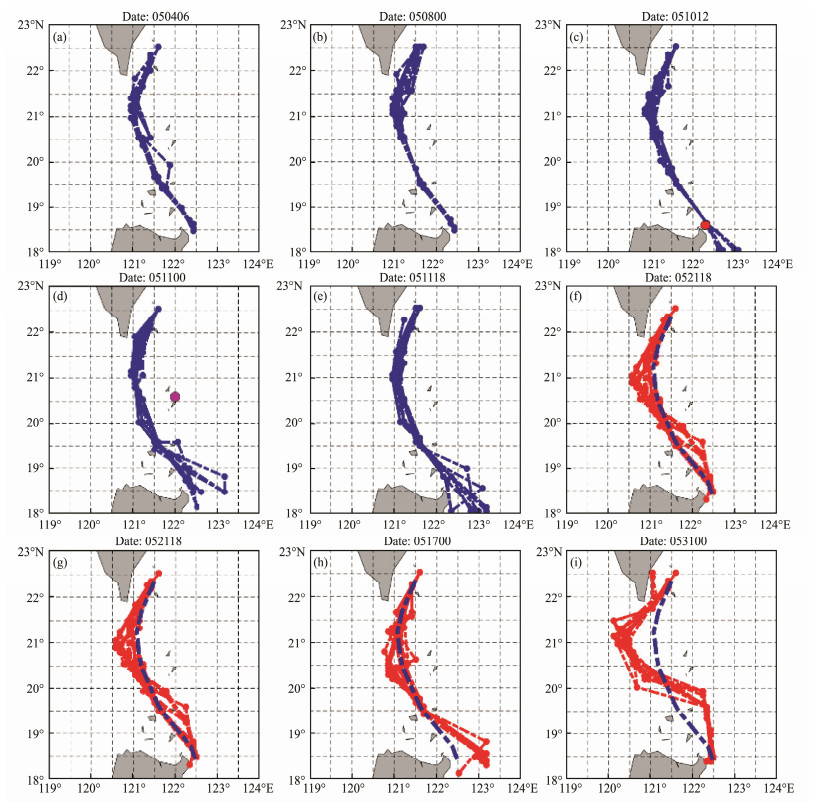
3 Results 3.1 Impact of Typhoons on the Kuroshio Axis 3.1.1 Impact of typhoons on the position of the Kuroshio axisFig. 4 shows the changes in the position of the Kuroshio axis over 500 m before and after the studied typhoon passes. The latitudes of 18˚ – 22.5˚N are evenly divided into 9 segments (18˚ – 18.5˚N, 18.5˚ – 19˚N, 19˚ – 19.5˚N, 19.5˚ – 20˚N, 20˚ – 20.5˚N, 20.5˚ – 21˚N, 21˚ – 21.5˚N, 21.5˚ – 22˚N, and 22˚ – 22.5˚N, as shown in the black rectangular frame in Fig. 1), and the position of the maximum flow velocity in each section is defined as the position of the Kuroshio axis in the section. The colored dots in the picture indicate the location of the typhoon, and the color indicates the intensity (as shown in Fig. 1).
|
Fig. 4 Changes in the position of the main Kuroshio axis before and after the typhoon. (a – e), before the typhoon passes; (f – i), after the typhoon passes. The blue dotted line indicates the average position of the main axis before the typhoon passes. |
From May 5 to May 11, there was an anticyclonic eddy on the right side of the Kuroshio current, and it continuously merged into the Kuroshio axis with high-velocity seawater. At this time, the eddy influenced the speed of the Kuroshio, and then the intensity of the anticyclonic eddy rapidly weakened. Eventually, the eddy completely merged into the Kuroshio current and disappeared. Figs. 4a – 4e show that when the anticyclonic eddy has a considerable influence on the Kuroshio current velocity and that the position of the Kuroshio axis minimally changes; thus, the influence of the anticyclonic eddy on the position of the Kuroshio axis is negligible. By comparing the distribution of Kuroshio axis at different times, we find that the axis began to move slightly westward on approximately May 17, and the amplitude of the westward movement then gradually increased. The range of the westward movement reached a maximum on May 31. Near 21˚N, the axis of the Kuroshio bent the most toward the South China Sea, and the intrusion position is the westernmost of those observed. Seven days after the typhoon passed, the axis of the Kuroshio began to shift toward the South China Sea by approximately 0.25˚ (Fig. 4f). Eleven days after the typhoon passed, the axis of the Kuroshio deviated by approximately 0.5˚ (Fig. 4g). Seventeen days after the typhoon passed, the axis of the Kuroshio deviated by approximately 0.75˚ (Fig. 4h). Twenty days after the typhoon passed, the Kuroshio axis shifted by approximately 1˚ (Fig. 4i).
The change in the position of the Kuroshio axis can effectively reflect the Kuroshio intrusion. Because only the position of the maximum velocity of the Kuroshio is considered, the actual scope of the impact of the Kuroshio current on the South China Sea should be broad.
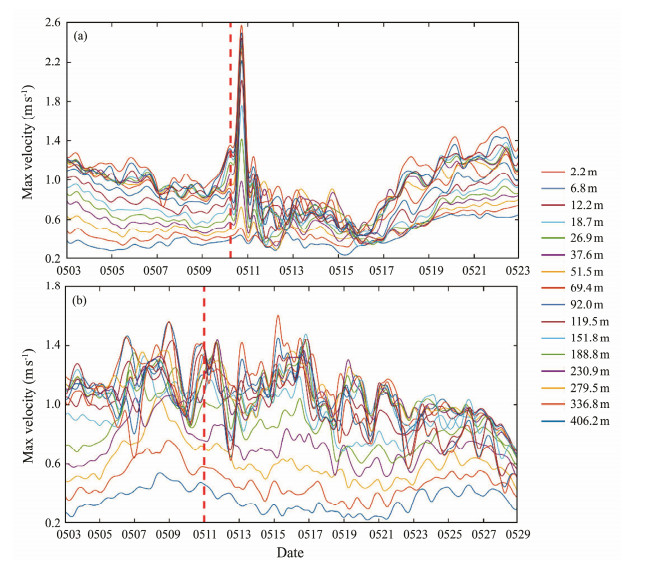
3.1.2 Impact of typhoons on the velocity of the Kuroshio axisIn this paper, two sections are selected at 18.5˚N and 21˚N on the Kuroshio axis to study the velocity changes At 11:00 on May 10, the typhoon center passed the Kuroshio axis. An analysis of the Kuroshio axis velocity in the 18.5˚N section (Fig. 5a) yielded the following results: 1) Before the typhoon passed, the Kuroshio axis surface velocity was approximately 1 m s−1, and the velocity at 200 m was approximately 0.6 m s−1. 2) When the typhoon center passed through this section on May 10, the Kuroshio current speed increased sharply. Seven hours after the typhoon center passed, the velocity in each layer reached a maximum, and the surface velocity was as high as 2.5 m s−1, which was twice as high as the velocity before the typhoon. The velocity distribution generally maintained a decreasing trend from shallow to deep. 3) After the velocity reached the maximum value, it began to rapidly decrease. After 24 h of typhoon conditions, the velocity reached a minimum, and the velocity in each layer of the Kuroshio decreased to 0.6 m s−1. 4) After the typhoon, the velocity in each layer exhibited a certain downward trend. On May 16, the velocity in each layer of the Kuroshio was reduced to half of the velocity before the typhoon (except for a slight rebound after reaching a minimum). 5) At approximately 12:00 on May 16, the velocity began to rise, and at 12:00 on May 19, the velocity returned to the state observed before the typhoon. at various depths before and after the typhoon passes.
|
Fig. 5 Variations in the Kuroshio main axis velocity before and after the typhoon passes. (a), 18.5˚N sectional velocity; (b), 21˚N sectional velocity. The red dashed line indicates the time when the typhoon passed. |
At 02:00 on May 11, the center of the typhoon was approximately 100 km to the east of the Kuroshio axis. An analysis of the Kuroshio axis velocity in the 21˚N section (Fig. 5b) indicated that: 1) Under normal conditions, the Kuroshio surface velocity is approximately 1.15 m s−1, and the velocity at 200 m is approximately 0.7 m s−1. In general, the velocity decreases from the sea surface to lower layers. 2) The velocity gradually increased beginning on May 5 and reached a maximum value at approximately 00:00 on May 9. 3) After the velocity above 100 m reached a maximum, the effect of the typhoon to the east became notable, and the velocity magnitude oscillated; a significant downward trend after May 19 was observed. 4) The velocity below 100 m reached a maximum and then gradually decreased and returned to normal on May 19.
In summary, when the typhoon center passed through the Kuroshio axis, the strong wind speed caused the ocean velocity to increase sharply, and the velocity reached a maximum 7 h after the typhoon passed; this value is as high as twice the velocity before the typhoon. After the typhoon passed, a strong disturbance to the ocean remained, and it hindered the northward flow of the Kuroshio. After the typhoon passed, the velocity of the Kuroshio exhibited a downward trend, and the velocity decreased to a minimum approximately 6 d after the typhoon passed. The flow rate returned to normal after 3 d.
In the middle of the Luzon Strait, the speed of the Kuroshio from May 5 to May 9 exhibited an increasing trend. At this time, the typhoon had just formed and had not yet affected the Kuroshio axis. According to the analysis of the velocity field (Fig. 6), a westwardly moving anticyclonic eddy formed on the right side of the Kuroshio. When approaching the Kuroshio axis, the northward current at the western boundary of the eddy continuously merged into the Kuroshio axis and followed the Kuroshio to higher latitudes. The speed of the eddy was greater than the speed of the Kuroshio, the Kuroshio continued to absorb the anticyclonic eddy, and the velocity near the Kuroshio axis increased. The seawater at the outer boundary of the anticyclonic eddy merged into the Kuroshio in sequential layers, the intensity of the anticyclonic eddy continued to weaken, and the speed of the Kuroshio gradually recovered. On approximately May 18, the anticyclonic eddy was basically absorbed by the Kuroshio current. The increase in velocity in this section was mainly due to the influx of anticyclonic eddies.

|
Fig. 6 Plane distribution of velocity when the anticyclonic vortex approached the Kuroshio axis. Taking a water depth of 119.5 m as an example; the red dotted line indicates the typhoon path. |
The 121˚E section is selected to calculate the water flux Q that the Kuroshio transports to the South China Sea over 400 m. This calculation is as follows (Cai et al., 2002; Fang et al., 2002):
| $ Q = \sum\limits_i {{v_{ni}}{A_i}}, $ | (1) |
where vni is the normal velocity component passing through the ith grid in the section and Ai is the area of the grid. The units of the water flux are 1 Sv = 1 × 10⁶ m3 s.
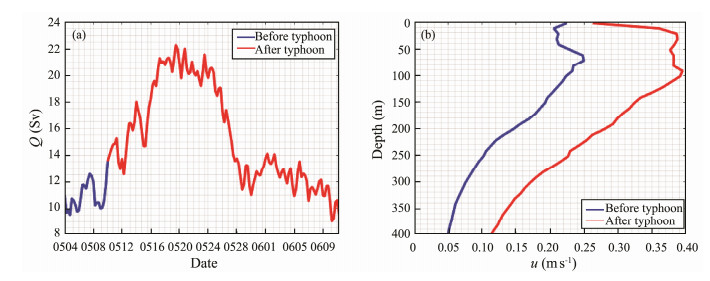
In Fig. 7a, the blue line indicates the water flux of the Kuroshio into the South China Sea before the typhoon passes, and the red line shows the Kuroshio intrusion when the typhoon reaches the Luzon Strait and after the typhoon passes. As shown in the figures, after the typhoon reached the Luzon Strait, the water flux of the Kuroshio intrusion into the South China Sea increased rapidly. The Kuroshio intrusion reached its maximum approximately 6 d after the typhoon, and the maximum flux was 22 Sv, which was twice as high as that before the typhoon. The strongest intrusion state lasted for a week, and the amount of intrusion displayed a downward trend. Approximately 25 d after the typhoon passed, the intrusion flux returned to the state observed before the typhoon.
|
Fig. 7 (a) Change in the water flux of the Kuroshio to the South China Sea above 400 m; (b) Average westward velocity u in each depth layer at 121˚E. The blue line represents the pre-typhoon case, and the red line represents the post-typhoon case. |
Fig. 7b shows the change in the average westward velocity with depth at 121˚E before and after the typhoon passed. As shown in the figures, after the typhoon passed, the westward velocity above 400 m increased, and the most obvious influence was observed at 20 – 100 m, indicating that the impact of the typhoon on the Kuroshio intrusion was most significant in subsurface layers. As depth increased, the influence of the typhoon on the velocity gradually decreased.
The water flux of the Kuroshio intrusion into the South China Sea at different water depths before and after the typhoon was calculated, and the corresponding typhoon contribution was determined. Table 2 indicates that above 400 m, the total water flux of the Kuroshio into the South China Sea before the typhoon was 10.96 Sv, and after the typhoon, this value reached 18.33 Sv; overall, the typhoon contribution to the flux was as high as 40.2%. Above 600 m, the contribution of the typhoon to the flux is as high as 40.7%. Under typhoon conditions, the largest increase in the flux of the Kuroshio intrusion into the South China Sea occurs in the 20 – 400 m layer. The increase gradually decreases with water depth, but the contribution of the typhoon is still significant. The increase in the surface water flux is smaller than that for subsurface water. In addition, the average water flux from 0 – 400 m during the 10-year period of 2008 – 2017 is calculated as a reference. The water flux before the typhoon was close to the water flux under the background climatic state, and the water flux after the typhoon increased significantly.
|
|
Table 2 Comparison of water flux before and after the typhoon (unit: Sv) |
The 121˚E section is selected to calculate the heat flux H and the salt flux S transported by the Kuroshio into the South China Sea at 400 m. These fluxes are calculated as follows (Cai et al., 2002; Fang et al., 2002):
| $ H = \sum\limits_i {{T_i}{\rho _i}{C_p}{v_{ni}}{A_i}}, $ | (2) |
| $ S = \sum\limits_i {{s_i}{\rho _i}{v_{ni}}{A_i}}, $ | (3) |
where Ti is the temperature in the ith grid, ρi is the density of the grid, Cp is the specific heat capacity of seawater at constant pressure, and si is the salinity in the ith grid. The units of the heat flux are 1 J s−1 = 1 W and 1 PW = 1 × 10¹⁵ W. The units of the salt flux are 1 g s−1 (1 Gg s−1 = 1 × 10⁹ g s−1).
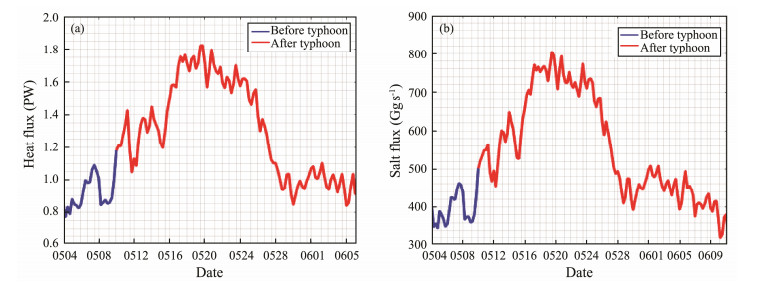
In Figs. 8a and 8b, the blue line denotes the heat and salt fluxes of the Kuroshio intrusion into the South China Sea before the typhoon, and the red line is the Kuroshio intrusion when the typhoon reaches the Luzon Strait and after the typhoon. The heat and salt fluxes reaches a maximum approximately 6 d after the typhoon, and the maximum can reach 1.8 PW and 800 Gg s−1, which is more than twice that before the typhoon. The maximum amount of intrusion began to decrease after approximately a week, and the corresponding state returned to the original intrusion state 25 d after the typhoon.
|
Fig. 8 (a) Heat and (b) salt flux variations associated with the Kuroshio before and after the typhoon intruded into the South China Sea. The blue line indicates the pre-typhoon case, and the red line indicates the post-typhoon case. |
The heat and salt fluxes of the Kuroshio intrusion into the South China Sea at different water depths before and after the typhoon were calculated, and the typhoon contribution to these fluxes was calculated. From Tables 3 and 4, above 400 m, the heat flux and salt fluxes of the Kuroshio intrusion the South China Sea before the typhoon are 0.892 PW and 389.15 Gg s−1, and they can reach 1.473 PW and 651.46 Gg s−1 after the typhoon. The contributions of the typhoon to these fluxes are 39.4% and 40.3%, respectively; above 600 m, the contributions of the typhoon are 39.8% and 40.7%, respectively. Under typhoon conditions, the largest increase in the heat and salt fluxes associated with the Kuroshio intrusion into the South China Sea is at 20 – 400 m. The increases in the surface heat and salt fluxes are smaller than those in subsurface layers. The average heat and salt fluxes from 0 – 400 m during the 10-year period of 2008 – 2017 are calculated as a reference. The heat and salt fluxes before the typhoon are relatively similar to the heat and salt fluxes under typical climatic conditions, and they increase significantly after the typhoon.
|
|
Table 3 Comparison of the heat flux before and after the typhoon (unit: PW) |
|
|
Table 4 Comparison of the salt flux before and after the typhoon (unit: Gg s−1) |
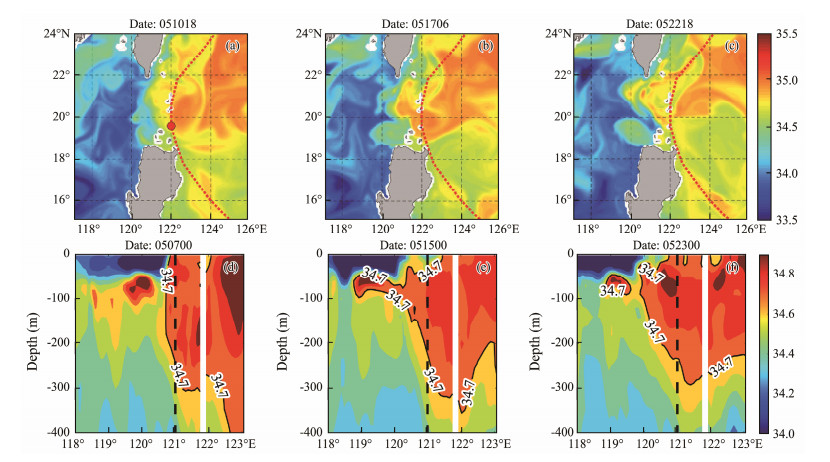
The typhoon caused the Kuroshio axis to bend toward the South China Sea, and the Kuroshio intrusion into the South China Sea increased the water, heat, and salt fluxes, thus influencing the salinity in the South China Sea, especially in the northeastern region. The salinities of the Western Pacific Ocean and the South China Sea are quite different, and the degree of intrusion of the Kuroshio into the South China Sea can be intuitively determined by analyzing the changes in salinity. For a clear description, the 34.7 isohaline is defined as the boundary of the Kuroshio salty water. Before the typhoon passed, the axis of the Kuroshio was relatively stable, and the salinity in the northeastern part of the South China Sea was relatively stable. Taking a water depth of 18.7 m as an example, 7 d after the typhoon passed, the axis of the Kuroshio began to bend toward the South China Sea, and the input of high-salinity water into the South China Sea increased significantly (Fig. 9b). Twelve days after the typhoon passed, the Kuroshio water intruded into the South China Sea to approximately 119˚E, and the impact of the intrusion on the salinity in the northeastern part of the South China Sea expanded (Fig. 9c).
|
Fig. 9 (a – c) Distribution of the Kuroshio input of high-salinity water into the South China Sea (taking a depth of 18.7 m as an example); (d – f) Changes in salinity in the 21˚N section. The blank areas in the figures are land; the black dotted line indicates 121˚E. |
The extent of the Kuroshio intrusion into the South China Sea is most significant at 21˚N (see Fig. 4). The 21˚N section is selected to study the impact of the typhoon on the Kuroshio intrusion into the South China Sea. May 11 is the day on which the typhoon passed through the 21˚N section. Figs. 9d – 9f show the salinity changes in the 21˚N section before and after the typhoon passed. West of 121˚E is the main low-salinity region in the South China Sea, and east of 121˚E is the high-salinity region of the Kuroshio. Four days after the typhoon passed, high-salinity Kuroshio water intruded into the South China Sea, especially above 150 m, and the Kuroshio intrusion was stronger in the subsurface layer than in the surface layer (Fig. 9e). On May 23, the high-salinity Kuroshio water extended to 120˚E (Fig. 9f).
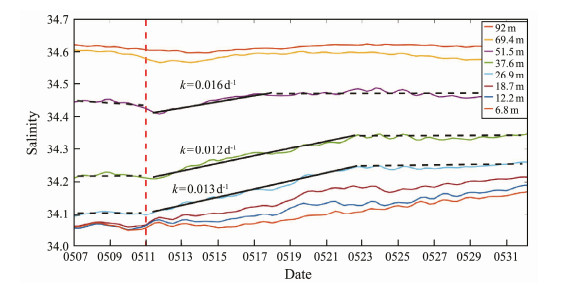
To clearly analyze the impact of typhoons on the Kuroshio intrusion into the South China Sea, the average salinity in each layer in the western region of the Luzon Strait (118˚ – 121˚E, 19˚ – 22˚N) was taken as the characteristic value, and the variations in salinity over time were used to reflect the extent of the Kuroshio intrusion into the South China Sea. Fig. 10 shows that the salinity of each layer increased to varying degrees after the typhoon passed on May 11, reflecting the influence of the typhoon on the Kuroshio intrusion into the South China Sea at different depths.
|
Fig. 10 Average salinity change in each layer above 100 m in the northeastern part of the South China Sea. The black line segment represents the fitting result, the red dotted line represents the typhoon transit time. |
After the typhoon passed, the salinity at 12.2 m changed by approximately 0.06, indicating that the typhoon strengthened the Kuroshio intrusion at the surface of the South China Sea. However, the increase in salinity above 10 m was smaller than that near 20 m. Combined with the southwestern summer monsoon in the South China Sea, it is speculated that the low-salinity water near the surface in the southern South China Sea accumulates in the northeast due to the effect of the predominant wind field, resulting in less obvious changes in surface salinity in the northeastern South China Sea than in subsurface layers. The salinity of subsurface water increased the most under typhoon conditions. The salinity values of 26.9 m, 37.6 m, and 51.5 m increased at rates of 0.013 d−1, 0.012 d−1, and 0.016 d−1, respectively, reflecting the impact of the typhoon on the Kuroshio intrusion. The impact is most obvious in subsurface layers, and this result is consistent with the conclusion drawn in Fig. 9. The increase in salinity below 100 m decreases with depth (not shown in the figure), indicating that the impact of typhoons on the Kuroshio intrusion gradually decreases below 100 m.
Even after the typhoon passed, the Kuroshio water intrusion into the South China Sea was strengthened. However, Fig. 4 shows that the axis of the Kuroshio only bends toward the South China Sea a week after the typhoon passes. Since the determination of the Kuroshio axis in Fig. 4 is based on the maximum velocity within the observed range, the salty water at the western boundary of the Kuroshio had already begun to intrude into the South China Sea when the axis position remained almost unchanged, and the change in the axis position lagged. The Kuroshio intrusion into the South China Sea was mainly reflected in the surface and subsurface layers and had a significant impact on the salinity above the subsurface layer in the northeastern part of the South China Sea. This result corresponds to the changes in the surface and subsurface salinity levels in the South China Sea in recent decades, which are often related to the Kuroshio intrusion (Zeng et al., 2014; Li et al., 2015; Nan et al., 2016; Chen et al., 2019).
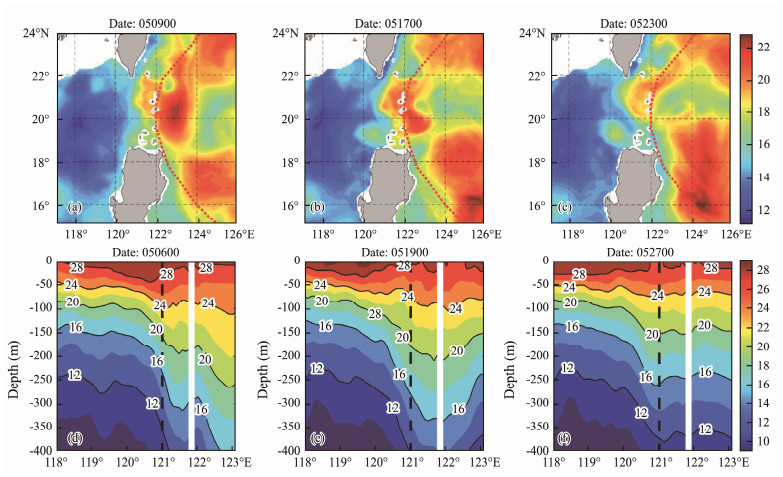
3.3 Influence of the Kuroshio Current on the Temperature in the Northeastern South China Sea After the TyphoonWe further analyzed the temperature changes in the northeastern part of the South China Sea and studied the impact of hot Kuroshio water on the South China Sea after the typhoon. Fig. 11a shows the temperature distribution around the Luzon Strait before the typhoon passed, and Figs. 11b and 11c show the temperature distribution around the Luzon Strait after the typhoon. The results indicate that after the typhoon passed, the hot Kuroshio water gradually intruded into the South China Sea. Based on Figs. 4 and 6, the temperature increase on the southern side of Taiwan Island is caused by the shift in the Kuroshio axis to the South China Sea, and the temperature increase on the northwest side of Luzon Island is caused by the anticyclonic vortex that the Kuroshio shed in the South China Sea. Figs. 11d – 11f correspond to the temperature section at 21˚N. The results show that after the typhoon passed, the hot Kuroshio water obviously intruded into the South China Sea near 121˚E.
|
Fig. 11 (a – c) Distribution of the Kuroshio input of hot water into the South China Sea (with a depth of 18.7 m as an example); (d – f) Changes in temperature in the 21˚N section. The blank areas in the figures are land, and the black dotted line indicates 121˚E. |
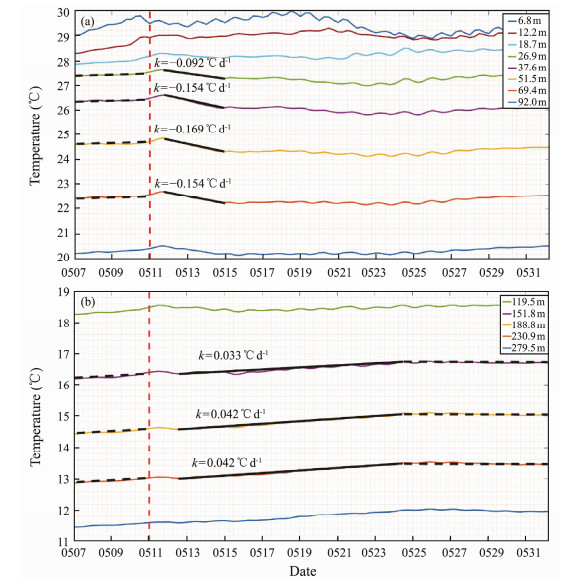
In the northeastern part of the South China Sea (118˚ – 121˚E, 19˚ – 22˚N), the average temperature at different times is used as a characteristic value to reflect the influence of the Kuroshio intrusion on the temperature in the South China Sea. After the typhoon passed, the temperatures at depths of 151.8 m, 188.8 m, and 230.9 m increased at rates of 0.033 ℃ d−1, 0.042 ℃ d−1, and 0.042 ℃ d−1, respectively, indicating that the influence of the Kuroshio intrusion on the temperature in the South China Sea was most significant in subsurface layers (Fig. 12b). From May 12 – 15, the temperatures in the 26.9 m, 37.6 m, 51.5 m, and 69.4 m layers decreased at rates of 0.092 ℃d−1, 0.154 ℃ d−1, 0.169 ℃ d−1, and 0.154 ℃ d−1, respectively; notably, the typhoon caused a general decrease in the upper-layer temperature of the Kuroshio current, which indirectly caused a decrease in the average temperature in the northeastern part of the South China Sea (Fig. 12a).
|
Fig. 12 Variation in the average temperature in each layer with time in the northeastern part of the South China Sea (a) above 100 m and (b) 100 – 300 m. The black line segment indicates the fitting result, and the red dotted line indicates the typhoon transit time. |
Our preliminary research suggests that typhoons that moved along the right side of the Kuroshio path and across the northern part of Luzon had a significant impact on the Kuroshio intrusion into the South China Sea. The increase in the water flux under typhoon conditions above 400 m was approximately 1.27 × 10¹³ m3 and 3.31 × 10¹² m3 along these two paths, respectively. Additionally, the increase in the heat flux under typhoon conditions above 400 m was approximately 1.00 × 10²¹ J and 6.48 × 10²⁰ J, and the increase in the salt flux under typhoon conditions above 400 m was approximately 4.53 × 10¹⁷ g and 3.15 × 10¹⁷ g. Thirteen typhoons followed each of these two paths in the ten years from 2008 to 2017, and the water, heat and salt fluxes associated with the Kuroshio intrusion caused by typhoons above 400 m in the ten years were approximately 2.08 × 10¹⁴ m3, 2.14 × 10²² J, and 9.98 × 10¹⁸ g, accounting for 8.4%, 10.8%, and 11.4% of the total water, heat, and salt fluxes, respectively. Studying the impact of typhoons on the Kuroshio intrusion is important in analyses of Luzon transport.
By comparing the results of this paper with the water fluxes in the Luzon Strait obtained by previous authors (Table 5), we find that the net water fluxes before the typhoon obtained in this paper are similar to those reported by Zhou et al. (2009) and Yuan et al. (2012). The westward net water flux is smaller than the results based on the ADCP observations of Tian et al. (2006). The eastward water flux is basically consistent with the results obtained by Yang et al. (2011) based on ADCP observations, although the westward water flux obtained in this study is larger than that previously reported. The direction of the net water flux is opposite that reported by Yang et al. (2010). After a typhoon, the water flux will increase substantially. Generally, the water flux in the Luzon Strait is affected by factors such as season and depth, and the data accuracy and calculation method can influence results. Thus, there are some differences in the calculated results.
|
|
Table 5 Comparison of water flux values reported in the Luzon Strait |
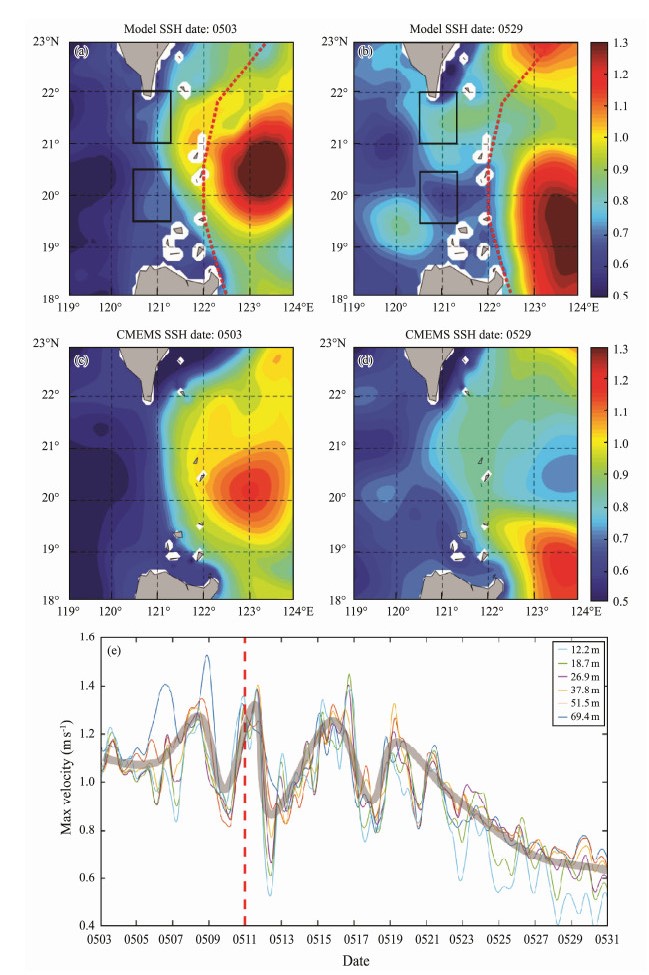
Under typhoon conditions, the intensity of the Kuroshio intrusion into the South China Sea is affected by various mechanisms. In the Luzon Strait, the center of the typhoon is located to the east of the Kuroshio axis, and northerly winds act on this axis. With the geostrophic current formula (Eq. (4)), we calculated the average geostrophic current velocity before and after the typhoon (Figs. 13a and 13b). The results show that the geostrophic current velocities before and after the typhoon were 0.076 m s−1 and 0.141 m s−1, respectively. The geostrophic current velocity after the typhoon was twice that before the typhoon, and all current directions are west. As shown in Fig. 7b, the westward velocity in the surface layer before the typhoon was approximately 0.22 m s−1. The sea level difference caused by the typhoon increased the velocity of the geostrophic current by 0.065 m s−1, and this effect was considerable. We believe that after the typhoon, northerly winds hindered the northward flow of the Kuroshio, causing the Kuroshio water to accumulate in the northern part of the Luzon Strait, and the sea level in the northern part of the Luzon Strait became higher than that in the southern part of the Luzon Strait. The difference in sea surface pressure in the north-south direction produced a westward geostrophic current, and the intensity of the Kuroshio intrusion into the South China Sea increased.
| $ u = - \frac{1}{{\rho f}}\frac{{\partial p}}{{\partial y}}. $ | (4) |
|
Fig. 13 (a – d) Sea level changes near the Luzon Strait before and after the typhoon; (e) Northerly component variation diagram for the Kuroshio current in the 21˚N section before and after the typhoon. The black box is the range selected to calculate the geostrophic current velocity. (a) and (b) are based on model data; (c) and (d) are based on the CMEMS reanalysis data for comparison with the model data. The grey line indicates the fitting result; the red dotted line indicates the typhoon transit time. |
In addition, when the typhoon passed through the Luzon Strait, its center was located to the right of the Kuroshio axis. The northerly wind at the western boundary of the typhoon center influenced the Kuroshio axis (as shown in Fig. 14). A northerly wind can produce westward Ekman transport and strengthen the Kuroshio intrusion into the South China Sea. Furthermore, near the Luzon Strait, the strong disturbance to the ocean after the typhoon caused the northern component of the Kuroshio current to continue to decrease (as shown in Fig. 13e). According to the balance
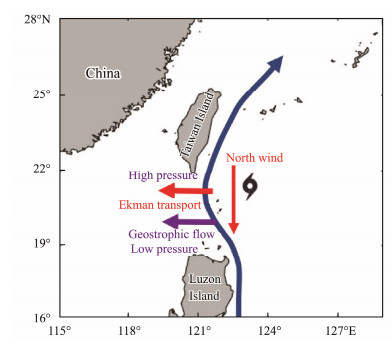
|
Fig. 14 Ekman transport and geostrophic current velocities under typhoon conditions. The west-pointing red arrow indicates the Ekman transport caused by wind stress; the west-pointing purple arrow indicates the geostrophic current caused by the difference in sea surface pressure between north and south. |
1) When typhoon 'Hongxia' passed, in the latitude direction, the Kuroshio intrusion into the South China Sea was the most significant at 21˚N. In the vertical direction, the Kuroshio intrusion was strongest in the subsurface layer, leading to the most significant changes in temperature and salinity in the northeastern part of the South China Sea occurring in subsurface layers. The westward deviation of the Kuroshio axis caused by the typhoon displayed a certain lag compared with the hot and salty water intrusion into the South China Sea approximately 7 d later. The impact of the typhoon on the Kuroshio intrusion into the South China Sea lasted for 20 d. The typhoon increased the water, heat, and salt fluxes associated with the Kuroshio intrusion into the South China Sea, and the contribution of the typhoon to these fluxes was as high as 40%. Under typhoon conditions, the maximum Kuroshio intrusion flux reached more than twice that before the typhoon.
2) The north-south sea surface pressure gradient caused by the typhoon produced a westward geostrophic current. The geostrophic current after the typhoon was twice as high as that before the typhoon, and it increased the intensity of the Kuroshio intrusion into the South China Sea. The northerly wind associated with the typhoon resulted in westward Ekman transport, which strengthened the Kuroshio intrusion into the South China Sea.
3) From 2008 to 2017, typhoons that had a significant impact on the Kuroshio intrusion of water, heat, and salinity fluxes above 400 m, reaching approximately 2.08 × 10¹⁴ m3, 2.14 × 10²² J, and 9.98 × 10¹⁸ g and accounting for 8.4%, 10.8%, and 11.4% of the total water, heat, and salt fluxes, respectively, during this ten-year period. Thus, typhoons have an important impact on Luzon transport.
AcknowledgementsWe thank the Copernicus Marine Environment Monitoring Service (CMEMS, https://marine.copernicus.eu/), National Oceanic and Atmospheric Administration (OISST, https://www.ncdc.noaa.gov/oisst), China Argo Real-Time Data Center (http://www.argo.org.cn/), and Central Meteorological Observatory Typhoon Network (http://typhoon.nmc.cn/web.html). We thank the Tianjin Key Laboratory for Oceanic Meteorology for its support via the 2020 Open Fund Project (No. 2020TKLOMZD01).
Cai, S. Q., Liu, H. L., and Li, W., 2002. Water transport exchange between the South China Sea and its adjacent seas. Advances in Marine Science, 20(3): 29-34. (  0) 0) |
Chen, C., and Huang, M. H., 1996. A mid-depth front separating the South China Sea water and the Philippine Sea water. Journal of Oceanography, 52(1): 17-25. DOI:10.1007/BF02236530 (  0) 0) |
Chen, X., Liu, Z., Wang, H., Xu, D., and Wang, L., 2019. Significant salinity increase in subsurface waters of the South China Sea during 2016 – 2017. Acta Oceanologica Sinica, 38(11): 51-61. DOI:10.1007/s13131-019-1498-z (  0) 0) |
Fang, G., Wei, Z., Cui, B., Wang, K., Fang, Y., and Li, W., 2002. Inter-regional water, heat and salt transport in China's offshore waters: Results of the global variable grid model. Science China (Series D), 32(12): 967-977. (  0) 0) |
Farris, A., and Wimbush, M., 1996. Wind-induced Kuroshio intrusion into the South China Sea. Journal of Oceanography, 52(6): 771-784. DOI:10.1007/BF02239465 (  0) 0) |
Gan, J., Liu, Z., and Hui, C., 2016. A three-layer alternating spinning circulation in the South China Sea. Journal of Physical Oceanography, 46(8): 2309-2315. DOI:10.1175/JPO-D-16-0044.1 (  0) 0) |
Hsin, Y., Wu, C., and Chao, S., 2012. An updated examination of the Luzon Strait transport. Journal of Geophysical Research Oceans, 117: C0322. DOI:10.1029/2011JC007714 (  0) 0) |
Hsu, P. C., and Ho, C. R., 2019. Typhoon-induced ocean subsurface variations from glider data in the Kuroshio region adjacent to Taiwan. Journal of Oceanography, 75(1): 1-21. DOI:10.1007/s10872-018-0480-2 (  0) 0) |
Hsu, T. W., Chou, M. H., Hou, T. H., and Liang, S. J., 2018. Typhoon effect on Kuroshio and Green Island wake: A modelling study. Ocean Science Discussions, 12(6): 3199-3233. DOI:10.5194/osd-12-3199-2015 (  0) 0) |
Kuehl, J. J., and Sheremet, V. A., 2009. Identification of a cusp catastrophe in a gap-leaping western boundary current. Journal of Marine Research, 67(1): 25-42. DOI:10.1357/002224009788597908 (  0) 0) |
Kuo, Y. C., Zheng, Z. W., Zheng, Q., Gopalakrishnan, G., and Lee, H., 2018. Typhoon-Kuroshio interaction in an air-sea coupled system: Case study of Typhoon Nanmadol. Ocean Modelling, 132: 130-138. DOI:10.1016/j.ocemod.2018.10.007 (  0) 0) |
Li, D., Zhou, M., Zhang, Z., Zhong, Y., Zhu, Y., Yang, C., et al., 2015. Intrusions of Kuroshio and shelf waters on northern slope of South China Sea in summer 2015. Journal of Ocean University of China, 17(3): 477-486. DOI:10.1007/s11802-018-3384-2 (  0) 0) |
Lien, R. C., Ma, B., Cheng, Y. H., Ho, C. R., Qiu, B., Lee, C. M., et al., 2014. Modulation of Kuroshio transport by mesoscale eddies at the Luzon Strait entrance. Journal of Geophysical Research: Oceans, 119(4): 2129-2142. DOI:10.1002/2013JC009548 (  0) 0) |
Liu, N., Ling, T., Wang, H., Zhang, Y., and Gao, Z., 2015. Numerical simulation of typhoon Muifa (2011) using a coupled ocean-atmosphere-wave-sediment transport (COAWST) modeling system. Journal of Ocean University of China, 14(2): 199-209. DOI:10.1007/s11802-015-2415-5 (  0) 0) |
Liu, Z., Chen, X., Yu, J., Xu, D., and Sun, C., 2019. Kuroshio intrusion into the South China Sea with an anticyclonic eddy: Evidence from underwater glider observation. Journal of Oceanology and Limnology, 37(5): 1469-1480. DOI:10.1007/s00343-019-8290-y (  0) 0) |
Lü, H., Liu, Y., Wang, Y., Cui, Y., Ge, X., and Zhou, L., 2021. Abnormal reverse intrusion of the Kuroshio Branch Current induced by super typhoon Soudelor. Estuarine, Coastal and Shelf Science, 256: 107377. DOI:10.1016/j.ecss.2021.107377 (  0) 0) |
Metzger, E. J., and Hurlburt, H. E., 1996. Coupled dynamics of the South China Sea, the Sulu Sea, and the Pacific Ocean. Journal of Geophysical Research: Oceans, 101(C5): 12331-12352. DOI:10.1029/95JC03861 (  0) 0) |
Nan, F., Xue, H., Chai, F., Wang, D., Yu, F., Shi, M., et al., 2013. Weakening of the Kuroshio intrusion into the South China Sea over the past two decades. Journal of Climate, 26(20): 8097-8110. DOI:10.1175/JCLI-D-12-00315.1 (  0) 0) |
Nan, F., Yu, F., Xue, H., Zheng, L., and Wang, D., 2016. Freshening of the upper ocean in the South China Sea since the early 1990s. Deep Sea Research Part Ⅰ: Oceanographic Research Papers, 118: 20-29. DOI:10.1016/j.dsr.2016.10.010 (  0) 0) |
Qu, T., 2002. Evidence for water exchange between the South China Sea and the Pacific Ocean through the Luzon Strait. Acta Oceanologica Sinica, 21(2): 175-185. (  0) 0) |
Qu, T., Kim, Y. Y., Yaremchuk, M., Tozuka, T., Ishida, A., and Yamagata, T., 2004. Can Luzon Strait transport play a role in conveying theimpact of ENSO to the South China Sea?
. Journal of Climate, 17(18): 3644-3657. DOI:10.1175/1520-0442(2004)017<3644:CLSTPA>2.0.CO;2 (  0) 0) |
Shu, Y. Q., Xiu, P., Xue, H., Yao, J., and Yu, J., 2016. Glider-observed anticyclonic eddy in northern South China Sea. Aquatic Ecosystem Health & Management, 19(3): 233-241. DOI:10.1080/14634988.2016.1208028 (  0) 0) |
Shu, Y., Chen, J., Li, S., Wang, Q., Yu, J., and Wang, D., 2019. Field-observation for an anticyclonic mesoscale eddy consisted of twelve gliders and sixty-two expendable probes in the northern South China Sea during summer 2017. Scientia Sinica (Terrae), 62(2): 451-458. DOI:10.1007/s11430-018-9239-0 (  0) 0) |
Tada, H., Uchiyama, Y., and Masunaga, E., 2018. Impacts of two super typhoons on the Kuroshio and marginal seas on the Pacific coast of Japan. Deep Sea Research, 132: 80-93. DOI:10.1016/j.dsr.2017.12.007 (  0) 0) |
Tian, J., Yang, Q., Liang, X., Xie, L., Hu, D., Fan, W., et al., 2006. Observation of Luzon Strait transport. Geophysical Research Letters, 33(19): L19607. DOI:10.1029/2006GL026272 (  0) 0) |
Wang, Q., Zeng, L., Chen, J., He, Y., Zhou, W., and Wang, D., 2020. The linkage of Kuroshio intrusion and mesoscale eddy variability in the northern South China Sea: Subsurface speed maxìmum. Geophysical Research Letters, 47(11): e2020GL087034. DOI:10.1029/2020GL087034 (  0) 0) |
Warner, J. C., Armstrong, B. N., He, R., Zambon, J. B., Olabarrieta, M., Voulgaris, G., et al., 2012. Development and applications of a Coupled-Ocean-Atmosphere-Wave-Sediment Transport (COAWST) Modeling System. AGU Fall Meeting Abstracts, American Geophysical Union, 230-244, https://doi.org/10.1016/j.ocemod.2010.07.010.
(  0) 0) |
Warner, J. C., Armstrong, B., He, R., and Zambon, J. B., 2010. Development of a Coupled Ocean-Atmosphere-Wave-Sediment Transport (COAWST) Modeling System. Ocean Modelling, 35(3): 230-244. DOI:10.1016/j.ocemod.2010.07.010 (  0) 0) |
Wu, C. R., 2013. Interannual modulation of the Pacific Decadal Oscillation (PDO) on the low-latitude western North Pacific. Progress in Oceanography, 110(3): 49-58. DOI:10.1016/j.pocean.2012.12.001 (  0) 0) |
Yang, Q., Tian, J., and Zhao, W., 2010. Observation of Luzon Strait transport in summer 2007 – ScienceDirect. Deep Sea Research Part Ⅰ: Oceanographic Research Papers, 57(5): 670-676. DOI:10.1016/j.dsr.2010.02.004 (  0) 0) |
Yang, Q., Tian, J., and Zhao, W., 2011. Observation of material fluxes through the Luzon Strait. Chinese Journal of Oceanology and Limnology, 29(1): 26-32. DOI:10.1007/s00343-011-9952-6 (  0) 0) |
Yaremchuk, M., and Qu, T., 2004. Seasonal variability of the large-scale currents near the coast of the Philippines. Journal of Physical Oceanography, 34(4): 844-855. DOI:10.1175/1520-0485(2004)034<0844:SVOTLC>2.0.CO;2 (  0) 0) |
Yuan, D., 2002. A numerical study of the South China Sea deep circulation and its relation to the Luzon Strait transport. Acta Oceanologica Sinica, 21(2): 187-202. (  0) 0) |
Yuan, Y., Liao, G., Kaneko, A., Yang, C., Zhu, X. H., Chen, H., et al., 2012. Currents in the Luzon Strait obtained from moored ADCP observations and a diagnostic calculation of circulation in spring 2008. Dynamics of Atmospheres and Oceans, 58: 20-43. DOI:10.1016/j.dynatmoce.2012.07.002 (  0) 0) |
Yuan, Y., Liao, G., Yang, C., Liu, Z., Hong, C., and Wang, Z. G., 2014a. Summer Kuroshio intrusion through the Luzon Strait confirmed from observations and a diagnostic model in summer 2009. Progress in Oceanography, 121: 44-59. DOI:10.1016/j.pocean.2013.10.003 (  0) 0) |
Yuan, Y., Yang, C., Liao, G., Chow, C. H., Liu, Z., Zhu, X. H., et al., 2014b. Variation in the Kuroshio intrusion: Modeling and interpretation of observations collected around the Luzon Strait from July 2009 to March 2011. Journal of Geophysical Research: Oceans, 119(6): 3447-3463. DOI:10.1002/2013JC009776 (  0) 0) |
Zeng, L., Chassignet, E., Schmitt, R. W., Xu, X., and Wang, D., 2018. Salinification in the South China Sea since late 2012: A reversal of the freshening since 1990s. Geophysical Research Letters, 45(6): 2744-2751. DOI:10.1002/2017GL076574 (  0) 0) |
Zeng, L., Liu, W. T., Xue, H., Peng, X., and Wang, D., 2014. Freshening in the South China Sea during 2012 revealed by Aquarius and in situ data. Journal of Geophysical Research: Oceans, 119(12): 8296-8314. DOI:10.1002/2014JC010108 (  0) 0) |
Zheng, Q., Tai, C. K., Hu, J., Lin, H., Zhang, R. H., Sun, F. C., et al., 2011. Satellite altimeter observations of nonlinear Rossby eddy – Kuroshio interaction at the Luzon Strait. Journal of Oceanography, 67(4): 365. DOI:10.1007/s10872-011-0035-2 (  0) 0) |
Zhou, H., Nan, F., Shi, M. C., Zhou, L. M., and Guo, P. F., 2009. Characteristics of water exchange in the Luzon Strait during September 2006. Chinese Journal of Oceanology and Limnology, 27(3): 650-657. DOI:10.1007/s00343-009-9175-2 (  0) 0) |
Zu, T., Wang, D., Wang, Q., Li, M., Wei, J., Geng, B., et al., 2020. A revisit of the interannual variation of the South China Sea upper layer circulation in summer: Correlation between the eastward jet and northward branch. Climate Dynamics, 54: 457-471. DOI:10.1007/s00382-019-05007-5 (  0) 0) |
Zu, T., Xue, H., Wang, D., Geng, B., Zeng, L., Liu, Q., et al., 2019. Interannual variation of the South China Sea circulation during winter: Intensified in the southern basin. Climate Dynamics, 52: 1917-1933. DOI:10.1029/2005JC003269 (  0) 0) |
 2023, Vol. 22


