2) State Key Laboratory of Severe Weather, Chinese Academy of Meteorological Sciences, Beijing 100081, China;
3) School of Earth Science, University of Melbourne, Melbourne 3052, Australia;
4) Research and Development Division, Bureau of Meteorology, Melbourne 3052, Australia;
5) Shandong Meteorological Bureau, Jinan 250031, China
Henan Province experienced an extreme rainstorm event on July 17 – 22, 2021. The maximum hourly precipitation in Zhengzhou reached 201.9 mm, breaking the previous record (i.e., 189.5 mm h−1 in Linzhuang, Henan Province on August 5, 1975) over Mainland China. The accumulated precipitation is also large. The 6-day accumulated precipitation in Hebi is 1122.6 mm. The range of strong precipitation is wide, with rainfall in 2083 out of 2454 stations in Henan Province at 0000 UTC on July 17 – 22 exceeding 50 mm. Heavy rainfall caused heavy disasters, including urban waterlogging, river floods, mountain floods, and landslides, resulting in significant casualties and property losses (Huang et al., 2023). Researchers have investigated this extreme rainstorm from many perspectives, among which the long-distance water vapor transport of tropical cyclone (TC, also known as typhoon (TY) or hurricane) In-fa has received extensive attention (Ran et al., 2021; Buer et al., 2022; Liang et al., 2022; Rao et al., 2022, 2023; Yu et al., 2022). Results showed that the extreme rainstorm event is the tropical cyclone remote precipitation (TRP) of TC In-fa.
TC precipitation can be divided into two categories. One is the precipitation within the TC circulation, and the other is the TRP (Chen, 2006), which is also called the predecessor rain event (Galarneau, 2010). Although the TRP occurs outside of the TC circulation, it has a close connection with TCs (Chen, 2007) and can cause disasters even exceeding those caused by the precipitation within the TC circulation (Cong, 2011). For example, the ‘58·7’ rainstorm of the Yellow River (Ding et al., 1987), the ‘63·8’ extremely heavy rainstorm in Hebei (Tao, 1980), and the ‘7·21’ heavy rainstorm events in Beijing (Yu, 2012; Xu et al., 2014) are all related to TRP. Because TRPs are often far from TCs and influenced by multiple midlatitude and low-latitude systems and their interactions, they are difficult to accurately forecast using numerical models (Xu et al., 2023). Moreover, the current research on TC precipitation is mainly focused on the precipitation within the TC circulation (Chen and Xu, 2017; Chen et al., 2017; Ren and Yang, 2019). TRP is also not given adequate consideration by operational forecasts, leading to poor forecasts and inadequate preparation for TRP occurrences. Therefore, the research on TRP has important scientific and practical significance.
Currently, the research on TRP mainly focuses on two aspects: statistical characteristics and case mechanism research. Statistical characteristics mainly focus on the areas where TRP frequently occurs. In China, Sun and Wei (1995) showed that over half of regional extreme storm events in Hebei Province from 1965 to 1994 were indirectly affected by TCs, and the combination of the low-altitude southeast airflow of TCs and the southwest airflow is conducive to the rapid development of the low-pressure system and the enhancement of precipitation. A remarkable relationship between TC activity and remote precipitation has been proven on the eastern edge of the Qinghai-Tibet Plateau (Xie and Zhuo, 2000; Zhuo et al., 2000) and Shaanxi Province (Hou et al., 2006). Yang et al. (2008) revealed that the TCs landing or activating on the coast of South China accompanied by a westerly belt system and subtropical high system can produce torrential rain in Shandong Province approximately 2.5 times a year, with the maximum in July. Cong (2011) investigated the characteristics of TRP from 1971 to 2006 in China. TRP was discovered to occur most frequently between late June and early September. The Bohai Rim and adjacent areas between the Sichuan and Shaanxi Provinces were identified as two high-incidence areas of TRP, and the three typical tracks for TRP were revealed.
Furthermore, the daily precipitation statistics in Liberia indicate that TCs approaching 900 – 1200 km of Costa Rica have a noticeable effect on daily precipitation and may account for 15% of the region’s annual precipitation (Waylen and Harrison, 2005). Galarneau et al. (2010) investigated the TRP that occurred over the United States east of the Rockies from 1995 to 2008 and summarized that approximately 30% of TCs can generate TRP in the United States, and these TRP occur most commonly in August and September in approximately 1000 km poleward of recurving TCs, 36 h before the arrival of the main rain shield. Byun and Lee (2012) determined that the TC rainfall within the range of 1200 – 2800 km accounted for 32% of the total precipitation over the Korean Peninsula from 1981 to 2009. Ding et al. (2017) indicated that most TRP events occurred on the right side of TC tracks in East Asia from 2000 to 2009.
TRP can be influenced by the interplay between TCs and midlatitude and low-latitude systems. Several researchers have investigated the complex mechanism of TRP. Previous studies (Farfán and Fogel, 2007; Corbosiero et al., 2009; Schumacher and Galarneau, 2012) showed that continuous water vapor transport by TCs to the TRP area contributes to the maintenance of rainstorm by providing humid and warm air mass to support deep convection. According to Moore et al. (2013), all TRPs are accompanied by synoptic-scale circulations that move water vapor from the area around the TCs to the TRP region.
In addition to water vapor transportation, the coordination of other weather systems is indispensable during TRP. The deepening of the midlatitude trough plays a crucial role in the development of TRP (Atallah and Bosart, 2003; Sun et al., 2006; Li, 2020). The westerly trough at midlatitude and high latitude provides a large-scale background for TRP with low-level convergence, high-level divergence, and positive vorticity advection in front of the trough, which is conducive to the establishment and maintenance of vertical motion and rainfall (Foley and Hanstrum, 1994; Zhu et al., 2000). Sun et al. (2005) determined that 32.2% of the TRP cases were accompanied by the interaction between TC and vortex (trough). When the TC interacts with the northeast cold vortex (Wang et al., 2007; Peng et al., 2022), the southwest low vortex (Kang et al., 2013; Li et al., 2013; Zhang et al., 2014), and the northwest vortex (Sun and Wei, 1995; Wu et al., 2015), sustained heavy precipitation can be easily trigged.
As the bridge connecting the midlatitude and low-latitude systems, the low-level jet stream is of great importance to the formation of TRP (Ding et al., 2001, 2017). Except for boosting to convey abundant moisture and heat, the wind speed fluctuation in the jet can trigger the release of unstable energy, which is conducive to TRP (Sun and Zhai, 1980; Ching et al., 2014; Yu, 2021). Especially when the high-level and low-level jet streams combine with the TC circulation, the TRP will increase (Chen and Ding, 2000). The enhancement of the ascent and frontogenesis within the equatorward entrance region of the high-level jet streams is also favorable for the occurrence of TRP (Yuan et al., 2018). The Western Pacific subtropical high (WPSH) is also important (Xing, 2015). Influenced by the TC activity on its southern side, the WPSH can adjust to the general atmospheric circulation conducive to TRP (Cong, 2011; Hui, 2016; Bao et al., 2020). However, the role of terrain in TRP is not obvious, and the impact of terrain on TRP is always localized (Wang et al., 2009; Cong, 2011; Huang and Lin, 2014).
Studies have shown that the regions in China where TRP can occur may be more extensive than previously recognized. Yuan et al. (2018) determined that approximately 19% of Bay of Bengal TCs produce TRP over China’s low-latitude highlands, which frequently occurs when TCs are active in the northern Bay of Bengal with northeastward tracks. Xu et al. (2023) reported that approximately 10% of TCs that make landfall in China create TRP over the Yangtze River Delta region; the TRP peak months in this region are June and September, and the TRP mainly lies between 900 km and 1700 km from the TC when a 925-hPa equivalent potential temperature ridge locates to the east of a 500-hPa trough. Thus, the characteristics and trends of TRP in China need to be further explored and will contribute to the study of the universal mechanism of TRP. However, these studies are severely constrained by the absence of objective methods for TRP identification.
Jia et al. (2023) developed an objective synoptic analysis technique for TRP (OSAT_TRP). Individual cases are examined, and comparisons between the OSAT_TRP outcomes and the subjective recognition results are made to prove the applicability of this method. This article is based on the 1979 – 2020 China TRP dataset obtained by the OSAT_TRP to analyze the climate characteristics of TRP. The remainder of this paper is organized as follows: The datasets and methods are described in Section 2. The climatology and trends of TRP are presented in Section 3. A brief composite analysis of the possible factors that affect the distribution of TRP and the reason for the trend of TRP are given in Section 4. Finally, the conclusions and further discussion are provided in Section 5.
2 Data and Method 2.1 Data1) The recorded historical precipitation data of 2024 rain gauge stations in China from 1979 to 2020 with 24-h intervals at 1200 UTC are archived by the China Meteorological Administration.
2) The Shanghai Typhoon Institute provided the historical best-track data for the years 1979 – 2020 with 6-h intervals, which include the position and strength of the TCs (Ying et al., 2014; Lu et al., 2021).
3) The ERA5 reanalysis data of temperature, atmospheric pressure, specific humidity, wind speed, east – west and south – north vertical water vapor fluxes, and other meteorological elements with a spatial resolution of 0.25° × 0.25° and a time resolution of four times a day (0000, 0600, 1200, and 1800 UTC) are from the European Center for Medium-Range Weather Prediction (https://cds.climate.copernicus.eu/cdsapp#!/dataset).
2.2 Objective Synoptic Analysis Technique for TRPThe OSAT_TRP developed by Jia et al. (2023) mainly includes the following three steps:
1) Identifying the potential TRP: First, the daily precipitation is divided into different rain belts and some scattered precipitation stations by computing the rain rate of neighborhood stations (r). The K most potential rain belt centers with the high r values are selected, and whether the adjacent stations belong to the same rain belt as the chosen station is determined (Ren et al., 2007). Then, the TC rain belts among these rain belts are identified. If a station experiences precipitation but does not reside within the TC rain belt and the distance between the station and the TC is more than the top limit of the TC peripheral flow system radius by 200 km and is less than 3000 km, then it is a potential TRP. This step ensures that the identified potential TRP occurs outside the circulation of TC and that there is a gap between the TRP and the precipitation within the TC circulation.
2) Identifying the strong water vapor transport belt from TC: First, the water vapor transport belt from the TC toward the area where the potential TRP is located by integrated horizontal water vapor transport (IVT) at 0000 UTC is determined. Then, the region along the water vapor transport belt with IVT ≥ 150 kg m−1 s−1 is regarded as a strong water vapor transport belt.
3) Distinguishing the TRP: The potential TRP identified in Step 1 is interpolated in the 0.25 × 0.25 grid point. If the interpolated potential TRP overlaps with the grid point of the strong water vapor transport belt from the TC and is located to the north of the TC center, it can be identified as TRP.
3 Characteristics of the TRPSimply adding up the TRP of each TC at the station may lead to repeated accumulation of precipitation caused by double or multiple TCs when investigating the climate characteristics of TRP. Thus, the TRP time series of each station was further calculated to ensure that the TRP value per day at each station was only counted once, although this precipitation may be caused by multiple TCs at the same time (Yang, 2019).
Statistics show that 1251 TCs, including tropical depressions (TDs), tropical storms (TSs), severe tropical storms (STSs), TYs, severe typhoons (STYs), and super TYs, were generated in the Western Pacific (including the South China Sea) between 1979 and 2020. Moreover, 906 out of these 1251 TCs generated TRP, and 600 out of these 906 generated TC remote heavy precipitation (TRHP; single-station precipitation per day ≥ 50 mm). That is, approximately 72.42% of the TCs in the Western Pacific would generate TRP, and 47.96% would generate TRHP. With an average of 2.81 impact days per TC, 906 TCs produce 2546 TRP days, whereas 600 TCs generate 1280 TRHP days. Furthermore, 374 TCs (approximately 62.33%) produce TRHP for 2 days or longer. Out of 906 TCs that generated TRP, 627 have continuous TRP days ≥ 2 days. The average TRP days of these TCs is 3.45 days. Most TCs cause a single TRP process, accounting for 86%. However, there are 80 TCs that cause 2 TRP processes and 6 TCs that cause 3 TRP processes.
There are 667 TCs that cause TRP and TC precipitation and 445 TCs that cause heavy precipitation. Among the precipitation related to TCs, the TRP accounts for 36.3%, and heavy precipitation accounts for 29.7%. That is, more TC-related precipitation, particularly rainstorms, is caused by the direct impact of TC. However, the proportion of TRP is indispensable.
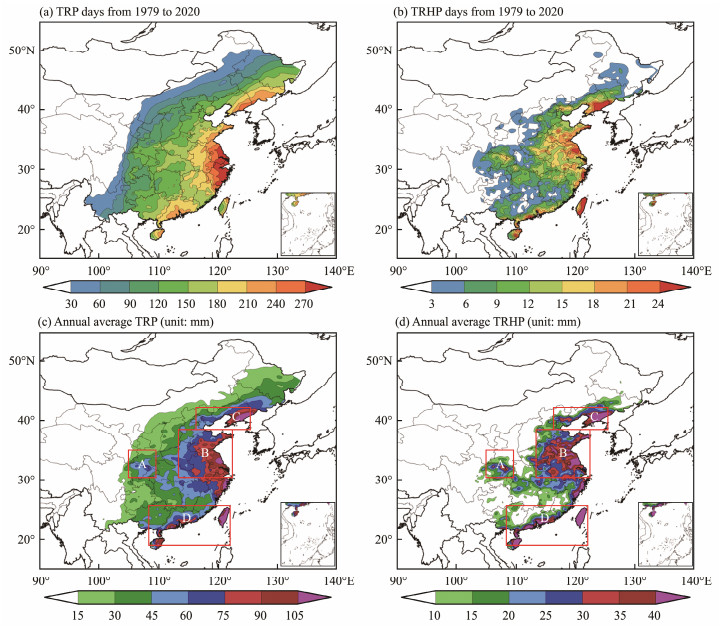
3.1 Spatial CharacteristicsThe number of TRP days in China gradually decreases from coastal to inland areas (Fig.1a). The Yangtze River Delta has high-value areas, of which Ninghai in Zhejiang Province has the largest number of TRP days, reaching 350 days in 42 years. Fig.1b shows that TRHP cumulative days have distinct distribution characteristics from TRP. The coastal high-value areas are mainly located in the eastern Liaoning, Jiangsu, and Taiwan Provinces, whereas the inland high-value areas are located at the border between the Sichuan and Shaanxi Provinces. The province with the highest number of TRP days is Zhejiang, with 809 days, whereas the province with the highest number of TRHP days is Shandong, with 253 days.
|
Fig. 1 Precipitation days and annual average precipitation of TRP and TRHP from 1979 to 2020. The red box shows the four key regions of TRP. |
The annual average precipitation for TRP and TRHP (Figs.1c and 1d) is consistent with the distribution of TRHP days. The top 3 provinces in remote precipitation, whether measured by TRP or TRHP, are Shandong, Henan, and Jiangsu Provinces. There are 63 stations in China with an annual average TRP exceeding 100 mm. There is a high-value area for annual average TRP in the adjacent areas between the Sichuan and Shaanxi Provinces. For TRHP, this feature is more pronounced. As shown in Fig.1, the four key regions of TRP are the adjacent areas between the Sichuan and Shaanxi Provinces (Region_A: 30° – 35°N, 105° – 110°E), the coast of the Yellow Sea (Region_B: 30° – 38°N, 113° – 123°E), the northern coast of the Bohai Sea (Region_C: 38° – 41°N, 118° – 125°E), and the southern coast area (Region_D: 18° – 25°N, 109° – 121°E).
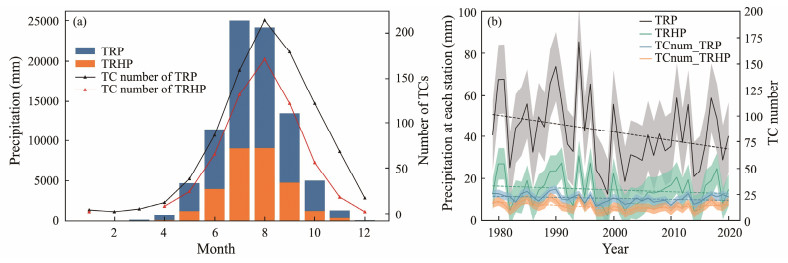
3.2 Temporal CharacteristicsOn average, 22 TCs generate TRP, and 14 TCs generate TRHP annually. Fig.2a shows the inter-month distributions of TRP and TPHP and the number of related TCs. The influence of remote precipitation related to TC reaches its peak in July and August, accounting for over 55% of the total TRP. When compared with the high TRP in August, which is primarily due to the large number of TCs, the high TRP in July is primarily attributable to the high single TRP. The proportion of TRP in total precipitation is the largest in August, followed by July and September. September has the highest percentage of TRHP in rainstorms, followed by August and July.
|
Fig. 2 (a) Inter-month distributions of TRP and TPHP and the number of related TCs. (b) Time series and trends of TRP (black line), TRHP (green line), and number of related TCs (blue and orange lines) from 1979 to 2020. The solid and dashed lines indicate the raw data and the corresponding linear trend, respectively. |
The time series of annual TRP and TRHP and the number of related TCs over Mainland China exhibited a linear decrease (Fig.2b), with the annual TRP and its related TC numbers having statistical significance over the 90% confidence level. Moreover, the TRP and TRHP generated by each TC slightly decreased. Through power spectrum analysis, these six quantities exhibit 4- to 5-year periodic changes. The time series of the annual TRP in four seasons is also determined. The decreasing trend mainly occurs in summer (figure not shown). When performing linear trend fitting on the number of TCs affecting TRHP in the first 21 years and the following 21 years, both the downward trend in the first 21 years and the upward trend in the following 21 years passed the 90% significance hypothesis test. The TRHP also increased before 2000 and decreased after 2000. However, the trend was not statistically significant.
The spatial and temporal characteristics of the TRP of 627 TCs have continuous TRP days ≥ 2 d, consistent with the aforementioned results.
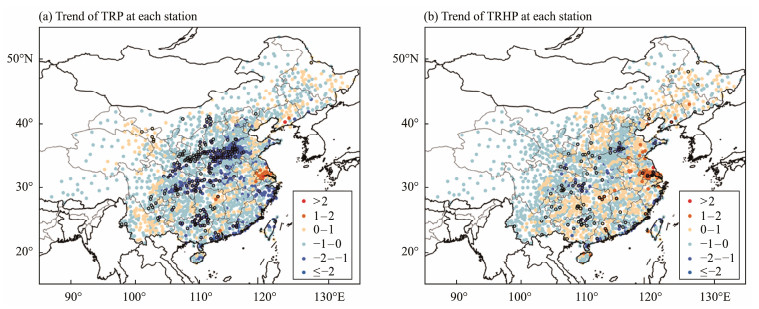
As shown in Fig.3a, most stations exhibit a decreasing trend of TRP, with the trend near the Yangtze and Yellow River Basins being the most significant and passing the 90% significance test. Compared with the trend of TRP, more stations show the increasing trend of TRHP; however, only a few of these are significant over the 90% confidence level (Fig.3b). The stations with an increasing trend are mainly located in the southern Jiangsu Province. The TRP and TRHP in Changzhou increased in 2.37 mm yr−1 and 1.92 mm yr−1. Based on the classification of TCs with a maximum wind speed of ≥ 32 m s−1 near the TC center as the strong TC group and < 32 m s−1 as the weak TC group, the decrease in TRP is mainly attributed to the decrease in TRP of the weak TC group.
|
Fig. 3 Trends of TRP and TRHP at each station during 1979 – 2020 (mm yr−1; colored solid points). Stations with trends that are significant over the 90% confidence level are denoted by black circles. |
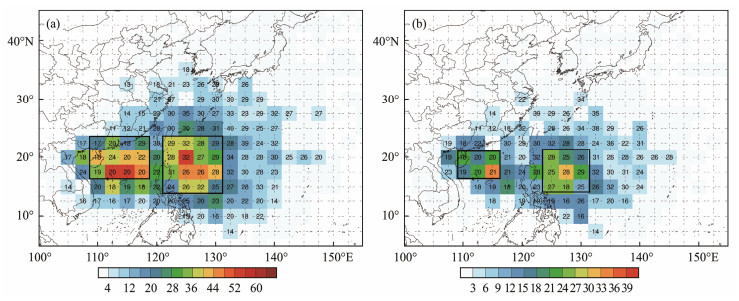
When TRP occurs, the TC is mainly located in the ocean between 110° – 130°E and 15° – 25°N, which can be further divided into two areas (Fig.4a). The western region is located in the northern South China Sea near Hainan Island, whereas the eastern region is located in the Pacific Ocean east of Taiwan and the Philippine Archipelago. The high-frequency region of TCs is somewhat consistent with TRP when TRHP occurs (Fig.4b) but is more concentrated between 15° and 20°N. Fig.4 shows that the numerical high-value region is more northward than the colored high-value region, indicating that the high-value region of TCs that generate TRP (TRHP) is more northward than that of the high-frequency region of TCs. Statistical analysis also shows that TRP occurs more frequently before the TC reaches its maximum intensity. The average TC intensity is typically lower in the western region than in the eastern region. The average TC intensity in the western region reaches the grade of TS, whereas that in the eastern region reaches the grade of STS.
|
Fig. 4 Spatial distribution of the position frequency and intensity of TCs at 0000 UTC on TRP (TRHP) precipitation day. The color map is the interpolated frequency of TCs appearing within the 2.5 × 2.5 grid points when TRP (TRHP) occurs, and the number on the grid point is the average of the maximum wind speed near the TC center (unit: m s−1). |
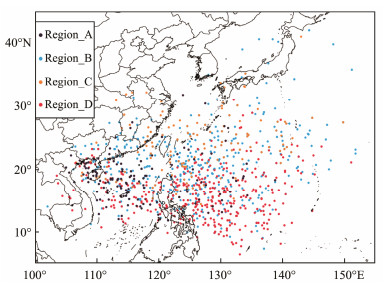
The four key regions of TRP are discussed in Section 3.1. As shown in Fig.5, when TRP occurs in Region_A, the majority of TCs are located on the sea near Hainan Island. When TRP occurs in Region_B, the distribution of TC positions is wide but mainly between 15° and 25°N. TCs are located between 25° and 30°N when TRP occurs in Region_C. However, TCs are located south of 20°N when TRP occurs in Region_D. In conclusion, TRP lies approximately 13° north of the TC. The average distances between the daily maximum TRP and the TC in the four regions are 1879, 1923, 2129, and 1785 km.
|
Fig. 5 Location of TCs at 0000 UTC when TRP occurs over the key TRP region. Different colored dots represent the location of TCs during TRP occurrence in different regions. |
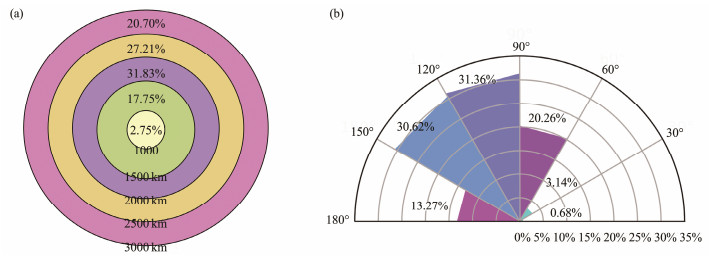
TRP accounts for the largest percentage, i.e., 31.83%, within the range of 1500 – 2000 km, followed by 27.21% within the range of 2000 – 2500 km (Fig.6a). The ratios of TRHP, TC with TRP, and TC with TRHP are also approximately the same within each radius range from the TC center, primarily within the range of 1500 – 2500 km. Fig.6b shows that the majority of TRPs occur northwest of the TC, with 61.98% of the total TRP within the north to 60° west of the north of the TC. Within the east to 60° east of the north of the TC, there is nearly no TRP. The proportions of TRHP and TC and the numbers of TRP and TRHP within the different ranges of angles are also nearly the same.
|
Fig. 6 (a) Proportion of TRP within each radius from the TC center; (b) proportion of angles between the line connecting the TC center and TRP station and the east direction during 1979 – 2020. |
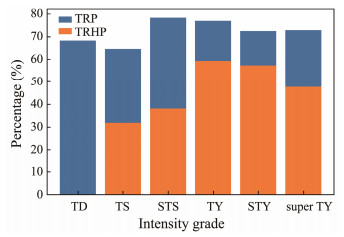
The proportion of TCs at different levels that can produce TRP is shown in Fig.7. The proportion varies little at each level. The maximum is in STS level, i.e., 78.24% of STS can produce TRP. Meanwhile, the minimum is in the TS level, i.e., TCs related to TRP account for 64.52%. However, the proportion of TRHP varies considerably. The maximum is 59.27% of the TY level when TDs have never caused TRHP. Fig.7 also shows that more than half of TCs of any intensity are more likely to cause TRP, whereas TCs of TY level and above are more likely to cause TRHP.
|
Fig. 7 Percentage of TC at each intensity grade generating TRP and TRHP. |
Using the k-means clustering method, Zheng et al. (2013) separated the tracks of TCs with the top 10% of the total TRP into three categories (Fig.8). The third category has the most cases, i.e., 43 TCs. The majority of these TCs originate west of 135°E and move northwest into Guangdong, Guangxi, and Fujian Provinces. The first category has 31 TCs, most of which are generated east of 130°E. Compared with the third category, their landing sites are more southerly, with a more pronounced westward trend and fewer northward trends, and they last longer after landing. The second category has 16 TCs, most of which are generated east of 130°E; however, only 2 of these TCs land in China. Most of these TCs move toward the northeast of the sea after heading northwest, and their strength mostly reaches the STY level.

|
Fig. 8 Three types of tracks of 90 TCs with total TRP ranking in the Top 10%. |
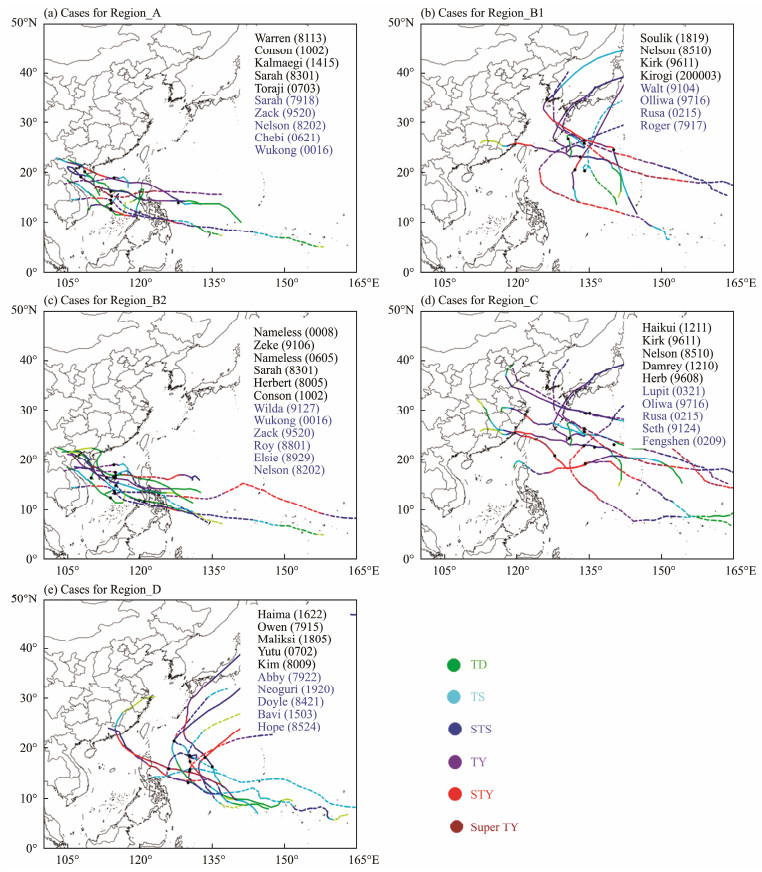
Typical TCs whose total TRP ranks top 10 in the four key areas of TRP were selected. Meanwhile, a group of TCs with similar TC positions but no TRP as a comparison were selected. The typical TC tracks and TC positions on TRP days selected for each region are shown in Fig.9. Except for the northern coast of the Bohai Sea, five TCs with TRP and five TCs without TRP were selected for each key region. The solid and dashed lines indicate the TC tracks with and without TRP, respectively. The TC number and name are given in the figure legend. The black font denotes the group with TRP, whereas the purple font denotes the group without TRP. Notably, the TCs with TRP over adjacent areas between the Sichuan and Shaanxi Provinces are mainly westbound TCs that land near Hainan Island (Fig.9a). TCs with westbound tracks and landing in eastern coastal provinces in China account for a large proportion when heavy TRP occurs on the northern coast of the Bohai Sea (Fig.9d). For the southern coast area, TCs with northwest recurving tracks are dominant (Fig.9e). When TCs cause TRP on the coast of the Yellow Sea, their tracks can be classified into two types. Therefore, this area is further divided into two categories. The TCs in Region_B1 consist largely of recurving TCs over the Northwest Pacific (Fig.9b), whereas the TCs in Region_B2 enter the South China Sea along a westward track and make landfall near Hainan Island (Fig.9c). The black dots in Fig.9 indicate the TC positions on the main TRP day of the chosen TCs, further supporting the result that the farther north the TC is, the farther northward the TRP is located. The strength of the TC is typically at or above the TY level while producing heavy TRP. The differences in typical TC between the group with TRP and the group without TRP are mainly detected in the synoptic circulation characteristics, which are further discussed in Section 4.1.
|
Fig. 9 Tracks and intensities of typical TC cases in the four regions. The solid line denotes the TC with TRP, and the dotted line denotes the TC without TRP. The color of the line represents the TC intensity, which is determined based on the average value of the maximum wind speed near the TC center (unit: m s−1). The black dots denote the TC positions on the chosen TRP days. |
A TC is a moving weather system. The traditional composite analysis might mask the circulation of the TC and surrounding weather systems. A dynamic composite analysis method to ensure that TCs are located at the center of the research region was employed to determine the characteristics of TC circulation and the surrounding weather systems (Gray, 1979; Li et al., 2004; Zhao et al., 2021). A comparative analysis of the selected TCs with and without TRP is discussed in Section 3.3. In this section, the large-scale circulations of these TCs will be discussed. The investigated area is 40° longitude or latitude in each of the four directions on the geographical coordinates centered around a TC. The composite TC position is the average TC position at 0000 UTC of the main precipitation days. The average TC positions are denoted by the black dots in Fig.9.
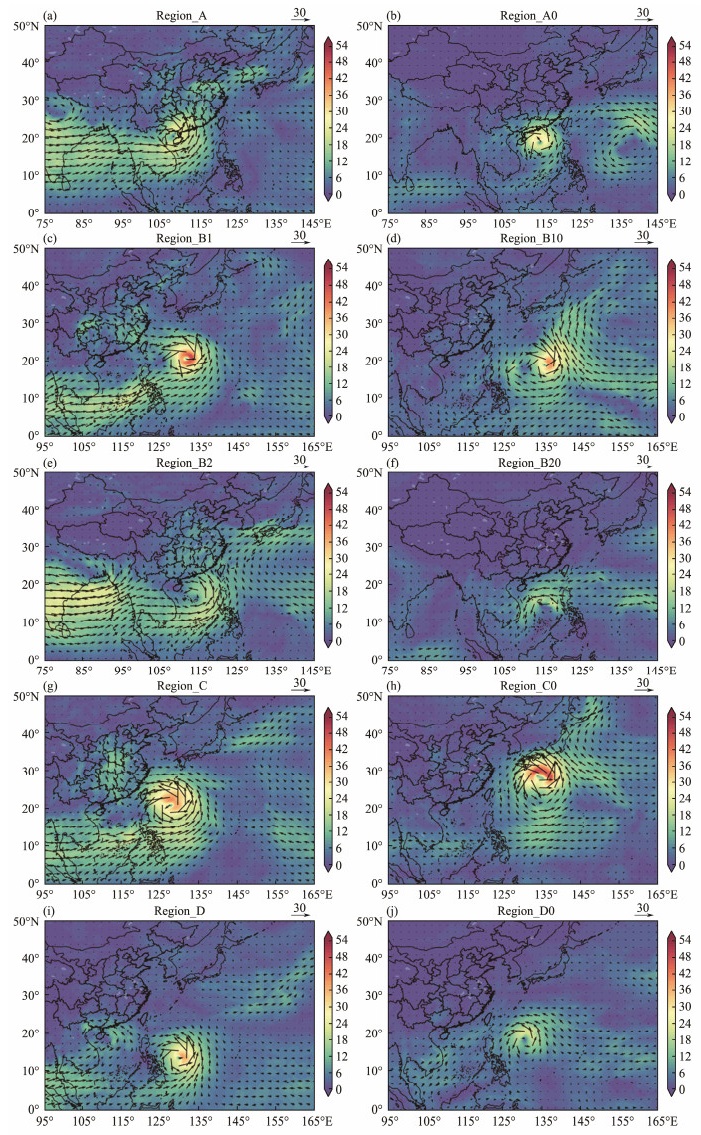
Fig.10 shows the dynamic composite TC circulation and water vapor flux in the key regions. In all regions, the south – west water vapor channel on the east side of TC is significantly stronger with TRP than without TRP. The water vapor on the west side of the TC is transported first to the TC and then to the TRP area. Then, TRP occurs with a favorable atmospheric circulation background. However, when there is nearly no water vapor transported from the west side of the TC, TRP is unlikely to occur. The Dynamic Monsoon Surge Index (DMSI; Zhao et al., 2021) was calculated for each region with or without TRP. Notably, the DMSI of every key region with TRP was approximately twice that without TRP, indicating that the southwest monsoon played a crucial role in water vapor transport.
|
Fig. 10 Dynamic composition of water vapor fluxes (unit: kg m−1 s−1) for typical TC cases in the five regions. The five figures on the left show the composite circulation with TRP, whereas those on the right show the composite circulation without TRP in the same region (added 0 after the region names in the subfigure title). |
Region_B2 has the strongest water vapor transport (Fig.10). In this region, two streams of water vapor are transported to the precipitation area through TCs (Fig.10). However, the cooperation of weather systems in the midlatitude and high latitude is more important for Region_B1. The 500-hPa height fields show that the most obvious meridional circulation among the four regions appears when TRP occurs in Region_B1, mainly in front of the westerly trough (figure not shown). Excluding Region_D, the WPSH east of TC is located at approximately 30°N, of which Region_D is located at approximately 20°N. Without TRP, the WPSH generally moves southward because the WPSH to the north blocks the eastward movement of the upstream westerly trough. The slow-moving westerly trough is beneficial for sustained precipitation.
4.2 Analysis of the Decreasing Trend of TRPPrevious research revealed a connection between TC intensity and TC-induced precipitation rate (Rodgers et al., 2001; Lonfat et al., 2004; Liu and Wang, 2020). However, the correlation analysis identified a weak link between cumulative TRP and TC intensity, which is consistent with the results of Yuan et al. (2018). Thus, the decreasing trend of TRP is unrelated to the trend of TC intensity strengthening.
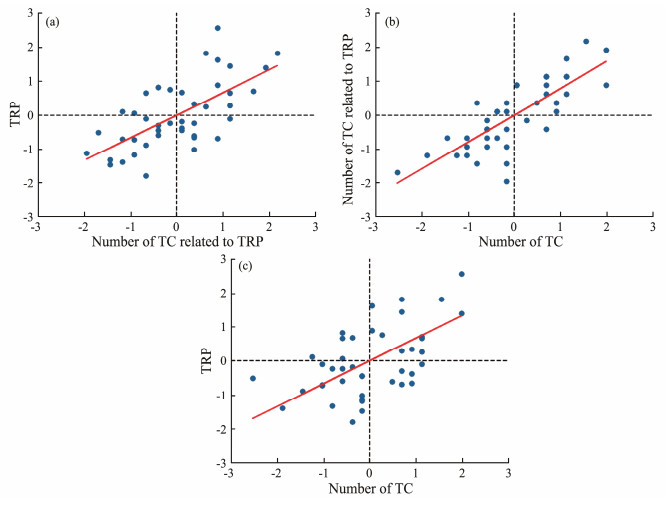
The standard deviation is used to standardize the annual number of TCs, TRP, and the number of TCs related to TRP. Fig.11 shows the scatter plot of these three variables. Notably, a linear relationship between the TRP and the number of TCs related to TRP during the period 1979 – 2020 is detected, with a correlation coefficient of 0.67 (significant at the 99.9% confidence level). The correlation coefficient between the number of TCs and the number of TCs related to TRP is 0.54 (significant at the 99.9% confidence level). Meanwhile, the correlation coefficient between the number of TCs and TRP is 0.79 (significant at the 99.9% confidence level). A reduction in the number of TCs leads to a decrease in the number of TCs related to TRP. TRP decreases with the decrease in the number of TCs related to TRP.
|
Fig. 11 (a) Scatter plot of the annual number of TCs related to TRP vs. the TRP and the associated linear fitting (the red diagonal line). (b) As in (a), but for the number of TCs vs. the number of TCs related to TRP. (c) As in (a), but for the number of TC vs. the TRP. |
Furthermore, the correlation coefficient between the TRP and the latitude of its related TC is −0.29, which passes the 90% significance level test. That is, the farther north the TC is, the less likely it is to cause TRP. From 1979 to 2020, no significant change in the latitude of the TC that generated TRP was detected. Thus, the decrease in TRP is largely due to a decrease in the number of TCs that generated TRP. The two main reasons for the decrease are the decrease in the number of TCs generated annually in the Northwest Pacific (i.e., 0.14° yr−1, statistically significant at the 95% level) and the northward shift of TCs in the Northwest Pacific (i.e., 0.05° yr−1, statistically significant at the 99% level), causing a decrease in the frequency of TCs located at the latitudes that are prone to produce TRP.
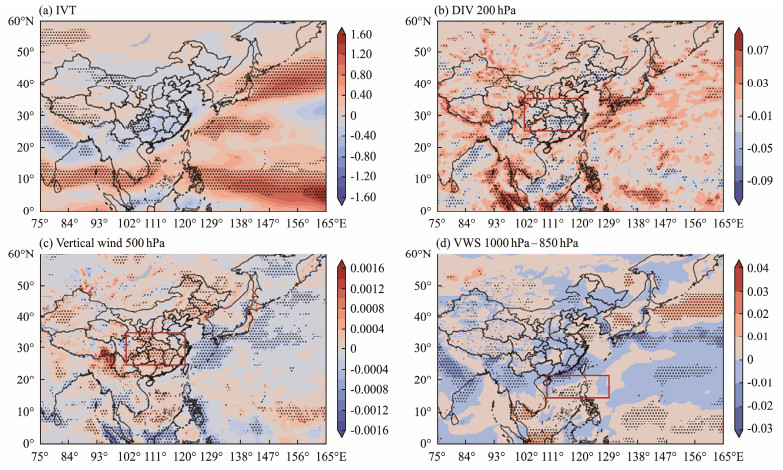
We investigated the large-scale environmental conditions and their corresponding trend to better understand the factors that result in the decreasing trend of TRP. The trend of IVT from 1979 to 2020 is shown in Fig.12a. Notably, despite the significant increase in the water vapor flux on the ocean that the TRP water vapor comes from, the water vapor transported to Mainland China shows a decreasing trend. Especially in Guizhou Province and Chongqing, the decrease is significant, which is consistent with the decline in TRP in this area and the vital role that water vapor plays in producing TRP. Thus, the decrease in IVT may contribute to the decrease in TRP.
|
Fig. 12 Spatial distributions of (a) trends of IVT (shaded areas; kg m−1 s−1 yr−1), (b) upper tropospheric divergence (10−6 s−1 yr−1) at 200 hPa, (c) vertical motion at 500 hPa (Pa s−1 yr−1), and (d) vertical wind shear between 1000 hPa (m s−1 yr−1) and 850 hPa (m s−1 yr−1) during 1979 – 2020. Regions with trends that are significant over the 90% confidence level are shown with dots. |
A notable reduction in divergence at 200 hPa, approximately 25° and 35°N, is detected (Fig.12b), which is consistent with a reduction in vertical wind speed at 500 hPa, approximately 25° and 35°N (Fig.12c). This finding indicates that the upward movement in these regions weakens significantly, which is inconducive to the development of convection. However, when water vapor is transferred to the TRP region, the development of convection is required to generate precipitation. Thus, a decreasing trend of TRP in these regions has been observed.
Moreover, the low-level vertical wind shear between 850 hPa and 1000 hPa shows a significant increasing trend between 15° – 20°N and 110° – 130°E (Fig.12d). TCs located over this region are prone to causing remote precipitation. The increasing trend provides an unfavorable dynamical environmental condition conducive to TC maintenance. The decreased hours that TC is maintained in this region further lead to a decrease in TRP. An analysis of the deep-layer vertical wind shear between 850 hPa and 200 hPa was also conducted, and the results showed the trend in this region was not statistically significant (figure not shown). Wang et al. (2015) compared the correlation between TC intensity change and vertical wind shear in different vertical layers over the WNP. They discovered that the deep-layer vertical wind shear, which is frequently used, was less destructive to TCs than the low-level shear between 850 (or 700) hPa and 1000 hPa.
5 Discussion and ConclusionsBased on the daily TRP dataset obtained by the OSAT_TRP method, this article explores the climate characteristics of China’s TRP from 1979 to 2020. The main conclusions are as follows:
1) The proportion of TCs in the Western Pacific that produce TRP and TRHP is approximately 72.42% and 47.96%, respectively, with an average of 2.81 TRP days per TC. TRP primarily occurs in July and August. The four key regions of TRP are the adjacent areas between the Sichuan and Shaanxi Provinces, the northern coast of the Bohai Sea, the coast of the Yellow Sea, and the southern coast area. Shandong Province has the most TRHP days and accumulated TRP and TRHP, whereas Zhejiang Province has the most TRP days.
2) When TRP occurs, the TC is mainly located in the ocean between 110° – 130°E and 15° – 25°N. A weak link between cumulative TRP and TC intensity is identified. TCs of any level have over 50% likelihood of causing TRP, whereas TCs of TY level and above are more likely to cause TRHP. TRP is the highest within the range of 1500 – 2500 km from the TC center, accounting for 59.04%. The TRP mainly occurs in the northwest direction of the TC, with 61.98% located within the north to 60° west of the north of the TC. The three advantage tracks for TRP are generating west of 135°E and moving northwest toward Guangdong, Guangxi, and Fujian Provinces, generating east of 130°E and landing on the southeast or southwest coast of China, and generating east of 130°E and moving northeast after heading northwest.
3) The major mechanism of TRP is water vapor transport, first channeled through the monsoon current around the western side of the TC and then channeled around the TC to the northwest over China. The TRP is always located in front of the westerly trough. When there is TRP, the WPSH tends to move northward, which is conducive to blocking the eastward movement of the upstream westerly trough and is beneficial for the lasting precipitation.
4) TRP has a decreasing trend, particularly near the Yangtze and Yellow River Basins, which is caused by a reduction in the number of TCs that produce TRP. From the perspective of large-scale environmental conditions, the decrease in IVT in Mainland China, the weakening of the upward motion at approximately 25° – 35°N, which is inconducive to convection, and the increase in low-level vertical wind shear in regions with high frequencies of TRP-related TCs, which is unfavorable for the development of TC, also contribute to the decline in TRP.
This study provides an analysis of the climate characteristics of TRP. However, the following aspects still need further research:
1) The characteristics of TRP during different continuous processes of one TC need to be investigated.
2) When the TRP is concurrently influenced by two or more TCs, the proportion of the impact of each TC is not yet clear.
3) Whether the TC is the source of moisture or the monsoon current is the source of moisture and the TC simply channels is worth discussing.
4) More research on the TRP mechanism needs to be conducted. Only the circulation field at 0000 UTC on the TRP day was selected for composite analysis without considering the development and evolution of the weather situation. Observational facts indicate that many TRP processes are accompanied by mesoscale systems; however, the generation, dissipation, and propagation of mesoscale systems during TRP have not been covered in this article.
AcknowledgementsThis study was supported by the Postgraduate Research & Practice Innovation Program of Jiangsu Province (No. KYCX22_1136), the National Natural Scientific Foundation of China (No. 42275037), the Basic Research Fund of CAMS (No. 2023Z016), and the Key Laboratory of South China Sea Meteorological Disaster Prevention and Mitigation of Hainan Province (No. SCSF202202). This study was supported by the Jiangsu Collaborative Innovation Center for Climate Change. We acknowledge the historical recorded precipitation data are archived by the China Meteorological Administration (CMA), http://data.cma.cn/, the historical best-track data from the Shanghai Typhoon Institute which is available at https://tcdata.typhoon.org.cn/zjljsjj_zlhq.html, the ERA5 reanalysis data which is available at https://cds.climate.copernicus.eu/cdsapp#!/dataset.
Atallah, E. H., and Bosart, L. F., 2003. The extratropical transition and precipitation distribution of hurricane Floyd (1999). Monthly Weather Review, 131(6): 1063-1081. DOI:10.1175/1520-0493(2003)131<1063:TETAPD>2.0.CO;2 (  0) 0) |
Bao, Y. Y., Li, Y., and Kang, Z. M., 2020. Characteristics and mechanism of monsoon circulation anomalies in extreme autumn rain over West China in 2017. Plateau Meteorology, 39(3): 560-569 (in Chinese with English abstract). DOI:10.7522/j.issn.1000-0534.2019.00056 (  0) 0) |
Buer, C. L., Zhuge, A. R., Xie, Z. W., Gao, Z. T., and Lin, D. W., 2022. Water vapor transportation features and key synoptic-scale systems of the ‘7.20’ rainstorm in Henan Province in 2021. Chinese Journal of Atmospheric Sciences, 46(3): 725-744 (in Chinese with English abstract). DOI:10.3878/j.issn.1006-9895.2202.21226 (  0) 0) |
Byun, K. Y., and Lee, T. Y., 2012. Remote effects of tropical cyclones on heavy rainfall over the Korean Peninsula – Statistical and composite analysis. Tellus A:Dynamic Meteorology and Oceanography, 64: 1. DOI:10.3402/tellusa.v64i0.14983 (  0) 0) |
Chen, J. K., and Ding, Z. Y., 2000. Mesoscale rainstorm system under the coupling of low-level and upper-level jets and typhoon circulation. Journal of Applied Meteorological Science, 11(3): 271-281 (in Chinese with English abstract). (  0) 0) |
Chen, L. S., 2006. The evolution on research and operational forecasting techniques of tropical cyclones. Journal of Applied Meteorological Science, 6: 672-681 (in Chinese with English abstract). (  0) 0) |
Chen, L. S., 2007. Research and forecast of landing tropical cyclone rainstorm. The 14th National Symposium on Tropical Cyclone Science. Chinese Meteorological Society, Shanghai, 3-7 (in Chinese with English abstract).
(  0) 0) |
Chen, L. S., and Xu, Y. L., 2017. Review of typhoon very heavy rainfall in China. Meteorological and Environmental Sciences, 40(1): 3-10 (in Chinese with English abstract). DOI:10.16765/j.cnki.1673-7148.2017.01.001 (  0) 0) |
Chen, L. S., Meng, Z. Y., and Cong, C. H., 2017. An overview on the research of typhoon rainfall distribution. Journal of Marine Meteorology, 37(4): 1-7 (in Chinese with English abstract). DOI:10.19513/j.cnki.issn2096-3599.2017.04.001 (  0) 0) |
Ching, J., Rotunno, R., LeMone, M., Martilli, A., Kosovic, B., Jimenez, P. A., et al., 2014. Convectively induced secondary circulations in fine-grid mesoscale numerical weather prediction models. Monthly Weather Review, 142(9): 3284-3302. DOI:10.1175/MWR-D-13-00318.1 (  0) 0) |
Cong, C. H., 2011. On the study of the mechanism of tropical cyclone remote precipitation. PhD thesis. Chinese Academy of Meteorological Sciences.
(  0) 0) |
Corbosiero, K., Dickinson, M., and Bosart, L., 2009. The contribution of eastern North Pacific tropical cyclones to the rainfall climatology of the Southwest United States. Monthly Weather Review, 137: 2415-2435. DOI:10.1175/2009MWR2768.1 (  0) 0) |
Ding, Y. H., Xi, G. Y., and Li, Y. H., 1987. A synoptic study of the ‘58·7’ persistent rainstorm over the middle Huang (Yellow) River. Scientia Atmospherica Sinica, 1987(1): 100-107 (in Chinese with English abstract). DOI:10.3878/j.issn.1006-9895.1987.01.11 (  0) 0) |
Ding, Z. Y., Zhang, X. Q., and He, J. H., 2001. The study of storm rainfall caused by interaction between the non-zonal high level jet streak and the far distant typhoon. Journal of Tropical Meteorology, 17(2): 144-154 (in Chinese with English abstract). (  0) 0) |
Ding, Z. Y., Zhao, X. H., Rui, X., and Gao, S., 2017. Statistical analysis of summer tropical cyclone remote precipitation events in East Asia from 2000 to 2009 and numerical simulation. Journal of Tropical Meteorology, 23(1): 37-46 (in Chinese with English abstract). DOI:10.16555/j.1006-8775.2017.01.004 (  0) 0) |
Farfán, L. M., and Fogel, I., 2007. Influence of tropical cyclones on humidity patterns over southern Baja California, Mexico. Monthly Weather Review, 135: 1208-1224. DOI:10.1175/MWR3356.1 (  0) 0) |
Foley, G. R., and Hanstrum, B. N., 1994. The capture of tropical cyclones by cold fronts off the west coast of Australia. Weather and Forecasting, 9(4): 577-592. DOI:10.1175/1520-0434(1994)009<0577:TCOTCB>2.0.CO;2 (  0) 0) |
Galarneau, T. J., Bosart, L. F., and Schumacher, R. S., 2010. Predecessor rain events ahead of tropical cyclones. Monthly Weather Review, 138(8): 3272-3297. DOI:10.1175/2010MWR3243.1 (  0) 0) |
Gray, W. M., 1979. Recent advance in tropical cyclone research from rawinsonde analysis. WMO Program on Research in Tropical Meteorology. Department of Atmospheric Science, Colorado State University, Fort Collins, Colorado 80523.
(  0) 0) |
Hou, J. Z., Wang, C., Lu, Y. P., Ning, Z. Q., and Du, J. W., 2006. Activity of typhoon and extreme rainstorms in Shaanxi Province. Journal of Tropical Meteorology, 2: 203-208 (in Chinese with English abstract). (  0) 0) |
Huang, X., Chan, J. C. L., Zhan, R., Yu, Z., and Wan, R., 2023. Record-breaking rainfall accumulations in eastern China produced by Typhoon In-fa (2021). Atmospheric Science Letters, 24(6): e1153. DOI:10.1002/asl.1153 (  0) 0) |
Huang, Y., and Lin, Y., 2014. A study on the structure and precipitation of Morakot (2009) induced by the central mountain range of Taiwan. Meteorology and Atmospheric Physics, 123(3): 115-141. DOI:10.1007/s00703-013-0290-4 (  0) 0) |
Hui, Y., 2016. A synoptic climatology of the bimodal precipitation in West China. PhD thesis. The University of Chinese Academy of Sciences (Institute of Earth Environment, CAS).
(  0) 0) |
Jia, L., Ding, C. C., Cong, C. H., Ren, F. M., and Liu, Y. N., 2023. An objective synoptic analysis technique for the identification of tropical cyclone remote precipitation in China and its application. Journal of Ocean University of China, accepted.
(  0) 0) |
Kang, L., Hao, L. P., Luo, L., Xu, L. N., and Xu, H. G., 2013. The analysis of the effect of typhoon 1002 on storm rainfall in Sichuan Basin. Journal of Tropical Meteorology, 29(1): 169-176 (in Chinese with English abstract). (  0) 0) |
Li, M., Gao, W. Y., Hou, J. Z., and Xiao, D. X., 2013. Analysis on a heavy rainstorm from southwest vortex moving toward northeast direction in Sichuan and Shaanxi Provinces. Plateau Meteorology, 32(1): 133-144 (in Chinese with English abstract). (  0) 0) |
Li, M. Y., 2020. Impact of upper trough on rapid intensification and remote heavy precipitation of typhoon. Master thesis. Chinese Academy of Meteorological Sciences.
(  0) 0) |
Li, Y., Chen, L. S., and Wang, J. Z., 2004. The diagnostic analysis on the characteristics of large scale circulation corresponding to the sustaining and decaying of tropical cyclone after it’s landfall. Acta Meteorologica Sinica, 62: 167-179 (in Chinese with English abstract). DOI:10.11676/qxxb2004.018 (  0) 0) |
Liang, X. D., Xia, R. D., Bao, X. H., Zhang, X., Wang, X. M., Su, A. F., et al., 2022. Preliminary Investigation on the extreme rainfall event during July 2021 in Henan Province and its multi-scale processes. Chinese Science Bulletin, 67: 997-1011 (in Chinese with English abstract). DOI:10.1360/TB-2021-0827 (  0) 0) |
Liu, L., and Wang, Y., 2020. Trends in landfalling tropical cyclone-induced precipitation over China. Journal of Climate, 33(6): 2223-2235. DOI:10.1175/JCLI-D-19-0693.1 (  0) 0) |
Lonfat, M., Marks, F. D., and Chen, S. S., 2004. Precipitation distribution in tropical cyclones using the tropical rainfall measuring mission (TRMM) microwave imager: A global perspective. Monthly Weather Review, 132(7): 1645-1660. DOI:10.1175/1520-0493(2004)132<1645:PDITCU>2.0.CO;2 (  0) 0) |
Lu, X. Q., Yu, H., Ying, M., Zhao, B. K., Zhang, S., Lin, L. M., et al., 2021. Western North Pacific tropical cyclone database created by the China Meteorological Administration. Advances in Atmospheric Sciences, 38(4): 690-699. DOI:10.1007/s00376-020-0211-7 (  0) 0) |
Moore, B. J., Bosart, L. F., Keyser, D., and Jurewicz, M. L., 2013. Synoptic-scale environments of predecessor rain events occurring east of the Rocky Mountains in association with Atlantic Basin tropical cyclones. Monthly Weather Review, 141(3): 1022-1047. DOI:10.1175/MWR-D-12-00178.1 (  0) 0) |
Peng, L., Zhao, Q., Qiao, D. Y., Zhang, X., Xu, H. T., and Ni, W., 2022. Comparative analysis on characteristics of rainstorms caused by northwest vortex in Shaanxi with and without influence of typhoon. Journal of Arid Meteorology, 40(6): 981-992 (in Chinese with English abstract). DOI:10.11755/j.issn.1006-7639(2022)-06-0981 (  0) 0) |
Ran, L. K., Li, S. W., Zhou, Y. S., Yang, S., Ma, S. P., Zhou, K., et al., 2021. Observational analysis of the dynamic, thermal, and water vapor characteristics of the ‘7.20’ extreme rainstorm event in Henan Province. Chinese Journal of Atmospheric Sciences, 45(6): 1366-1383 (in Chinese with English abstract). DOI:10.3878/j.issn.1006-9895.2109.21160 (  0) 0) |
Rao, C. H., Bi, X. X., Chen, G. H., and Yu, Z. F., 2022. A numerical simulation on the impacts of the offshore typhoons on water vapor flux, dynamic and thermal conditions of the extreme rainstorm event in Henan Province in July 2021. Chinese Journal of Atmospheric Sciences, 46(6): 1577-1594 (in Chinese with English abstract). DOI:10.3878/j.issn.1006-9895.2204.21255 (  0) 0) |
Rao, C. H., Chen, G. H., and Ran, L. K., 2023. Effects of Typhoon In-Fa (2021) and the western Pacific subtropical high on an extreme heavy rainfall event in central China. Journal of Geophysical Research:Atmospheres, 128: e2022JD037924. DOI:10.1029/2022JD037924 (  0) 0) |
Ren, F., Wang, Y., Wang, X., and Li, W., 2007. Estimating tropical cyclone precipitation from station observations. Advances in Atmospheric Sciences, 24(4): 700-711. DOI:10.1007/s00376-007-0700-y (  0) 0) |
Ren, F. M., and Yang, H., 2019. An overview of advances in typhoon rainfall and its forecasting researches in China during the past 70 years and future prospects. Torrential Rain and Disasters, 38(5): 526-540 (in Chinese with English abstract). (  0) 0) |
Rodgers, E. B., Adler, R. F., and Pierce, H. F., 2001. Contribution of tropical cyclones to the North Atlantic climatological rainfall as observed from satellites. Journal of Applied Meteorology, 40(11): 1785-1800. DOI:10.1175/1520-0450(2001)040<1785:COTCTT>2.0.CO;2 (  0) 0) |
Schumacher, R. S., and Galarneau, T. J., 2012. Moisture transport into midlatitudes ahead of recurving tropical cyclones and its relevance in two predecessor rain events. Monthly Weather Review, 140(6): 1810-1827. DOI:10.1175/MWR-D-11-00307.1 (  0) 0) |
Sun, J. H., Qi, L. L., and Zhao, S. Y., 2006. A study on mesoscale convective systems of the severe heavy rainfall in North China by ‘9608’ typhoon. Acta Meteorologica Sinica, 64(1): 57-71 (in Chinese with English abstract). (  0) 0) |
Sun, J. H., Zhang, X. L., Wei, J., and Zhao, S. X., 2005. A study on severe heavy rainfall in North China during the 1990s. Climatic and Environmental Research, 10(3): 492-506 (in Chinese with English abstract). DOI:10.3878/j.issn.1006-9585.2005.03.20 (  0) 0) |
Sun, S. Q., and Wei, W. X., 1995. Tropical cyclones and heavy rainfall in Hebei Province. Meteorological Monthly, 21(7): 34-37 (in Chinese with English abstract). (  0) 0) |
Sun, S. Q., and Zhai, G. Q., 1980. Qn the instability of the low level jet and its trigger function for the occurrence of heavy rain-storms. Chinese Journal of Atmospheric Sciences, 4(4): 327-337 (in Chinese with English abstract). DOI:10.3878/j.issn.1006-9895.1980.04.05 (  0) 0) |
Tao, S. Y.,, 1980. Heavy Rainfalls in China. Science Press, Beijing, 225pp (in Chinese).
(  0) 0) |
Wang, D. H., Zhong, S. X., Liu, Y., Li, J., Hu, K., Yang, S., et al., 2007. Advances in the study of rainstorm in Northeast China. Advances in Earth Science, 6: 549-560 (in Chinese with English abstract). (  0) 0) |
Wang, Y., Wang, Y. Q., and Fudeyasu, H., 2009. The role of typhoon Songda (2004) in producing distantly located heavy rainfall in Japan. Monthly Weather Review, 137(11): 3699-3716. DOI:10.1175/2009MWR2933.1 (  0) 0) |
Wang, Y. Q., Rao, Y. J., Tan, Z. M., and Schönemann, D., 2015. A statistical analysis of the effects of vertical wind shear on tropical cyclone intensity change over the western North Pacific. Monthly Weather Review, 143(9): 3434-3453. DOI:10.1175/MWR-D-15-0049.1 (  0) 0) |
Waylen, P. R., and Harrison, M. J., 2005. The coincidence of daily rainfall events in Liberia, Costa Rica and tropical cyclones in the Caribbean Basin. International Journal of Climatology, 25: 1665-1674. DOI:10.1002/joc.1241 (  0) 0) |
Wu., M. F., Cao, L. L., Ma, R. Y., Ji, Q., and Wu, Y. J., 2015. Diagnostic analysis of a case on interaction between landed typhoon and Northwest China vortex. Torrential Rain Disaster, 34(4): 309-315 (in Chinese with English abstract). (  0) 0) |
Xie, J. N., and Zhuo, G., 2000. The influence of typhoon activities on drought on northeast side of Qinghai-Xizang Plateau. Plateau Meteorology, 19(2): 244-252 (in Chinese with English abstract). (  0) 0) |
Xing, R., 2015. Research on the relationship among tropical cyclone, subtropical high and predecessor rain events. PhD thesis. Nanjing University of Information Science and Technology.
(  0) 0) |
Xu, H., Li, X., Yin, J., and Zhang, D., 2023. Predecessor rain events in the Yangtze River Delta region associated with South China Sea and Northwest Pacific Ocean (SCS-WNPO) tropical cyclones. Advances in Atmospheric Sciences, 40(6): 1021-1042. DOI:10.1007/s00376-022-2069-3 (  0) 0) |
Xu, H. X., Xu, X. D., Zhang, S. J., and Fu, Z. K., 2014. Long-range moisture alteration of a typhoon and its impact on Beijing extreme rainfall. Chinese Journal of Atmospheric Sciences, 38(3): 537-550 (in Chinese with English abstract). DOI:10.1007/s00376-022-2069-3 (  0) 0) |
Yang, H., 2019. Research on the climate characteristics of tropical cyclone precipitation in China from 1960 to 2017. Master thesis. Chinese Academy of Meteorological Sciences.
(  0) 0) |
Yang, X. X., Chen, L. S., Liu, S. J., Xue, D. Q., and Chen, W. X., 2008. A study of the far distance tropical cyclone torrential rainfalls in Shandong Province. Acta Meteorologica Sinica, 66(2): 236-250 (in Chinese with English abstract). (  0) 0) |
Ying, M., Zhang, W., Yu, H., Lu, X. Q., Feng, J. X., Fan, Y. X., et al., 2014. An overview of the China Meteorological Administration tropical cyclone database. Journal of Atmospheric and Oceanic Technology, 31(2): 287-301. DOI:10.1175/JTECH-D-12-00119.1 (  0) 0) |
Yu, J. H., Zheng, Y. Q., Wu, Q. S., Lin, J. G., and Gong, Z. B., 2013. K-means clustering method for classification of the northwestern Pacific tropical cyclone tracks. Journal of Tropical Meteorology, 29(4): 607-615. (  0) 0) |
Yu, J. Q., 2021. Study on a tropical cyclone precipitation in the Yangtze River Delta. Master thesis. Nanjing University of Information Science and Technology.
(  0) 0) |
Yu, T. F., Li, C., and Shi, J., 2022. Analysis on water vapor transport characteristics of ‘7·20’ extreme rainstorm in Zhengzhou. Journal of Marine Meteorology, 42(3): 69-76 (in Chinese with English abstract). DOI:10.19513/j.cnki.issn2096-3599.2022.03.007 (  0) 0) |
Yu, X. D., 2012. Investigation of Beijing extreme flooding event on July 2012. Meteorological Monthly, 38(11): 1313-1329 (in Chinese with English abstract). (  0) 0) |
Yuan, J. P., Zhao, D., Yang, R. W., and Yang, H. F., 2018. Predecessor rain events over China’s low-latitude highlands associated with Bay of Bengal tropical cyclones. Climate Dynamics, 50(3): 825-843. DOI:10.1007/s00382-017-3643-8 (  0) 0) |
Zhang, Y. B., Wu, M. F., Hou, J. Z., Bai, Q. M., and Chen, X. T., 2014. Moisture comparative analysis on typhoon remote rainstorm prosesses in the eastern region of Northwest China. Journal of Arid Meteorology, 2014(5): 788-797 (in Chinese with English abstract). (  0) 0) |
Zhao, D., Yu, Y. B., and Chen, L. S., 2021. Impact of the monsoonal surge on extreme rainfall of landfalling tropical cyclones. Advances in Atmospheric Sciences, 38(5): 771-784. DOI:10.1007/s00376-021-0281-1 (  0) 0) |
Zhu, H. Y., Chen, L. S., and Xu, X. D., 2000. A numerical study of the interactions between typhoon and mid-latitude circulation and its rainfall characteristics. Chinese Journal of Atmospheric Sciences, 24(5): 669-675 (in Chinese with English abstract). DOI:10.3878/j.issn.1006-9895.2000.05.11 (  0) 0) |
Zhuo, G., Xie, J. N., and Ma, J. X., 2000. Statistical relations between typhoon activity and precipitation in China. Plateau Meteorology, 19(2): 260-264 (in Chinese with English abstract). (  0) 0) |
 2024, Vol. 23


