2) Kunming Shipborne Equipment Research and Test Center, China Shipbuilding Industry Corporation, Kunming 650051, China
The rate of oil and gas discovery in deepwater areas around the world continues to increase. With the increase in water depths, the implementation of structural systems for offshore oil production is becoming more complex. In these conditions, which are often associated with severe en- vironmental loads, one of the greatest challenges is developing a riser system that is capable of withstanding the high stresses imposed on the structure (Martins et al., 2013).
Many scholars have carried out a series of research on risers. Shen et al. (2014) optimized the reliability of composite steel catenary risers (SCRs) and compared the deterministic optimization results by the Monte Carlo method. Chunguang Wang et al. (2015) performed a tailed local design for deep-sea fiber-reinforced polymer composite risers. Chunguang Wang et al. (2016) introduced a composite riser optimization design method. They verified the optimal designs using finite element analysis under local and global design requirements and compared their results with those of other design methods. Chen et al. (2012) performed a numerical study on vortex-induced vibration, considering a flexible riser model and focusing on the effects of internal flow. Based on computational fluid dynamics, Chen et al. (2017) studied the effects of mass ratio on vortex-induced vibration of a rigid cylinder.
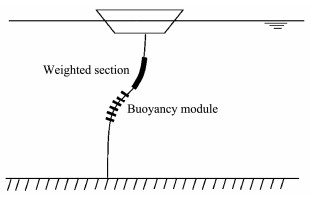
The impact of ultra-deepwater on the design of risers requires the development of new alternative riser configurations to overcome the barriers imposed by deepwater fields on oil exploitation in an efficient, safe, and economical manner. An example of a non-classical riser configuration is the compliant vertical access riser (CVAR) shown in Fig.1, where a lower-tension riser configuration is fixed to a floating platform while providing dry tree vertical access to the wellbore. The characteristic geometrical shape of this riser is achieved by adding special elements such as syntactic buoyancy and additional weights, which must be appropriately positioned along the riser. The main feature of a CVAR is an almost neutrally buoyant central region near an inflection point, which tends to isolate the motions of the upper region from those of the lower region of the riser (Kuroiwa and Nishigaki, 2002; Chris et al., 2004).
|
Fig. 1 Schematic illustrating a compliant vertical access riser. |
Studies on the CVAR are few compared with those on the top-tensioned riser, steel catenary riser, and flexible riser. One study focused on the conceptual design stage, mainly for the waters of the Gulf of Mexico. Thus, Chris et al. (2004) proposed the concept of a semi-submersible platform combined with a CVAR for the Gulf of Mexico, in an application area below 2438.4 m; the authors conducted extreme response analysis and fatigue analysis to demonstrate the technological feasibility of the CVAR. Kuroiwa and Nishigaki (2002) also proposed a unique floating production storage and offloading (FPSO) design concept called CVAR-FPSO and studied the interaction between the CVAR and tubing. Martins et al. (2012) optimized a CVAR design using the non-dominated sorting genetic algorithm Ⅱ (NSGA-Ⅱ) method and design of experiments (DOE), and several key parameters of the CVAR were analyzed and compared before the optimal solution for the dynamic response was designed. Martins et al. (2013) used the DOE method to analyze the test results, and they dynamically optimized the CVAR based on the multi-island genetic algorithm (MIGA).
In this study, considering the geometric nonlinearity, the CVAR model was deduced according to the principles of virtual work and variation. Compared with other single-objective optimizations, such as optimization of riser weight reduction, this study is innovative as it considers multi-objective optimization (riser weight, stress, and mini mum radius).
2 Theoretical Basis 2.1 Two-Dimensional (2D) Nonlinear Static CVAR ModelThe CVAR geometry is nonlinear. In the updated Lagrange coordinate system, the variation principle and virtual work principle are used to derive the CVAR vibration equation. Finally, the CVAR static analysis model is obtained. The static model adopted in this work consists of a static equilibrium equation and a constraint equation. For the CVAR in deepwater environments, only axial deformation and bending deformation are considered. The virtual work equation is presented, which includes gravity, structural drag, hydrodynamic, and inertia force. The deformation equation can be determined according to the study by Wu (2015). Thus, the 2D governing equations of the static model are as follows:
| $ \begin{array}{l} {\rm{ \mathsf{ δ} \mathsf{ π} }} = \int\limits_{{\alpha _0}}^{{\alpha _t}} {\{ [{T_e}(\frac{{x_s^\prime }}{{s_s^\prime }}) - {B_s}(\frac{{{\kappa ^2}x_s^\prime }}{{s_s^\prime }} + \frac{{s_s^\prime }}{{s_s^{\prime 3}}}\frac{\partial }{{\partial \alpha }}(\frac{{x_s^\prime }}{{s_s^\prime }}))][\delta x_s^\prime + {T_e}(\frac{{y_s^\prime }}{{s_s^\prime }}) -\\ {B_s}(\frac{{{\kappa ^2}y_s^\prime }}{{s_s^\prime }} + \frac{{s_s^{\prime \prime }}}{{s_s^{\prime 3}}}\frac{\partial }{{\partial \alpha }}(\frac{{{y_s}}}{{s_s^\prime }}))]\delta y_s^\prime \} {\rm{d}}\alpha + } \\ \;\;\;\;\;\;\int\limits_{{\alpha _0}}^{{\alpha _t}} {\{ [\frac{{{B_s}}}{{s_s^2}}\frac{\partial }{{\partial \alpha }}(\frac{{x_s^\prime }}{{s_s^\prime }})]\delta x_s^{\prime \prime } + [\frac{{{B_s}}}{{s_s^{\prime 2}}}\frac{\partial }{{\partial \alpha }}(\frac{{y_s^\prime }}{{s_s^\prime }})]\delta y_s^{\prime \prime }\} d\alpha - }\\ \;\;\;\;\;\int\limits_{{\alpha _0}}^{{\alpha _t}} {\{ [\frac{{x_s^\prime }}{{s_s^\prime }}{f_{Ht}} + \frac{{y_s^\prime }}{{s_s^\prime }}{f_{Hn}} - {m_i}\frac{{\kappa y_s^\prime U_i^2}}{{s_s^\prime }}]\delta {x_s} - } \\ \;\;\;\;\;\;\;[\frac{{y_s^\prime }}{{s_s^\prime }}{f_{Ht}} - \frac{{x_s^\prime }}{{s_s^\prime }}{f_{Hn}} + {m_i}\frac{{\kappa x_s^\prime U_i^2}}{{s_s^\prime }} - \frac{{{w_e}}}{{1 + {\varepsilon _s}}}]\delta {y_s}\} s_s^\prime {\rm{d}}\alpha, \end{array} $ | (1) |
| $\int\limits_{{\alpha _0}}^{{\alpha _t}} {\left[ {\frac{1}{2}\left({{x_{\rm{s}}}{\prime ^2} + {y_s}{\prime ^2} - 1} \right) - \frac{{{T_e} - 2\nu \left({{\rho _e}{A_e} - {\rho _i}{A_i}} \right) + {m_i}U_i^2}}{{EA}}} \right]{\rm{d}}\alpha = 0}, $ | (2) |
where xs and ys represent horizontal and vertical coordinates, respectively; ss represents riser length; κ is the curvature of the riser; fHt is the hydrodynamic force in the X direction; fHn is the hydrodynamic force in the Y direction; mi is the internal fluid mass per unit length; ρe and ρi are the external and internal fluid densities, respectively; and Ae and Ai are the external and internal cross-sectional areas of the riser, respectively. Here Bs=EIr(1+εd). The effective gravity we = (ρrAr-ρeAe+ρiAi)g, where ρr is riser density and Ar is the riser cross-sectional area. According to Chuchejpgakul et al. (2003), the effective tension Te can be parameterized as
| ${T_e} = T + 2\nu ({P_e}{A_e} - {P_i}{A_i}), $ | (3) |
where T represents the wall tension, v is Poisson's ratio, and Pe and Pi are the external and internal pressures, respectively.
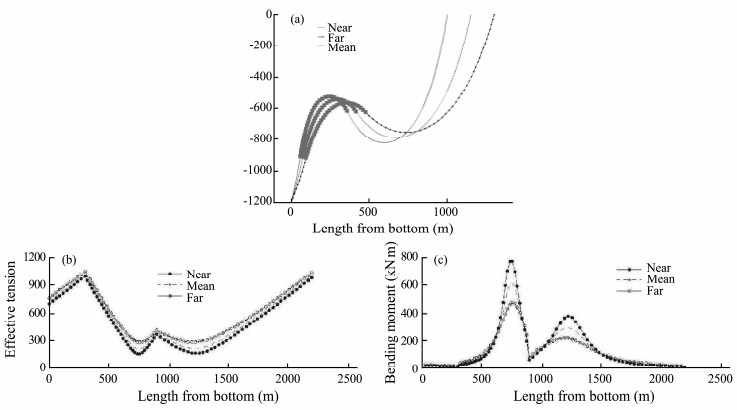
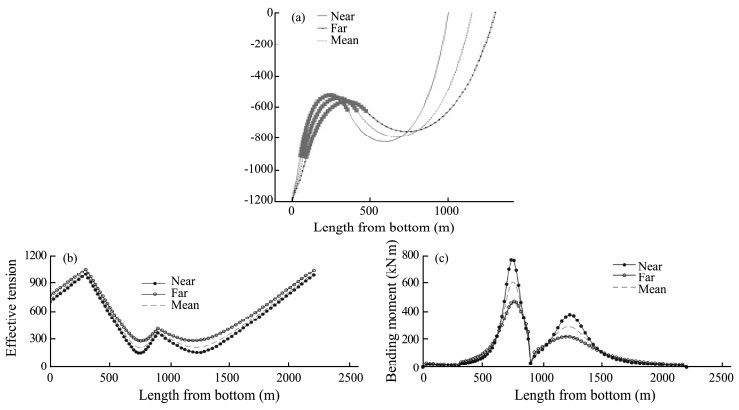
2.2 Comparative ResultsBased on Eqs. (1) and (2), we used the MATLAB software to write a finite element program so that we could calculate the static configuration, effective tension, and bending moment distribution of the SCR (Figs. 2 and 3). The results calculated using this finite element approach are similar to those already present in the literature (Chen, 2011); they have the same configuration, and all show that the effective top tension of the far-end is about 1030 kN, while the largest bending moment of the near-end is almost 775 kN m. These measurements also reveal that the highest point of the buoyancy module riser occurs about 740 m from the pipe bottom. Thus, the finite element program designed and used in this study is both correct and effective and can be applied to analyze the nonlinear static CVAR mechanics.
|
Fig. 2 Chen's results. (a) Equilibrium configuration. (b) Effective tension force along the riser bottom. (c) Moment along the riser bottom. |
|
Fig. 3 The results presented in this study. (a) Equilibrium configuration. (b) Effective tension force along the riser bottom. (c) Moment along the riser bottom. |
The optimization design process in this study involves an experimental design, an agent model, multi-objective optimization theory, and an algorithm. In daily life or practical engineering, people often encounter problems where multiple goals must be simultaneously satisfied in a given area. However, conflicts generally exist among the objective functions and an optimal solution cannot be found; thus, multiple targets optimal solutions are found (Tanse, 1989; Xie et al., 2003).
In most cases, the multi-objective optimization problem (MOP) does not have an optimal solution (i.e.., the solution is not unique), and this is the most important feature that makes it different from the single-objective optimization problem. An optimal solution for an objective function is likely to reduce the performance of the other objective functions. Thus, to solve the MOP, a compromise is reached among the various objective functions. In the absence of more prior information, it is not possible to conclude which objective is most important (Huang, 2018; Tian, 2018).
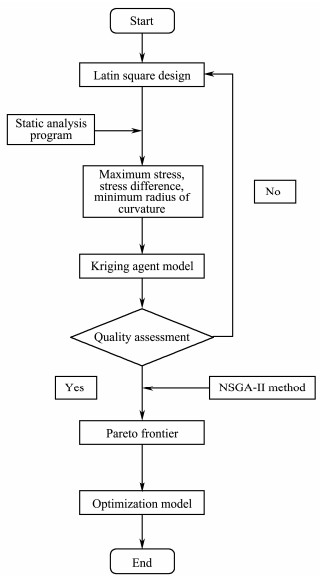
Fig.4 illustrates the optimization design process. First, Latin square test designs (Liu et al., 2011) are used to analyze the CVAR to obtain the maximum stress, stress difference, and minimum radius of the curvature. Afterward, the Kriging agent model (Jones, 1998; Lophaven et al., 2002) is built based on the static analysis results. The basic idea of the Kriging method is to predict the value of a function at a given point by computing a weighted average of the known values of the function in the neigh- borhood of the point. The model is evaluated to determine its quality in terms of accuracy, where the mean square error (MSE) and multiple correlation coefficient are quantified. The model is then optimized using the NSGA-Ⅱ method based on the riser parameters and buoyancy block parameters (Deb et al., 2002). Elitist non-dominated sorting genetic algorithm (NSGA-Ⅱ) is a well-known multi- objective optimization algorithm whose main feature is the use of Pareto dominance relation and a diversity maintenance mechanism for fitness evaluation together with some sort of elitism. Finally, multi-objective optimization theory is employed to further optimize the model and obtain the results for the Pareto front, where the optimized results correspond to a more economical and safer design.
|
Fig. 4 Flowchart illustrating the MOP for CVAR. |
During the CVAR operation, the floating platform will produce a hull offset under the influence of the wave force, which will inevitably lead to changes in the riser shape and stress. When the hull is offset, the fixed- supported CVAR exhibits greater bending stress. Due to the special geometry of the CVAR, the buoyancy of the buoyancy block exhibits high curvature, and these areas are high-stress regions. The high-stress zone also exhibits high variation in the stress difference when the float is shifted. To optimize this design, the thickness of the riser needs to be increased in the high-stress area and reduced in the other positions in order to reduce the weight loss of the riser and the stress difference caused by the vertical displacement of the riser.
3.1 Model Parameters and Mathematical Optimization Model 3.1.1 Model parametersThe parameters used for finite element modeling before optimization are presented in Table 1.
|
|
Table 1 Parameters for the CVAR model |
1) Objective function
There are two optimization targets: the riser weight loss, which can be calculated directly from the formula according to the design variables, and the stress difference (the stress difference is the riser stress difference when the float motion is at a positive or negative 5 m heave offset). The objective function is established by Kriging interpolation to avoid the time-consuming finite element model calculations by repeated call static analysis.
2) Design variables
The riser outer diameter and wall thickness are important parameters that affect the stress difference of the riser and the total weight of the riser, and a balance between the two is needed in the actual project. Therefore, the design variables are the riser diameter and wall thickness. The wall thickness variable has two values: for the high- stress zone with a large pipe wall thickness and the low- stress zone with a lower pipe thickness.
3) Constraints
To ensure the safety of the riser, the stress needs to be kept within the allowable range; thus, σmax < σr/Sc. The CVAR can operate the well directly from the platform; therefore, the minimum curvature radius of the CVAR should be controlled to ensure its smooth operation.
4) Determination of the optimization model
The mathematical optimization model can be expressed as follows:
| ${\rm{min }}\;F\left({{D_e}, t, T} \right) = \left({{f_1}\left({{D_e}, t, T} \right), {f_2}\left({{D_e}, t, T} \right)} \right), $ |
| ${\rm{s}}.{\rm{t}}.\left\{ \begin{array}{l} {\sigma _{{\rm{max}}}} < {\sigma _r}/{S_c}\\ {R_{{\rm{min}}}} < \left[ {{R_{{\rm{min}}}}} \right]\\ 0.3 \le {D_e} \le 0.5\\ 0.015 \le t, T \le 0.045 \end{array} \right., $ | (4) |
where [Rmin] is the minimum radius of curvature allowed for operating the well, and Sc is the safety factor; the function f1 is established by the Kriging interpolation model, and f2 is the total weight of the riser.
3.2 Calculation of the Optimization Results 3.2.1 Kriging agent model formulationThe optimization design variable was used as the input for the Kriging interpolation model, and the response at the sample test point was calculated as the output obtained by finite element calculation. The first 25 test samples were used as modeling data, and the last 5 were used as test model data to evaluate the quality of the approximate model. To reflect the strong nonlinearity of CVAR, suitable Gauss correlation functions for parabolic simulations were selected. After importing the sample into the MATLAB calculation program for the Kriging agent model, the response values were calculated for the sample test points. The results are presented in Table 2.
|
|
Table 2 The response of Latin square test sample points |
The accuracy of the agent model was evaluated by calculating the MSE and the multiple correlation coefficient (R2).
Mean Square Error
| $MSE = \frac{1}{{{N_{{\rm{test}}}}}}\mathop \sum \limits_{i = 1}^{{N_{{\rm{test}}}}} {\left({{y_i} - {{\hat y}_i}} \right)^2}.$ | (5) |
Multiple Correlation Coefficient (R2)
| ${R^2} = 1 - \frac{{\mathop \sum \limits_{i = 1}^{{N_{test}}} {{\left({{y_i} - {{\hat y}_i}} \right)}^2}}}{{\mathop \sum \limits_{i = 1}^{{N_{test}}} {{\left({{y_i} - {{\bar y}_i}} \right)}^2}}}, $ | (6) |
where
|
|
Table 3 shows that the MSE was low for the test sample points, and R2 was close to 1. Therefore, the experimentally designed Kriging interpolation agent model exhibited good accuracy.Table 3 Quality evaluation parameters for the agent model |
During the actual design optimization process, the decision maker often makes subjective interventions and may wish to target a goal or multiple goals considered equally important. Thus, during the optimization process, the two objectives were assumed to be equally important, and the weighting coefficient method was used to convert the MOP into a single-objective problem. Therefore, the weighting coefficients were 0.5 and 0.5. To avoid the optimization of a local optimum, MIGA was used to introduce migration to increase the diversity of the optimal solution during the evolution of the population. In this study, the evolutionary algebra was set to 200, and the number of islands was 5. The mobility and migration algebra are guaranteed to obtain the global optimal solution. In the population evolution, the generation gap can ensure that the unsuitable individuals are continuously eliminated. The crossover probability and the mutation probability were set to ensure the diversity of evolutionary processes. Table 4 presents the relevant parameter settings for MIGA.
|
|
Table 4 Parameters setting for MIGA |
During the CVAR operation, the floating platform will produce a hull offset under the influence of the wave force; this will inevitably lead to changes in the riser shape and stress. When the hull is offset, the fixed- supported CVAR exhibits greater bending stress. Due to the special geometry of the CVAR, the buoyancy of the buoyancy block exhibits high curvature, and these areas are high-stress regions. The high-stress zone also exhibits high variation in the stress difference when the float is shifted. To optimize this design, the riser thickness should be increased in the high-stress area and reduced in the other positions in order to reduce the weight loss of the riser and the stress difference caused by the vertical displacement of the riser.
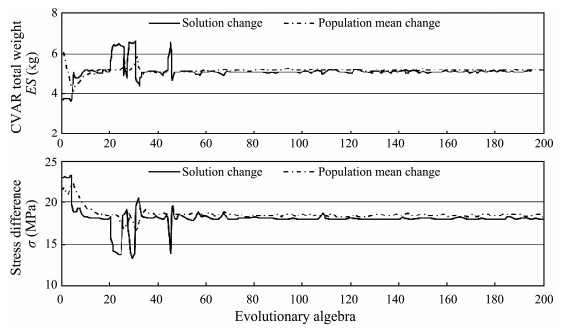
Fig.5 illustrates the changes in total weight and stress difference for the CVAR as the population evolved. The population evolved rapidly for about 50 generations. Each objective function was close to optimal, thereby indicating that the elite mechanism improved the fitness of the offspring population and the population evolution rate. According to the changes in the population mean and solution, the gap between the two was low and it remained at a stable level after 50 generations of evolution. Thus, the population was relatively stable during the evolution process, and the global optimization process was effectively controlled by the algorithm.
|
Fig. 5 Objective function changes with population evolution. |
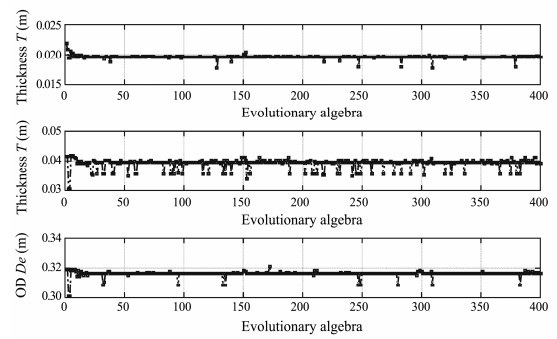
Fig.6 shows the detailed iterative optimization of the design variables, which indicates that the optimized outer diameter of the riser was closer to the lower bound of the design range. Here, T is the wall thickness of the high- stress sections, including the CVAR ends and the transition section (three sections), while t is the wall thickness of other low-stress riser sections (two sections). Thus, the outside diameter of the riser has a greater impact on the target because reducing the outer diameter of the riser can significantly reduce the total weight of the CVAR.
|
Fig. 6 Iterative optimization of the design parameters. |
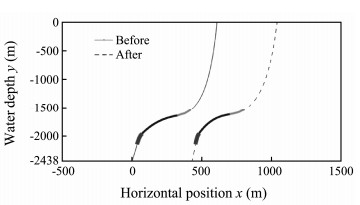
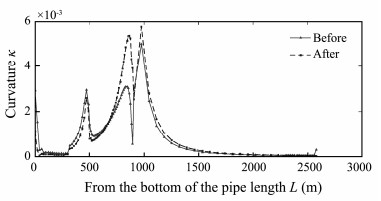
The CVAR static analysis finite element program was used to calculate the optimal design variables, and Figs. 7 and 8 illustrate the static configuration and the curvature distribution for the CVAR before and after optimization, respectively. The transition between the optimized buoyant block region and the upper region was not sufficiently smooth, resulting in a great change in the curvature in this region. After optimization, although the curvature increased (still within the allowable range), the change in the curvature was reduced, indicating an increase in the smoothness of the geometric configuration of the riser, and the transition between the buoyancy block region and the upper region was good.
|
Fig. 7 Unoptimized and optimized distribution of the static configuration for the CVAR. |
|
Fig. 8 Unoptimized and optimized distribution of the CVAR's curvature along the pipe length. |
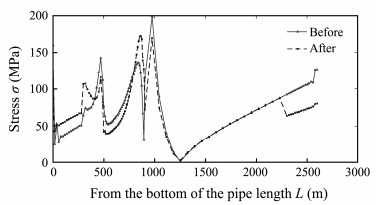
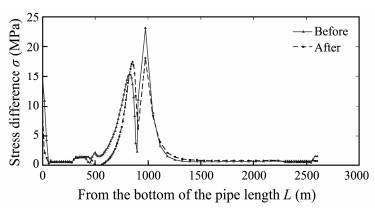
Fig.9 illustrates the unoptimized and optimized distribution of stress for the CVAR, and Fig.10 shows the unoptimized and optimized distribution of the stress difference along the pipe length for the CVAR. According to Fig.9, after optimization, the stress distribution for the riser featured several obvious points with changes in stress, which are attributable to changes in the cross section of the different pipe sections after optimizing the riser. The stress distribution was more uniform after optimization. The wall thickness of the riser section increased, which will increase the bending stiffness and axial stiffness of the section. Therefore, it can be seen from Fig.9 that the maximum stress of the riser significantly reduced. As shown in Fig.10, the difference in stress followed the same trend: the difference in the local stress was increased, but the maximum difference in stress was improved for the whole riser.
|
Fig. 9 Unoptimized and optimized distribution of stress for the CVAR. |
|
Fig. 10 Unoptimized and optimized distribution of the difference in stress along the pipe length for the CVAR. |
Table 5 presents the results for several key nodes on the CVAR before and after optimization. After optimization, the total weight of the riser was reduced by 199740.1 kg, the maximum stress was reduced by 26.7 MPa, and the top and bottom stresses were reduced by 46.28 MPa and 70.32 MPa, respectively. After optimization, the maxi- mum stress difference value of the buoyancy block region was optimized from 23.05 MPa to 18.15 MPa, and the bottom of the riser was also optimized. The minimum curvature radius of the riser was 172.5 m. This indicates that after optimizing the design, the total weight of the riser was controlled, and the key nodes and the stress of the whole riser were greatly improved; therefore, the stress level and the minimum radius of curvature were controlled within the allowable range.
|
|
Table 5 Comparison of the initial and optimized parameters |
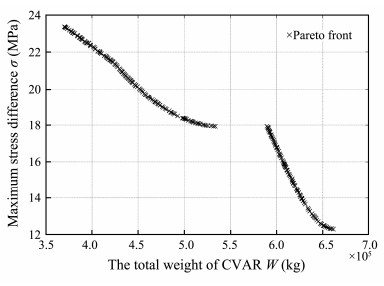
The multi-objective optimization of the Pareto frontier for the CVAR is illustrated in Fig.11. The corresponding information for the design variable was stored in the final population, and the specific value of the design variable was obtained by decoding. The design variables obtained using the weighting coefficient method were mapped to the two objective function values. After comparing the Pareto frontier, we can see that the weighting coefficient method was the only specific Pareto optimal solution on the Pareto front. For the initial design of the riser, the total weight and the stress difference are 7.12 × 10⁵ kg and 23.05 MPa, respectively, which are obviously far from the Pareto frontier. Thus, the initial design is not ideal, which is why the stress and weight can be improved greatly. However, when the optimized design variables were used, the total weight distribution was broad for the riser, and the difference was up to 3.2 × 10⁵ kg, while the maximum difference in stress was less than 10 MPa. This also explains why the lower bound of the optimized outer diameter of the riser was closer to the designed area. In summary, the optimized difference in stress was limited for the riser, but the optimized total weight range was broader.
|
Fig. 11 Pareto frontier for the MOP based on the riser parameters. |
In this study, we investigated the static optimization of a deepwater CVAR. Based on the existing optimization design method, a multi-objective optimization design process was proposed for the CVAR to reduce the riser weights and stress levels. After optimizing the riser parameters, the geometry of the riser became smoother. The transition between the buoyancy block area and the upper area was good, and the angle at which the riser exited the wellhead was improved. This greatly facilitated the direct operation of CVAR on the well. After optimization, the stress distribution of the riser was more uniform; the maximum stress of the riser was significantly reduced, by 13.5%; and the maximum pressures at the top and bottom decreased by 36.6% and 44%, respectively. Similarly, the stress difference of the corresponding area was greatly increased; the maximum stress for the buoyancy block region was reduced by 21.2%. In addition, the curvature of the riser was reduced, the total quality of the riser was controlled, and the stress decreased by 28.1%, which reflected the optimal economic design.
AcknowledgementsThis research was funded by the National Natural Science Foundation of China (No. 51579245), and the National Key R & D Program of China (No. 2016YFC0303 800). The authors gratefully acknowledge their financial support.
Chen, H. F., 2011. Nonlinear static and dynamic analyses of deepwater flexible risers. Master thesis. Ocean University of China.
(  0) 0) |
Chen, Z. S., Kim, W.-J. and Xiong, C. B., 2012. Effect of upward internal flow on dynamics of riser model subject to shear current. China Ocean Engineering, 26(1): 95-108. DOI:10.1007/s13344-012-0007-3 (  0) 0) |
Chen, Z. S., Zhao, Z. W. and Zhang, G. H., 2017. Effects of mass ratio on vortex-induced vibration of a rigid cylinder. Journal of Vibration and Shock, 36(11): 248-254. (  0) 0) |
Chris, M., Kevin, H., Shankar, B., David, A., Indranil, S., Jack, W., and Houston, N. M., 2004. Semisubmersible based dry tree platform with compliant vertical access risers. Offshore Technology Conference. Houston, Texas, 1-13.
(  0) 0) |
Chucheepsakul, S., Monprapussom, T. and Huang, T., 2003. Large strain formulations of extensible flexible marine pipes transporting fluid. Journal of Fluids and Structures, 17(2): 185-224. DOI:10.1016/S0889-9746(02)00116-0 (  0) 0) |
Deb, K., Member, A., Pratap, A. and Meyarivan, T., 2002. A fast elitist multi-objective genetic algorithm: NSGA-Ⅱ. IEEE Transactions Evolutionary Computation, 6(2): 182-197. (  0) 0) |
Huang, X. B., 2018. Solving the problem of multi-objective flexible job shop based on hybrid genetic algorithm and particle swarm optimization. Advances in Intelligent Systems Research, 8: 190-193. (  0) 0) |
Jones, D. R., Schonlau, M. and Welch, W. J., 1998. Efficient global optimization of expensive black-box functions. Journal of Global Optimization, 13: 445-492. DOI:10.1023/A:1008354314309 (  0) 0) |
Kuroiwa, T., and Nishigaki, M., 2002. Interaction between riser and tubing in CVAR system. Proceedings of the Twelfth International Offshore and Polar Engineering Conference. Havaii, 26-31.
(  0) 0) |
Liu, X. L., Chen, Y. W., Jin, X. R. and Yang, D. S., 2011. Optimized latin hypercube sampling method and its application. Journal of National University of Defense Technology, 33(5): 73-77. (  0) 0) |
Lophaven, S. N., Nielsen, H. B., and Sondergaard, J., 2002. DACE-A Marlab Kriging Toolbox informatics and mathematical modelling. ERCIM Copenhagen Meeting. Copenhagen, Denmark, 20-33.
(  0) 0) |
Martins, M. A. L., Lages, E. N. and Silveira, E. S. S., 2012. Deepwater compliant vertical access riser response optimization. International Journal of Modeling and Simulation for Petroleum Industry, 6(2): 9-21. (  0) 0) |
Martins, M. A. L., Lages, E. N. and Silveira, E. S. S., 2013. Compliant vertical access riser assessment: DOE analysis and dynamic response optimization. Applied Ocean Research, 41: 28-40. DOI:10.1016/j.apor.2013.02.002 (  0) 0) |
Shen, Q. X., Yang, H. Z. and Zhu, Y., 2014. Reliability-based design optimization of deep-water composite catenary risers. Chinese Journal of Ship Research, 9(5): 77-84. (  0) 0) |
Tanese, R., 1989. Distributed genetic algorithms for function optimization. PhD thesis. University of Michigan.
(  0) 0) |
Tian, Y., 2018. Solving complex multi-objective optimization problems by evolutionary algorithms. PhD thesis. University of Anhui.
(  0) 0) |
Wang, C. G., Krishna, S., Muhammad, A. A. and Evgeny, V. M., 2016. Surrogate-assisted optimization design of composite riser. Journal of Materials Design and Applications, 230: 18-34. (  0) 0) |
Wang, C. G., Shankar, K. and Morozov, E. V., 2015. Tailored local design of deep sea FRP composite risers. Advanced Composite Materials, 24(4): 375-397. DOI:10.1080/09243046.2014.898438 (  0) 0) |
Wu, W. G., 2015. Mechanical performance analysis and optimization design study of deepwater complaint vertical access riser. Master thesis. China University of Petroleum.
(  0) 0) |
Xie, T., Chen, H. W. and Kang, L. S., 2003. Evolutionary algorithms of multi-objective optimization problems. Chinese Journal of Computers, 26(8): 997-1003. (  0) 0) |
 2019, Vol. 18


