2) China Waterborne Transport Research Institute, Ministry of Transport of the People's Republic of China, Beijing 100088, China
Since the middle of the last century, the Arctic sea ice has gradually been melting because of global climate change (Parkinson et al., 1999; Stopa et al., 2016). The Arctic Ocean is a key region in the global climate system, and variations in sea surface temperature (SST) are significant for climate change and ecosystems. The growth of sea fetch has a significant effect on ocean wave dynamics (Xing et al., 2023). As shown in the literature (Sutton and Allen, 1997; Proshutinsky et al., 2001), the SST and sea level have shown increasing trends. However, the characteristics of water temperature in the Arctic Ocean are worthy of further study because variation in water temperature is related to changes in oceanic dynamics (i.e., waves and currents) (Yao et al., 2023). Observations from moored buoys are valuable for oceanographic research. Collection of in situ data can be costly, making it difficult to measure extreme sea states such as the Arctic Ocean and tropical cyclones (TCs). Instead, remote-sensed products from altimeters (Liu et al., 2016) and synthetic aperture radar (SAR) (Shao et al., 2022a) offer valuable data regarding such conditions.
With the development of efficient computational methods and advancements in oceanography theories, simulations of oceanic dynamics by numerical models have been realized, increasing the possibility of long-term climate analysis. Currently, several numerical models, i.e., WAVEWATCH-Ⅲ (WW3) (The WW3DG, 2019; Sun et al., 2021) and Simulation Wave Nearshore (SWAN) (Booij et al., 1999; Wang and Jiang, 2012), are applied for wave simulations, especially in TCs (Xu et al., 2005; Hu et al., 2020). Both models follow the unique principle of the Wave Model (WAM) (The WAMDI Group, 1998). The difference is that WW3 uses a rectangular grid while SWAN uses an unstructured scheme. An unstructured grid is more flexible and has higher grid resolution, which can be realized in specific areas for more accurate simulations of small-scale phenomena. A structured grid can give greater computational efficiency and stability, which allows the usage of more efficient algorithms and data structures, demonstrating that it is suitable for large-scale global simulations. Thus, previously, WW3 was suitable for wave simulation over global oceans (Bi et al., 2015; Zheng et al., 2018; Shao et al., 2021b), and a triangular mesh in SWAN was usually used to illustrate the curved shorelines of coastal waters (Yang et al., 2020). Particularly, alternative parametrizations of ice-wave interactions (Williams et al., 2013; Li et al., 2019) are provided by WW3, allowing for application in polar regions (Hu et al., 2022; Shao et al., 2022b). There is less difference in the latest versions of the two models, i.e., SWAN (version 41.45) and WW3 (version 6.07), as both use rectangular and triangular mesh schemes. Currently, both WW3 and SWAN can use different types of grids. The latest public version of WW3 allows users to select a traditionally rectangular grid, a curvilinear grid, or an unstructured triangular grid. This is also true for the SWAN model. Moreover, the implementation of the unstructured grid in WW3 is now applicable to high-resolution coastal simulations and performs comparably with SWAN (Abdolali et al., 2020).
The baroclinity properties of seawater in the vertical direction result in the difficulty of comprehensively solving the Navier-Stokes equations for ocean circulation. In the 1960s, a low-order precision finite difference method was implemented to approximate these equations (Bryan, 1969). Particularly, structured horizontal grids and the z-level in the vertical direction were utilized in the numerical model. Following this principle, ocean circulation models have been developed by several groups, namely, the Harvard Ocean Prediction System (Robinson and Walstad, 1987) and the Parallel Ocean Program (Jones et al., 2010). However, when applying z-coordinate models to seas with extreme changes in topography, large simulation errors are unavoidable because vertical mass transport is sensitive to the terrain slope at the bottom of the ocean. Terrain-following σ-coordinates are employed in the updated models, such as the Princeton Ocean Model (POM) (Robertson et al., 2001), the Estuarine Coastal and Ocean Model, and the Regional Ocean Modeling System (Shchepetkin and McWilliams, 2005). Furthermore, isopycnic coordinates in the vertical direction have been applied in global circulation models, such as the Miami Isopycnic Ocean Model (Bleck and Smith, 1990) and the HYbrid Coordinate Ocean Model (HYCOM) (Chassignet et al., 2003). The advantage of isopycnic coordinates is the use of optional coordinates, i.e., the σ-coordinates in shallow water and the z-coordinates in the open or stratified upper ocean. In the horizontal direction, most of the above-mentioned models use orthogonal or nonorthogonal curvilinear grids, a scheme that does not fully fit coastal boundaries and thus cannot show the complex and irregular geometries of estuaries, islands, or tidal creeks. Thus, an unstructured grid similar to that in SWAN has been applied in several circulation models, such as the Finite-Volume primitive equation Community Ocean Model (FVCOM) (Chen et al., 2007) and the Semi-implicit Eulerian-Lagrangian Finite-Element (SELFE) (Zhang and Baptista, 2008). Furthermore, the FVCOM is widely used for the simulation of SST with good accuracy.
From a global perspective, the SST distribution is influenced by the water transport associated with ocean circulation. Moreover, the improvement of sea fetch and sea level rise resulting from the sea ice reduction in the Arctic Ocean has led to the growth of waves. The literature (Sun et al., 2021; Yao et al., 2023) has demonstrated that wave-induced effects influenced the SST between 60˚S and 60˚N latitude. The aim of this study was to examine the contribution of waves to the SST in the Arctic Ocean. The waves in 1993 – 2022 were hindcasted by WW3 using European Centre for Medium-Range Weather Forecasts (ECMWF) wind data and HYCOM current field and sea level data. The wave-induced phenomena, i.e., wave breaking and mixing induced by nonbreaking waves resulting in changes in radiation stress and Stokes drift, were included in the wave simulation. The parallel version of the POM, the Stony Brook Parallel Ocean Model (sbPOM) (Jordi and Wang, 2012), was applied for water temperature simulation. Currently, the Arctic Ocean SST can be mainly obtained by satellite observations, in situ surveys, and model simulations. The satellite observations and in situ data have good precision; however, they are difficult to obtain in such extreme ocean states. Meteorological and oceanic models can predict and hindcast the SST in the whole Arctic Ocean at a relatively low cost. Moreover, previous studies have verified that the sbPOM model performs well in SST simulations and has good applicability (Sun et al., 2021; Yao et al., 2023). Therefore, in this current work, the sbPOM model is utilized to simulate SST in the Arctic Ocean. In addition, sensitivity analysis is performed with and without wave-induced terms in the modeling.
This article is structured as follows. Section 2 describes the numerical models, including their forcing fields and settings. Section 3 presents the validation of the simulated waves and the method for calculating the four wave-induced terms. Section 4 highlights the sensitivity analysis results to determine the contribution of waves to the SST in the Arctic Ocean. The conclusions are drawn in Section 5.
2 Descriptions of the Numerical ModelsThe models and settings of WW3 and sbPOM are briefly described in this section, and the data used in the two models are introduced.
2.1 Model Settings and Data Used in WW3Based on the principles of the WAM model, the main step in modeling waves in three dimensions using the WW3 model is to solve the wave energy balance equation described below:
| $\frac{\partial E}{\partial t}+\nabla \cdot\left[\left(c_{\mathrm{g}}+c\right) \times E\right]=F, $ | (1) |
where
| $ F=F_{\text {in }}+F_{\text {bot }}+F_{\text {nl }}+F_{\text {ice }}+F_{\text {other }}, $ | (2) |
where E is the wave action density, ∇ is the Hamiltonian operator, cg is the group speed; c is the velocity of the ocean current, and F is the input and dissipative source terms. The sources of F include the wind-wave growth term Fin, nonlinear wave-wave interaction term Fnl, wave bottom interaction Fbot, wave-ice interaction Fice, and other terms Fother, i.e., wave-current interactions and wave breaking.
In this work, the computing region of the wave model in the Arctic Ocean was located within 60˚ – 80˚N, 0˚ – 360˚E, and the simulated period was from January 1993 to December 2022. The results of the WW3 model simulation have a spatial resolution of 0.25˚ and a time interval of 1 h. The mode of input/dissipation terms set was ST2 + STAB 2, which is proven to have a better capability for simulating extreme sea states (Sheng et al., 2019). The four wave-wave interactions were calculated by the GMD2 package (Shao et al., 2018), and the ice-wave interactions were calculated by switch IC4_M1 (Shao et al., 2022b), which considers the marginal ice zone area. Furthermore, the wave frequency bin ranges from 0.04118 to 0.7186 at intervals of Δf/f = 0.01, and the direction resolution is utilized as a two-dimensional wave spectrum, which is decomposed into 24 regular azimuthal directions in 15˚ steps. The ECMWF reanalysis (ERA-5) wind field data, HYCOM current field and sea level data, and CMEMS sea ice data were employed as the forcing fields for the WW3 model. A previous study revealed that the input of HYCOM sea level and current data as forcing fields can enhance the accuracy of WW3 model simulation (Hu et al., 2020). The temporal and spatial resolutions of the ERA-5 wind were 1 h and 0.25˚ grid, respectively. The HYCOM sea surface current and sea level have a spatial resolution of 0.08˚ at 3 h intervals, whereas the CMEMS daily average sea ice has a resolution of 1/12˚. The settings and forcing fields of WW3 are summarized in Table 1.
|
|
Table 1 Settings and forcing fields of the WAVEWATCH-Ⅲ (WW3) model |
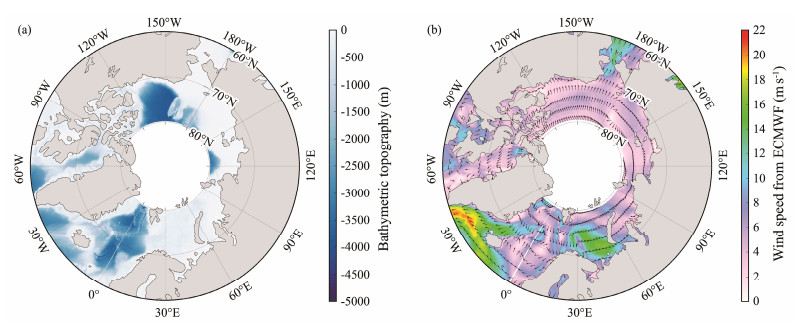
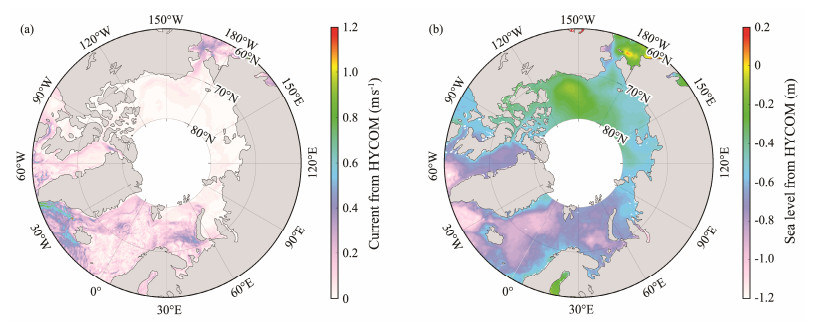
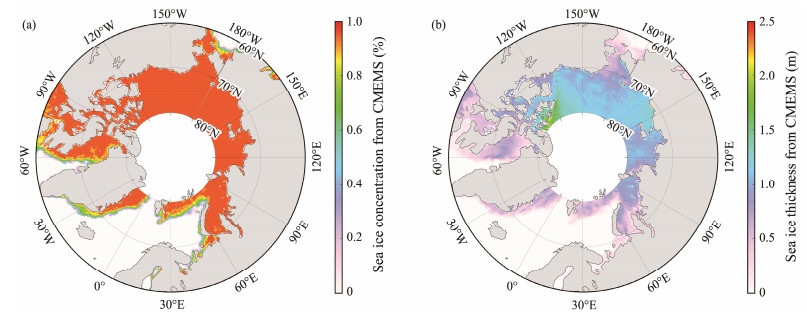
For example, the water depth was taken from the General Bathymetry Chart of the Oceans (GEBCO) using a spatial resolution of 1 km. Fig.1 illustrates a GEBCO water depth map of the modeling region and the ERA-5 wind at 00:00 UTC on January 1, 2022, in the Arctic Ocean. The HYCOM sea surface current and sea level maps at 00:00 UTC and daily average CMEMS sea ice concentration and thickness on January 1, 2022, are presented in Fig.2 and Fig.3, respectively.
|
Fig. 1 (a) Water depth map from the General Bathymetry Chart of the Oceans (GEBCO) data and (b) European Centre for Medium-Range Weather Forecasts (ECMWF) reanalysis (ERA-5) wind speed map at 00:00 UTC on January 1, 2022. |
|
Fig. 2 (a) Sea surface current and (b) sea level from the HYbrid Coordinate Ocean Model (HYCOM) at 00:00 UTC on January 1, 2022. |
|
Fig. 3 (a) Daily average sea ice concentration and (b) thickness maps from the Copernicus Marine Environmental Monitoring Service (CMEMS) on January 1, 2022. |
The sbPOM is an updated version of the POM and has the advantage of parallel computation (Sun et al., 2021). In the vertical direction, σ-coordinates are used, and the following formula is used to convert the z-coordinates to σ-coordinates:
| $ \sigma=\frac{z-\eta}{H+\eta}, $ | (3) |
where H is the seafloor topography, η is the sea surface height from the seafloor (z = −H) to the surface (z = η), and σ ranges from −1 to 0. In σ-coordinates, the basic equation can be expressed as
| $ \frac{\partial D_u}{\partial x}+\frac{\partial D_v}{\partial y}+\frac{\partial \omega}{\partial \sigma}+\frac{\partial \eta}{\partial t}=0, $ | (4) |
where
| $ D=H+\eta, $ | (5) |
where u, v, and ω are the velocities in the σ-coordinates.
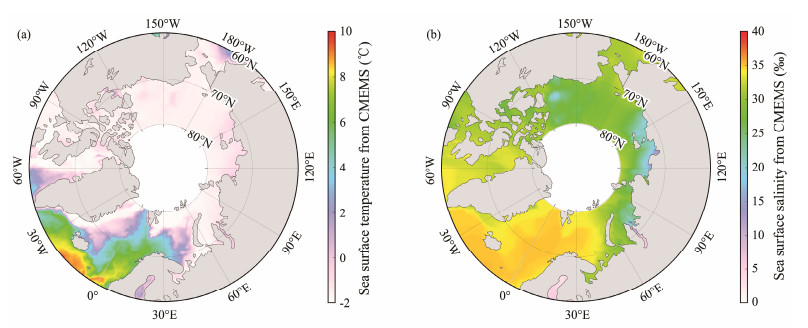
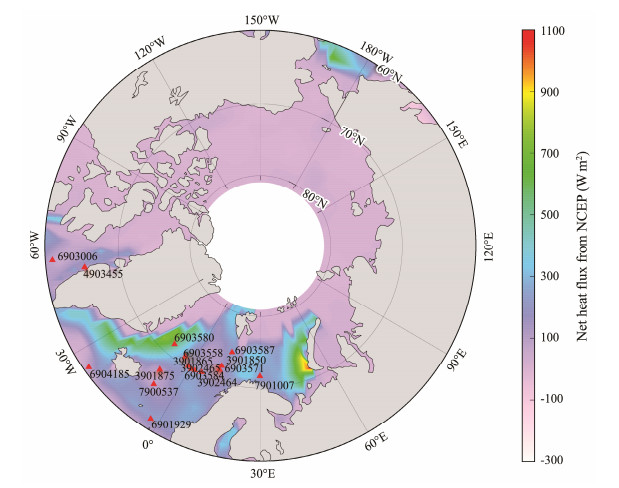
The sbPOM employs different data sources to produce initial fields of SST, i.e., monthly average temperature and salinity data from the CMEMS, the ECMWF reanalysis (ERA-5) wind field, the total heat flux parameters from NCEP (latent heat, sensible heat, long-wave radiation, and short-wave radiation), and the four wave-induced parameters associated with wave breaking, nonbreaking waves, radiation stress, and Stokes drift are simulated by WW3. The simulations from WW3 and CMEMS data have a spatial resolution of 0.25˚. The temporal resolution of the NCEP data is 6 h, and the spatial resolution is 1.905˚ × 1.875˚ in the latitude × longitude direction. It is necessary to determine whether the sbPOM conducts the preprocessing of the initial field data to fit the grid and resolution of the model, i.e., interpolation, smoothing, or other data processing steps. Fig.4 presents the monthly average SST and sea surface salinity maps from CMEMS in January 2022. Similarly, the NCEP reanalysis total heat flux map at 00:00 UTC on January 1, 2022, is displayed in Fig.5, where red triangles refer to the geographic locations of the available Argos buoys. The sbPOM-simulated results have a spatial resolution of 0.25˚ and a time interval of 1 h. The settings and forcing fields for sbPOM are summarized in Table 2.
|
Fig. 4 (a) Monthly average sea surface temperature and (b) sea surface salinity map from the Copernicus Marine Environmental Monitoring Service (CMEMS) in January 2022. |
|
Fig. 5 Net heat flux map from the National Centers for Environmental Prediction (NCEP) on January 1, 2022. The red triangle represents the geographic locations of Argos. |
|
|
Table 2 Settings and forcing fields of the Stony Brook Parallel Ocean Model (sbPOM) |
In this section, the validation of WW3-simulated waves in 2020 – 2022 against measurements from the HY-2B altimeter is shown, as well as the description of the method used for calculating the four wave-induced terms.
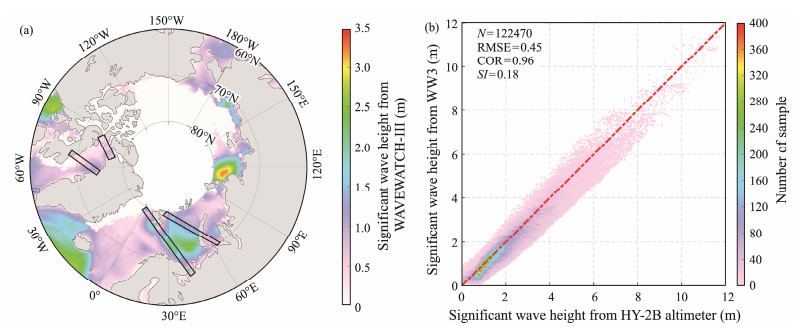
3.1 Validation of the WW3 SimulationThe Haiyang-2B (HY-2B) Chinese marine monitoring satellite was successfully launched in October 2018. Sea surface wind and wave measurement products are officially released by the National Satellite Ocean Application Service. The HY-2 altimeter can measure sea surface height, significant wave height (SWH), and wind speed worldwide with high accuracy (Jiang et al., 2012). Shao et al. (2021a) reported a root mean squared error (RMSE) of 0.29 m for SWH with a correlation (COR) of 0.98 for geophysical data record data. To validate the WW3 simulations, the SWH measurement data for 2020 – 2022 from the HY-2B altimeter were taken. The WW3-simulated SWH map overlaid by the measurements from the HY-2B altimeter at 12:00 UTC on June 15, 2022, is presented in Fig.6a, where the color footprints indicate the SWH from the HY-2B altimeter. There are more than 100000 matchups for validation, as shown in Fig.6b. Statistical analysis obtained an RMSE of 0.45 with a COR of 0.96 and scatter index (SI) of 0.18.
| $ SI = \frac{1}{{\bar Y}}\sqrt {\frac{{\sum\nolimits_{i = 1}^n {{{\left[ {({X_i} - \bar X) - ({Y_i} - \bar Y)} \right]}^2}} }}{n}}, $ | (6) |
|
Fig. 6 (a) Simulated significant wave height (SWH) by WAVEWATCH-Ⅲ (WW3) in the Arctic Ocean at 12:00 UTC on June 15, 2022, overlaid with the footprints (black rectangles) of the Haiyang-2B (HY-2B) altimeter from 10:00 UTC to 14:00 UTC. (b) Comparison of WW3-simulated SWH with measurements from the HY-2B altimeter up to 80˚N. |
where n-elements Xi and X are the values of simulated SWH and its average value, respectively, and Yi and Y are the values of SWH from HY-2B and its average value, respectively.
In this work, WW3-simulated waves were suitable for calculating the four wave-inducing parameters used in the sbPOM.
3.2 Four Wave-Induced TermsInside a unit area of water, the rate of energy dissipation due to wave breaking is controlled by the following equation (Guan et al., 2007):
| $ R_{d s}=2.97 \gamma p_w g \beta_*^{-2} \omega_p E, $ | (7) |
where
| $\beta=\frac{g}{u_* \omega_p}, $ | (8) |
| $ E=\int F(k) \mathrm{d} k, $ | (9) |
| $\omega_p=\frac{2 \mathtt{π}}{T_p}, $ | (10) |
where Rds refers to the downward input of turbulent kinetic energy flux due to wave breaking on the sea surface, ρw refers to the seawater density, g refers to the acceleration due to gravity that is equal to 9.8 m s−2, γ refers to the energy dissipation per unit white crown as a percentage of the total wave energy dissipation that is equal to 0.1, β refers to the age of the wave, E refers to the density of the spectrum, k refers to the wave velocity vector, F(k) refers to the two-dimensional wave spectrum, ωp refers to the spectral peak angular frequency, u∗ refers to the frictional speed (=
The parametric equations for the vertical eddy viscosity coefficient Km and the vertical diffusion coefficient Kh associated with the mixing induced by nonbreaking waves are (Hu and Wang, 2010)
| $K_m=\frac{2 a k^2 \lambda}{\mathtt{π} T} \mathrm{e}^{\frac{2 \mathtt{π} z}{\lambda}}, $ | (11) |
| $K_h=\frac{2 P k^2}{g} \delta \beta^3 W^3 \mathrm{e}^{\frac{g z}{\beta^2 W^2}}, $ | (12) |
where k is the Karman constant, a is the amplitude, which is half the SWH, T is the fluctuation cycle, λ is the mean wavelength, z is the distance from the surface to a certain depth on the sea floor, P is a dimensionless variable related to the Richardson number coefficient, and δ is the wave steepness that is equal to 0.1.
The components of radiation stress (Wu et al., 2011), namely, Sxx, Syy, and Sxy, are calculated using
| $ S_{x x}=k E\left(\frac{k_x k_x}{k_x^2+k_y^2} F_{c s} F_{c c}-F_{s c} F_{s s}\right)+E_D, $ | (13) |
| $ S_{y y}=k E\left(\frac{k_y k_y}{k_x^2+k_y^2} F_{c s} F_{c c}-F_{s c} F_{s s}\right)+E_D, $ | (14) |
| $ S_{x y}=S_{y x}=\sqrt{k_x^2+k_y^2} E \frac{k_x k_x}{k^2} F_{c s} F_{c c}, $ | (15) |
| $ F_{s c}=\frac{\sin h k(z+h)}{\cos h k D}, \quad F_{c c}=\frac{\cos h k(z+h)}{\cos h k D}, $ | (16) |
| $ F_{s s}=\frac{\sin h k(z+h)}{\sin h k D}, \quad F_{c s}=\frac{\cos h k(z+h)}{\sin h k D}, $ | (17) |
| $ E=\frac{1}{16} \rho_w g H_s^2, $ | (18) |
where Hs is the SWH, and kx and ky are the wave numbers in the x- and y-directions, respectively. D = h + η and
The formula for mass transport Us induced by Stokes drift on the sea surface can be expressed as (Mesquita et al., 1992)
| $ U_s=U_{s s} e^{\frac{8 \mathtt{π}^2 z}{g T^2}} k,$ | (19) |
where
| $ U_{s s}=\frac{2 \mathtt{π}^3 H_s^2}{g T^3}, $ | (20) |
where Hs is the SWH, k is the wave number vector of fluctuation, T is the dominant wave period, and z is the water depth (z = 0 at the surface; z > 0 above the surface).
4 Results and DiscussionThe SST in the Arctic Ocean is simulated for 1993 – 2022 using the sbPOM with and without the influence of waves simulated by WW3. Measurements from Argo buoys are utilized for validation. Moreover, the contribution of waves to the SST is discussed.
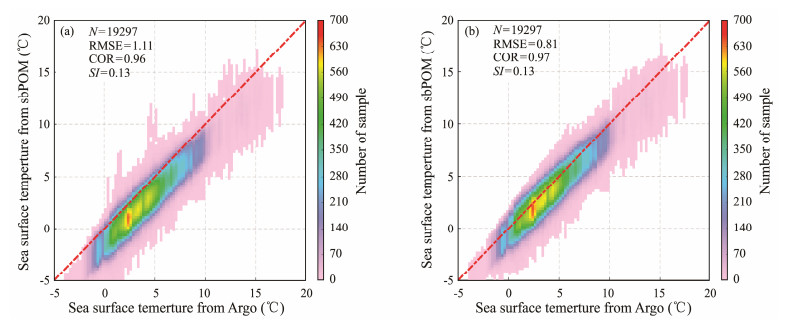
4.1 Validation of the SST SimulationTo investigate the influence of waves on the SST, two types of simulations from sbPOM were analyzed. In this study, there were more than 20000 matchups between SSTs calculated using the sbPOM and Argo floats. Comparison without wave-induced effects is shown in Fig.7a, while Fig.7b displays the results, including the four wave terms. The RMSE was 0.81℃ with wave-induced effects, which is less than the 1.11℃ RMSE reached without waveinduced effects. We used the sbPOM settings in our previous work (Hu et al., 2022) for the water temperature simulation of the Antarctic surface layer. It should be noted that the underestimation of the ERA-5 wind may result in the behavior of systematic deviation in Fig.7a, and this is also found in the SST simulation in the Antarctic Ocean. However, the accuracy of the SST by sbPOM was enhanced by including the four wave terms, i.e., a COR of 0.97 and SI of 0.13. The SST simulations with wave-induced effects are more realizable, probably because waves affect the temperature of surface water by mixing the ocean. This mixing may cause deep cold water to rise to the surface or sink warmer surface water to the depth.
|
Fig. 7 Comparisons between the measurements from Argos and simulated sea surface temperature (SST) by the Stony Brook Parallel Ocean Model (sbPOM): (a) without and (b) with wave-induced effects. |
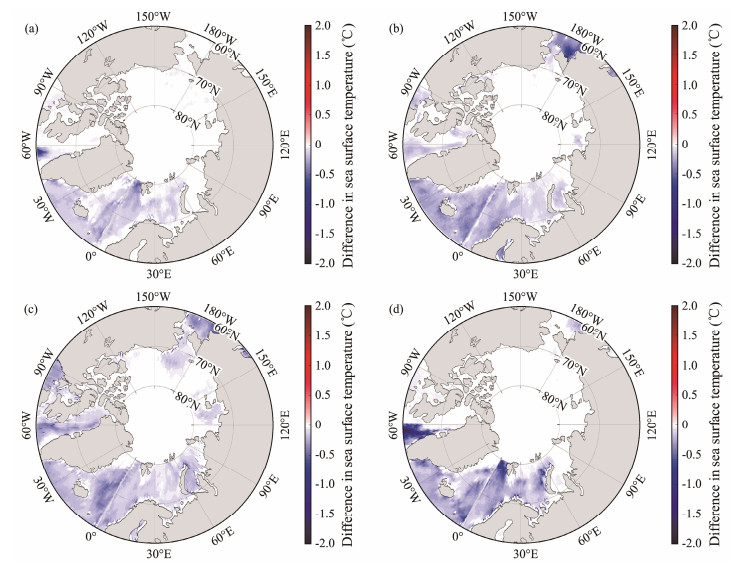
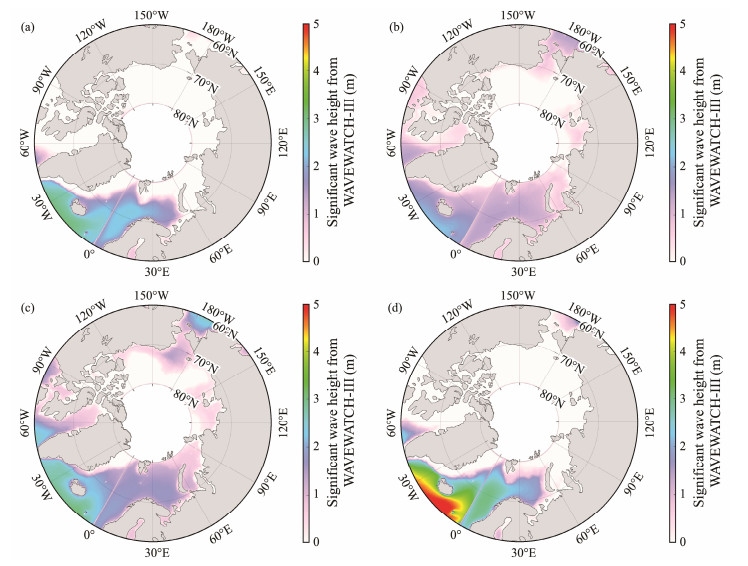
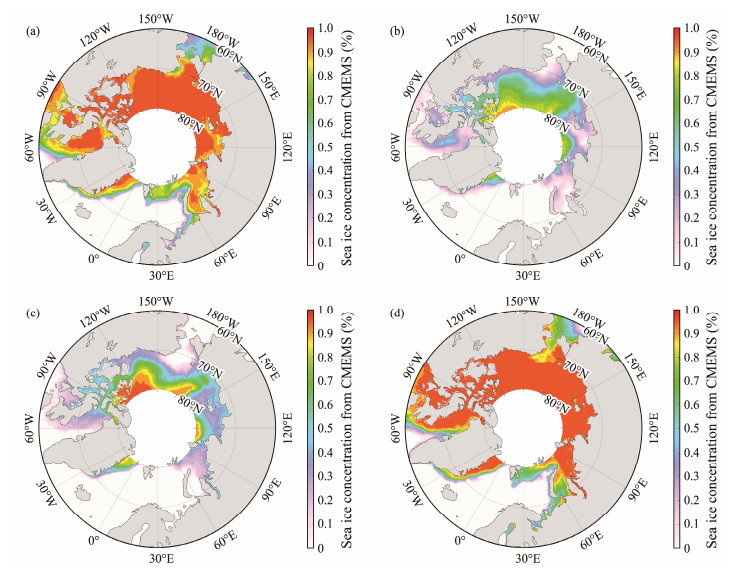
The spatial distribution of the seasonal average difference in SST (values with wave effects minus values without wave effects) was further analyzed in 2022 in spring, summer, autumn, and winter, as shown in Fig.8. A negative difference in SST demonstrates that waves cause a decrease in SST. This is reasonable because the wave will accelerate heat exchange at the sea-air boundary layer. The maximum difference in SST is up to −1℃ in the Baffin Bay and the Greenland and Norwegian Seas in winter, probably caused by the large wave in winter in the North Atlantic, as illustrated in Fig.9. Similarly, the spatial distribution of the seasonal average WW3-simulated SWH in 2022 is presented in Fig.9. Interestingly, the pattern of the difference in SST is consistent with that for waves. Moreover, the difference in SST generally increases with increasing SWH in autumn and winter. The spatial distribution of seasonal average ice concentration from CMEMS in 2022 is shown in Fig.10. The presence of sea ice limits the exchange of heat between seawater and the atmosphere. This results in the relative stability of the SST. During the winter, larger waves in the North Atlantic may expose the surface of the sea to the atmosphere more easily, contributing to faster heat exchange and increasing the difference in SST.
|
Fig. 8 Spatial distribution of seasonal average difference in SST (values with wave effects minus values without waves) in 2022: (a) spring, (b) summer, (c) autumn, and (d) winter. |
|
Fig. 9 Spatial distribution of seasonal average WW3-simulated SWH in 2022. (a), spring; (b), summer; (c), autumn; (d), winter. |
|
Fig. 10 Spatial distribution of seasonal average ice concentration from CMEMS in 2022. (a), spring; (b), summer; (c), autumn; (d), winter. |
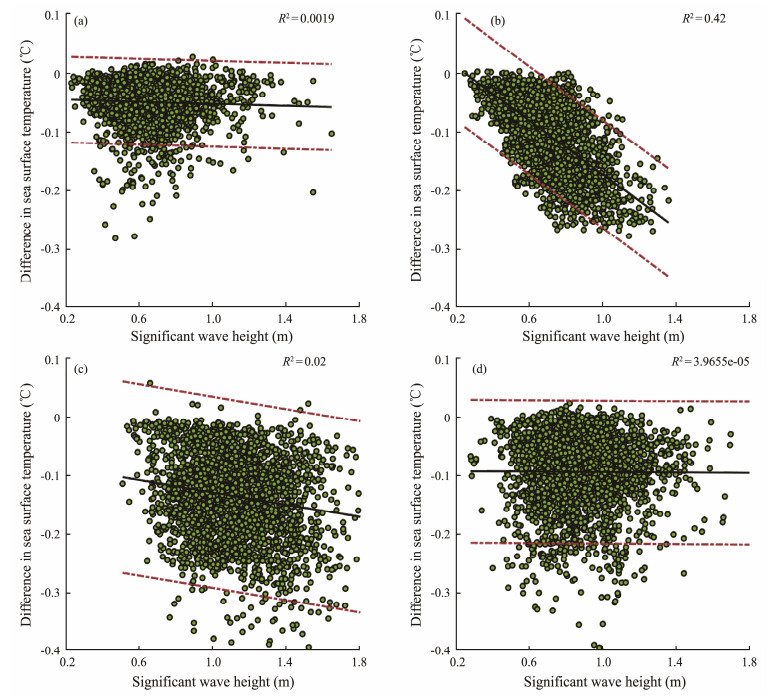
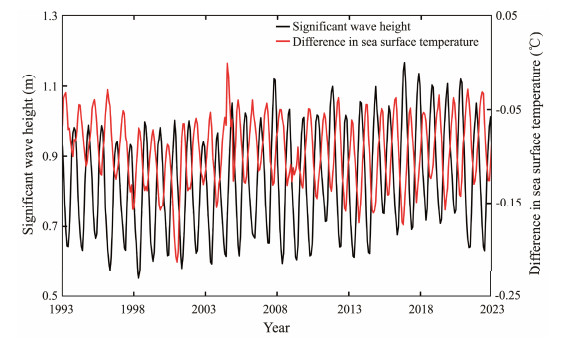
To quantitatively estimate the contribution of waves to the SST in the Arctic Ocean, linear regression analysis was performed. As shown in Fig.11b, there was a significant negative correlation between the difference in SST and SWH in summer with less sea ice, where the coefficient of determination (R2 = 0.42) is greater than that in other months. Particularly, R2 was quite low in winter, although the SWH was up to 5 m. We believe that this low R2 is due to the rapid expansion of sea ice. In other words, the SST in the Arctic Ocean decreases considering the four effects of waves and sea ice freezing; however, the relationship between the SWH and the difference in SST is relatively weak in winter and spring. The interannual variation of SWH and difference in SST during 1993 – 2022 of the study area is shown in Fig.12, where the red line is the monthly-averaged difference in SST (values with wave effects minus values without wave effects) and the black line is the monthly-averaged SWH, indicating that the difference in SST oscillation has a negative response to the SWH.
|
Fig. 11 Linear regression analysis of differences in SST and WW3-simulated SWH in 2022. (a), spring; (b), summer; (c), autumn; (d), winter. |
|
Fig. 12 Interannual variation of monthly-averaged WW3-simulated SWH (black line) and monthly-averaged differences in sbPOM-simulated SST (red line) during 1993 – 2022. |
SST is expected to rise under global climate change (El-Geziry, 2021). Moreover, wind stress has a similar increasing tendency. As stated by Yao et al. (2023), the growth of waves can slow the amplitude of sea surface warming. In our work, the objective was to examine the contribution of waves to the SST in the Arctic Ocean due to the enlargement of the sea fetch caused by sea ice melting (Li et al., 2021). Moreover, sensitivity analysis with and without wave terms for 1993 – 2022 was performed to conduct quantitative predictions.
The ERA-5 wind, HYCOM sea surface current, HYCOM sea level, CMEMS sea ice concentration, and CMEMS thickness were utilized to force the WW3, where the switch IC4_M1 calculated the ice-wave interaction (Shao et al., 2022b). The WW3-simulated SWH were compared with those of the HY-2B altimeter in 2020 – 2022, obtaining an RMSE of 0.45 for SWH with a COR of 0.96 and SI of 0.18. Four wave-induced effects, i.e., wave breaking and mixing induced by nonbreaking waves resulting in changes in radiation stress and Stokes drift, were calculated from the WW3-simulated waves. The fields used to initialize the sbPOM included the CMEMS monthly average sea temperature and sea salinity. The ERA-5 wind and NCEP total net heat flux were the forcing fields in the sbPOM. Moreover, sensitivity analysis for sbPOM with and without wave-induced effects was performed. The sbPOM-simulated SST was validated against the Argos measurements, demonstrating an RMSE of 0.81℃ with wave-induced effects less than the RMSE of 1.11℃ achieved without wave-induced effects. This suggests that waves contribute to SST in the Arctic Ocean. The seasonal distribution of the difference in SST (values with wave effects minus values without waves) in 2022 indicated that the pattern of difference in SST was consistent with that for waves. Moreover, a negative correlation (R2 = 0.42) between the difference in SST and SWH in summer was observed; however, this behavior was not obvious in winter or spring due to the presence of sea ice. The interannual variation during 1993 – 2022 also indicated a negative relationship between SWH and the difference in SST.
Mesoscale eddies are common in global seas (Kubryakov et al., 2021). In the future, FVCOM-SWAVE, a coupled marine model, will be employed to investigate the interaction between mesoscale eddies and waves in the Arctic Ocean.
AcknowledgementsThis work was supported by the National Natural Science Foundation of China (Nos. 42076238 and 42376174), and the Natural Science Foundation of Shanghai (No. 23ZR1426900). We thank the National Oceanic and Atmospheric Administration (NOAA) for the provision of the WAVEWATCH-Ⅲ (WW3) model. The original code of the Stony Brook Parallel Ocean Model (sbPOM) was accessed at http://www.ccpo.odu.edu. The wind field from the European Centre for Medium-Range Weather Forecasts (ECMWF) was downloaded via http://www.ecmwf.int. The General Bathymetry Chart of the Oceans (GEBCO) water depth was collected via ftp.edcftp.cr.usgs.gov. Sea surface current and sea level data from HYCOM were collected via https://www.hycom.org. The monthly average temperature, salinity, sea ice concentration, and thickness were from the Copernicus Marine Environment Monitoring Service (CMEMS) and were accessed via https://marine.copernicus.eu.
Abdolali, A., Roland, A., Van Der Westhuysen, A., Meixner, J., Chawla, A., Hesser, T. J., et al., 2020. Large-scale hurricane modeling using domain decomposition parallelization and implicit scheme implemented in WAVEWATCH Ⅲ wave model. Coastal Engineering, 157: 103656. DOI:10.1016/j.coastaleng.2020.103656 (  0) 0) |
Bi, F., Song, J. B., Wu, K. J., and Xu, Y., 2015. Evaluation of the simulation capability of the Wavewatch Ⅲ model for Pacific Ocean wave. Acta Oceanologica Sinica, 34(9): 43-57. DOI:10.1007/s13131-015-0737-1 (  0) 0) |
Bleck, R., and Smith, L. T., 1990. A wind-driven isopycnic coordinate model of the north and equatorial Atlantic Ocean: 1. Model development and supporting experiments. Journal of Geophysical Research, 95(C3): 3273-3285. DOI:10.1029/JC095iC03p03273 (  0) 0) |
Booij, N., Ris, R. C., and Holthuijsen, L. H., 1999. A third-generation wave model for coastal regions: 1. Model description and validation. Journal of Geophysical Research, 104(C4): 7649-7666. DOI:10.1029/98jc02622 (  0) 0) |
Bryan, K., 1969. A numerical method for the study of the circulation of the world ocean. Journal of Computational Physics, 4(3): 347-376. DOI:10.1016/0021-9991(69)90004-7 (  0) 0) |
Chassignet, E. P., Smith, L. T., Halliwell, G. R., and Bleck, R., 2003. North Atlantic simulations with the hybrid coordinate ocean model (HYCOM): Impact of the vertical coordinate choice, reference pressure, and thermobaricity. Journal of Physical Oceanography, 3(12): 2504-2526. DOI:10.1175/1520-0485(2003)033<2504:NASWTH>2.0.CO;2 (  0) 0) |
Chen, C. S., Huang, H., Beardsley, R. C., Liu, H., And, Q. X., and Cowles, G., 2007. A finite volume numerical approach for coastal ocean circulation studies: Comparisons with finite difference models. Journal of Geophysical Research, 112(C3): C03018. DOI:10.1029/2006JC003485 (  0) 0) |
El-Geziry, T. M., 2021. Long-term changes in sea surface temperature (SST) within the southern Levantine Basin. Acta Oceanologica Sinica, 40(3): 27-33. DOI:10.1007/s13131-021-1709-2 (  0) 0) |
Guan, C. L., Hu, W., Sun, J., and Li, R. L., 2007. The whitecap coverage model from breaking dissipation parametrizations of wind waves. Journal of Geophysical Research, 112: CO1006. DOI:10.1029/2006JC003714 (  0) 0) |
Hu, H. G., and Wang, J., 2010. Modeling effects of tidal and wave mixing on circulation and thermohaline structures in the Bering Sea: Process studies. Journal of Geophysical Research, 115: C01006. DOI:10.1029/2008JC005175 (  0) 0) |
Hu, Y. Y., Shao, W. Z., Li, J., Zhang, C. L., Cheng, L. Q., and Ji, Q. Y., 2022. Short-term variations in water temperature of the Antarctic surface layer. Journal of Marine Science and Engineering, 10(2): 287. DOI:10.3390/jmse10020287 (  0) 0) |
Hu, Y. Y., Shao, W. Z., Shi, J., Sun, J., Ji, Q. Y., and Cai, L. N., 2020. Analysis of the typhoon wave distribution simulated in WAVEWATCH-Ⅲ model in the context of Kuroshio and wind-induced current. Journal of Oceanology and Limnology, 38(6): 1692-1710. DOI:10.1007/s00343-019-9133-6 (  0) 0) |
Jiang, X. W., Lin, M. S., Liu, J. Q., Zhang, Y. G., Xie, X. T., Peng, H. L., et al., 2012. The HY-2 satellite and its preliminary assessment. International Journal of Digital Earth, 5(3): 266-281. DOI:10.1080/17538947.2012.658685 (  0) 0) |
Jones, P. W., Worley, P. H., Yoshida, Y., Iii, J., and Levesque, J., 2010. Practical performance portability in the parallel ocean program (POP). Concurrency and Computation: Practice and Experience, 17(10): 1317-1327. DOI:10.1002/cpe.894 (  0) 0) |
Jordi, A., and Wang, D. P., 2012. SbPOM: A parallel implementation of Princenton ocean model. Environmental Modelling & Software, 38(12): 59-61. DOI:10.1016/j.en-vsoft.2012.05.013 (  0) 0) |
Kubryakov, A. A., Kozlov, I. E., and Manucharyan, G. E., 2021. Large mesoscale eddies in the western Arctic Ocean from satellite altimetry measurements. Journal of Geophysical Research – Oceans, 126(5): e2020JC016670. DOI:10.1029/2020JC016670 (  0) 0) |
Li, J. D., Babanin, A. V., Liu, Q. X., Voermans, J. J., Heil, P., and Tang, Y., 2021. Effects of wave-induced sea ice break-up and mixing in a high-resolution coupled ice-ocean model. Journal of Marine Science and Engineering, 9(4): 365. DOI:10.3390/jmse9040365 (  0) 0) |
Li, J. K., Ma, Y. R., Liu, Q. X., Zhang, W. Q., and Guan, C. L., 2019. Growth of wave height with retreating ice cover in the Arctic. Cold Regions Science and Technology, 164(8): 102790. DOI:10.1016/j.coldregions.2019.102790 (  0) 0) |
Liu, Q. X., Alexander, V. B., Stefan, Z., Young, L. R., and Guan, C. L., 2016. Wind and wave climate in the Arctic Ocean as observed by altimeters. Journal of Climate, 29(22): 7957-7975. DOI:10.1175/JCLI-D-16-0219.1 (  0) 0) |
Mesquita, O. N., Kane, S., and Gollub, J. P., 1992. Transport by capillary waves: Fluctuating Stokes drift. Physical Review A, 45: 3700. DOI:10.1103/PhysRevA.45.3700 (  0) 0) |
Parkinson, C. L., Cavalieri, D. J., Gloersen, P., Zwally, H. J., and Comiso, J. C., 1999. Arctic sea ice extents, areas, and trends, 1978 – 1996. Journal of Geophysical Research, 104(C9): 20837-20856. DOI:10.1029/1999JC900082 (  0) 0) |
Proshutinsky, A., Pavlov, V., and Bourke, R. H., 2001. Sea level rise in the Arctic Ocean. Geophysical Research Letters, 28(11): 2237-2240. DOI:10.1029/2000GL012760 (  0) 0) |
Robertson, R., Padman, L., and Levine, M. D., 2001. A correction to the baroclinic pressure gradient term in the Princeton Ocean Model. Journal of Atmospheric and Oceanic Technology, 18(6): 1068-1075. DOI:10.1175/15200426(2001)018<1068:ACTTBP>2.0.CO;2 (  0) 0) |
Robinson, A. R., and Walstad, L. J., 1987. The Harvard open ocean model: Calibration and application to dynamical process, forecasting, and data assimilation studies. Applied Numerical Mathematics, 3(1): 89-131. DOI:10.1016/0168-9274(87)90008-0 (  0) 0) |
Shao, W. Z., Jiang, T., Jiang, X. W., Zhang, Y. G., and Zhou, W., 2021a. Evaluation of sea surface winds and waves retrieved from the Chinese HY-2B data. IEEE Journal of Selected Topics in Applied Earth Observations and Remote Sensing, 14(9): 9624-9635. DOI:10.1109/JSTARS.2021.3112760 (  0) 0) |
Shao, W. Z., Jiang, T., Zhang, Y., Shi, J., and Wang, W. L., 2021b. Cyclonic wave simulations based on WAVEWATCH-Ⅲ using a sea surface drag coefficient derived from CFOSAT SWIM data. Atmosphere, 12(12): 1610. DOI:10.3390/atmos12121610 (  0) 0) |
Shao, W. Z., Jiang, X. W., Sun, Z. F., Hu, Y. Y., Marino, A., and Zhang, Y. G., 2022a. Evaluation of wave retrieval for Chinese Gaofen-3 synthetic aperture radar. Geo-Spatial Information Science, 25(2): 229-243. DOI:10.1080/10095020.2021.2012531 (  0) 0) |
Shao, W. Z., Sheng, Y. X., Li, H., Shi, J., Ji, Q. Y., Tan, W., et al., 2018. Analysis of wave distribution simulated by WAVEWATCH-Ⅲ model in typhoons passing Beibu Gulf, China. Atmosphere, 9(7): 265. DOI:10.3390/atmos9070265 (  0) 0) |
Shao, W. Z., Yu, W. P., Jiang, X. W., Shi, J., Wei, Y. L., and Ji, Q. Y., 2022b. Analysis of wave distributions using the WAVEWATCH-Ⅲ model in the Arctic Ocean. Journal of Ocean University of China, 21(1): 15-27. DOI:10.1007/s11802-022-4811-y (  0) 0) |
Shchepetkin, A. F., and McWilliams, J. C., 2005. The regional ocean modeling system: A split-explicit, free-surface, topography following coordinates ocean model. Ocean Modelling, 9(4): 347-404. DOI:10.1016/j.ocemod.2004.08.002 (  0) 0) |
Sheng, Y. X., Shao, W. Z., Li, S. Q., Zhang, Y. M., Yang, H. W., and Zuo, J. C., 2019. Evaluation of typhoon waves simulated by WaveWatch-Ⅲ model in shallow waters around Zhoushan Islands. Journal of Ocean University of China, 18: 365-375. DOI:10.1007/s11802-019-3829-2 (  0) 0) |
Stopa, J. E., Ardhuin, F., and Girard-Ardhuin, F., 2016. Wave climate in the Arctic 1992 – 2014: Seasonality and trends. Cryosphere, 10(4): 1605-1629. DOI:10.5194/tc-10-1605-2016 (  0) 0) |
Sun, Z. F., Shao, W. Z., Wang, W. L., Zhou, W., Yu, W. P., and Shen, W., 2021. Analysis of wave-induced Stokes transport effects on sea surface temperature simulations in the western Pacific Ocean. Journal of Marine Science and Engineering, 9(8): 834. DOI:10.3390/jmse9080834 (  0) 0) |
Sutton, R. T., and Allen, M. R., 1997. Decadal predictability of North Atlantic sea surface temperature and climate. Nature, 388: 563-567. DOI:10.1038/41523 (  0) 0) |
The WAMDI Group, 1998. The WAM model – A third generation ocean wave prediction model. Journal of Physical Oceanography, 18(12): 1775-1810. DOI:10.1175/1520-0485(1988)018<1775:TWMTGO>2.0.CO;2 (  0) 0) |
The WAVEWATCH Ⅲ Development Group (WW3DG), 2019. User Manual and System Documentation of WAVEWATCH Ⅲ® Version 6.07. Techical Note No. 333, NOAA/NWS/NCEP/MMAB, College Park, MD, 465pp.
(  0) 0) |
Wang, Y., and Jiang, X. W., 2012. Improvement and application of a saturation based wave dissipation function in SWAN model. Acta Oceanologica Sinica, 31(1): 24-32. DOI:10.1007/s13131-012-0172-5 (  0) 0) |
Williams, T. D., Bennetts, L. G., Squire, A. V., Dumont, D., and Bertino, L., 2013. Wave-ice interactions in the marginal ice zone. Part 1: Theoretical foundations. Ocean Modelling, 71(9): 81-91. DOI:10.1016/j.ocemod.2013.05.010 (  0) 0) |
Wu, L., Chen, C., Guo, P., Shi, M., Qi, J., and Ge, J., 2011. A FVCOM-based unstructured grid wave, current, sediment transport model, I. Model description and validation. Journal of Ocean University of China, 10: 1-8. (  0) 0) |
Xing, G., Shen, W., Wei, M., Li, H., and Shao, W. Z., 2023. Wave and meso-scale eddy climate in the Arctic Ocean. Atmosphere, 14(6): 911. DOI:10.3390/atmos14060911 (  0) 0) |
Xu, F. M., Perrie, W., Zhang, J. L., Song, Z. Y., and Toulany, B., 2005. Simulation of typhoon-driven waves in the Yangtze Estuary with multiple-nested wave models. China Ocean Engineering, 19(4): 613-624. DOI:10.3390/10.3321/j.issn:0890-5487.2005.04.007 (  0) 0) |
Yang, Z. H., Shao, W. Z., Ding, Y., Shi, J., and Ji, Q. Y., 2020. Wave simulation by the SWAN model and FVCOM considering the sea-water level around the Zhoushan Islands. Journal of Marine Science and Engineering, 8(10): 783. DOI:10.3390/jmse8100783 (  0) 0) |
Yao, R., Shao, W. Z., Hao, M. Y., Zuo, J. C., and Hu, S., 2023. The respondence of wave on sea surface temperature in the context of global change. Remote Sensing, 15(7): 1948. DOI:10.3390/rs15071948 (  0) 0) |
Zhang, Y., and Baptista, A. M., 2008. SELFE: A semi-implicit Eulerian-Lagrangian finite-element model for cross-scale ocean circulation. Ocean Modelling, 21(3): 71-96. DOI:10.1016/j.ocemod.2007.11.005 (  0) 0) |
Zheng, K. W., Osinowo, A., Sun, J., and Hu, W., 2018. Long term characterization of sea conditions in the East China Sea using significant wave height and wind speed. Journal of Ocean University of China, 17(7): 733-743. DOI:10.1007/s11802-018-3484-z (  0) 0) |
 2024, Vol. 23


