2) Zoological Institute, Department of Molecular Physiology, Kiel University, Kiel 24118, Germany
Chitosan (CS) is a type of copolymer composed by d-glucosamine and N-acetyl-d-glucosamine bonds, which were connected by β (1-4) glycosidic bond (Kloster et al., 2018). It is prepared by alkaline deacetylation of chitin, a deacetylated of which over 60 or 70% is normally considered to be CS (Dorati et al., 2018). CS is the only basic polysaccharide in nature, possesses high reactivity and biocompatibility (Zhou et al., 2011), and is widely used as drug carriers and medical biomaterials, such as hemostatic materials, wound dressings, vascular stents, artificial blood vessels, medical hydrogels, and nano-pharmaceuticals (Li et al., 2014; Chan et al., 2016; Liang et al., 2016; Li et al., 2017). However, due to the ununiform Mw of natural CS, the bio-application of CS is greatly limited (Zhang and Neau, 2002). Natural CS material normally contains molecular chains of varying lengths, which lead to wide Mw distribution (Zou et al., 2016). CS with different Mw exhibited distinct biological activity, such as bacteriostatic and solubility (Younes and Rinaudo, 2015). Meanwhile, Mw is also a factor must be considered in CS products preparation, like CS hydrogel and modified CS (Furuike et al., 2017; Yu et al., 2017). Specifically, the gelation time, gelation temperature and mechanical strength of CS hydrogel are closely related to Mw (Gao et al., 2014; Cheung et al., 2015; Hamedi et al., 2018). Moreover, Mw also influences the substitution degree of modification group on CS (Sun et al., 2018). Therefore, to obtain CS with uniform Mw is an important requisite for the preparation of homogeneous quality CS products.
Currently, the common degradation methods for CS include acid degradation, oxidative degradation, ultrasonic degradation, microwave degradation and enzymatic degradation (Vårum et al., 2001; Cabreba and Van Cutsem, 2005; Wang et al., 2005; Huang et al., 2008; Li et al., 2012). During the degradation progress, the hydrogen bonds and glycosidic bonds of CS molecule were broken down, resulting in the fracture of molecule chains and reduction of Mw (Huang et al., 2007). However, the disadvantages of these traditional methods restrict their application. CS treated with these methods still possesses wide Mw distribution, though the average Mw was declined, which makes the degraded CS could hardly be utilized for the products requiring uniform Mw CS (Chokradjaroen et al., 2017). Moreover, the methods of ultrasonic and microwave degradation are normally of low efficiency, leads to the unstable product quality (Chen et al., 2012). In addition, enzymatic degradation method would increase the content of exogenous proteins, which caused the degraded CS is hard to purified and not applicable for the medical application (Nidheesh et al., 2015). Therefore, a novel degradation method is necessary to obtain purity CS with uniform Mw.
In this work, a heterogeneous degradation method based on aqueous HCl/ethanol solution was studied. By this method, a series of degraded CS samples was obtained, whose Mw, Mw distribution, chemical structure, solubility, crystal structure and thermal stability were studied. Besides, the blood compatibility of these series of degraded CS samples was also analyzed to estimate their biocompatibility.
2 Materials and Methods 2.1 MaterialsNew Zealand white rabbits were purchased from Lukang Pharmaceutical Co., Ltd. (Qingdao, China). CS with different molecular weight (Mw) were purchased from Biochemical Medicine Plant of Qingdao (Qingdao, China), with deacetylation degrees of 95%. Other chemical reagents used in the study were all commercially acquired from Sinopharm Chemical Reagent Co., Ltd. (Shanghai, China) with analytical reagent grade, and were used directly without further purification.
2.2 Heterogeneous Degradation of CSCS of different Mw (201 kDa, 246 kDa and 383 kDa) were prepared according to the procedure described in our previous work (Liu et al., 2006). Briefly, 100 mL of 36.5% (v/v) aqueous HCl was added into 200 mL of 75% (v/v) ethanol and stirred for 0.5 h to obtain a hydrolysis solution. Then, 5 g CS (Mw: 246 kDa) was dispersed in the hydrolysis solution, incubated at 50℃ with vigorous stirring for 0.5, 1, 2, 4, 6, 8, 12, 24, and 48 h, respectively, and the mixtures were centrifuged (5000 r min-1) for 20 min. The pH value of suspension was adjusted to 7-9 by adding 4 mol L-1 aqueous NaOH. The sediment was filtered and sequentially rinsed in water and ethanol and dried at 60℃. The degraded CS with hydrolysis time of 0.5, 1, 2, 4, 6, 8, 12, 24, and 48 h were coded as CS0.5, CS1, CS2, CS4, CS6, CS8, CS12, CS24, and CS48, respectively. The CS sample without degradation was coded as CS0.
2.3 Molecular Weight MeasurementViscosity average Mw was determined as follows: CS or degraded CS was dissolved in 0.1 mol L-1 acetic acid - 0.2 mol L-1 NaCl. Automated Solution Viscometer (Relative Viscometer Model Y501, Viscotek, Houston, TX, USA) was used to measure the intrinsic viscosity [η]. The Mark-Houwink equation [η]=KMwα was used to calculate the Mw. The value of K and α were 1.81×10⁻³ cm3g-1 and 0.93, respectively.
The Mw of the CS samples was determined by using a GPC method with a Waters-1525 binary HPLC system, a Waters-2410 refractive index detector (Waters Corp., Miford, MA), and an SEC column (TSK Gel 3000PW, 7.8 × 600 mm, Tosoh Corp., Japan). The mobile phase was 0.25 mol L-1 acetic acid buffer (pH 4.7).
2.4 CharacterizationInfrared spectroscopy of CS was recorded on a FT-IR spectrometer (model 1600, Perkin-Elmer Co., Massachusetts, USA) at room temperature. Wide angle XRD measurements were carried out on a XRD diffractometer (D8Advance, Bruker, Rheinstetten, Germany) with Cu Kα radiation (λ=0.15406 nm) at 40kV and 30mA. The curve was recorded in the range 2θ=5-60° at a scanning speed of 2° min-1. The samples were trimmed into small particles and dried in vacuum oven at 60℃ for 48 h before testing. The degraded CS at different times (10 mg) were dissolved in 0.5 mL deuterated hydrochloric acid (DCl) at room temperature, respectively. 1H NMR spectra was recorded at 500 MHz on a Bruker ARX500 spectrometer (Brucker, Rheinstetten, Germany). Data processing was performed using MestReNova software.
The solubility of degraded CS at different pH was estimated from the transmittance of their solutions. A UVvis spectrophotometer using a quartz cell with an optical path length of 1 cm at 600 nm was used to record the transmittance of the solutions (Kubota, Tatsumoto, Sano, and Toya, 2000). The samples concentration was 5 mg mL-1. The pH value of the solution was adjusted by the stepwise addition of HCl (2 mol L-1) and NaOH (2 mol L-1).
Differential scanning calorimetry (DSC) was carried out on a PERKIN ELMER PYRISL. The suspension (20 mg) was sealed in a stainless pan. The temperature program consisted of heating from 0 to 600℃ at 1℃ min-1, and the cycle was repeated three times.
2.5 In vitro Blood CompatibilityFresh whole blood from a New Zealand white rabbit donor was collected in sodium citrate anticoagulant tubes. CS0, CS12, CS24, CS96 and CS154 were dispersed in saline at concentrations of 1% and pre-warmed at 37℃. Then, 60 μL of blood sample was added into 3 mL mixtures and incubated at 37℃ for 1 h, which were centrifugated at 2000 r min-1 for 5 min to collect the supernatants subsequently. The absorbance of supernatants was detected on a UV-vis spectrophotometer (UV-1200 MAPADA, Shanghai, China) at 545 nm to determine the hemolysis ratio. Deionized water and saline without sample were employed as positive control and negative control, respectively. The hemolysis ratio (HR) was calculated by following equation:
| $ H R(\%)=\left(D_{\mathrm{S}}-D_{\mathrm{N}}\right) /\left(D_{\mathrm{P}}-D_{\mathrm{N}}\right) \times 100. $ |
Here, DS, DN, and DP were the absorbance of the sample, 0.9% NaCl solution and deionized water, respectively.
Laboratory animals were cared and used according to the National Research Council's Guide, as well as the native laws and institutional guidelines, following the protocols of Laboratory Animal Management Regulations of People's Republic of China (edition 2011) in all animal studies.
2.6 Statistical AnalysisThe data collected in this study are presented as mean ± SD and statistically analyzed by one-way analysis of variance with Sigma Plot, version 11.0 (Systat Software Inc., US). The differences were considered to be statistically significant when the P values were less than 0.05.
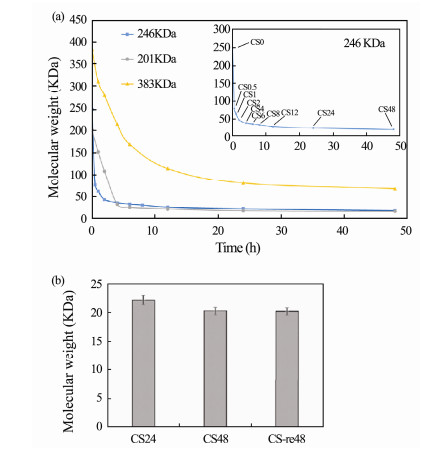
3 Results and Discussion 3.1 Heterogeneous Degradation of CSCS could be dramatically degraded by HCl/ethanol solution, which presented as the sharp decline of the Mw. Besides, the Mw of degraded CS was significantly correlated with the hydrolysis time. As shown in Fig. 1a, during the initial 30 min of reaction, the Mw drastically decreased to 76 kDa and subsequently slowed down to 22 kDa at 24 h, which basically unchanged at 18 kDa after 24 h. The reason could be explained as followed: at the beginning of the reaction, the CS molecular chains had a large number of amorphous portions externally, whichwere sufficiently contacted with the acid and rapidly hydrolyzed (Kalita et al., 2019), led to the drastically decrease of Mw. In contrast to the amorphous portions, the crystalline portions in CS molecular chains were much more stable and harder to be hydrolyzed. Thus, the Mw decrease rate become slower with the degradation progress went on (Osorio-Madrazo et al., 2010). CS of different Mw could be obtained by controlling the treatment time. Besides, no significant change in the size of chitosan powder before and after degradation was observed. The size of chitosan powder before and after degradation ranged from 5 to 50 μm.
|
Fig. 1 (a) Degradation of CS with molecular weight of 246 kDa, 201 kDa and 383 kDa. (b) Molecular weight of CS24, CS48 and CS-re48. |
The influence of raw CS Mw on degradation effect was also studied. Fig. 1b showed the degradation process of CS with Mw of 383 kDa and 201 kDa, the final Mw of which was 67 kDa and 17 kDa, respectively. The result demonstrated that under same degradation conditions, the final Mw of degraded CS was related to that of raw material.
To further elucidate the stability of the degraded CS, CS with Mw of 246 kDa which had been degraded for 48 h was subjected to hydrolysis for 48 h with fresh hydrolysis solution again and coded as CS-re48. As shown in Fig. 1, Mw of CS24 was higher than that of CS48, illustrated that the high molecular CS was not completely degraded by this hydrolysis solution after 24 h. In contrast with CS24, the Mw of CS-re48 did not obviously alter compared with that of CS48, demonstrated that re-hydrolysis treatment failed to further degraded the hydrolyzed CS. Degraded CS with stable Mw was obtained after hydrolysis for 48 h.
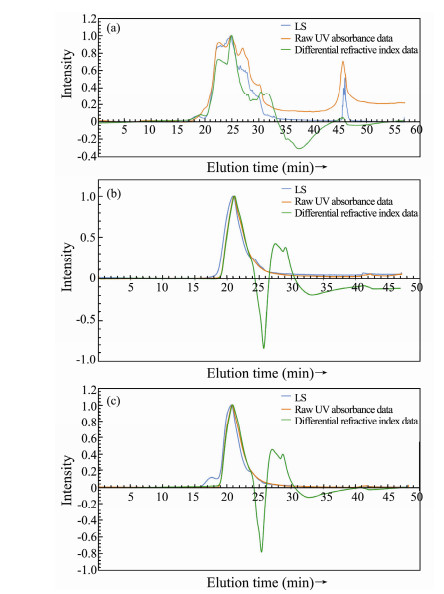
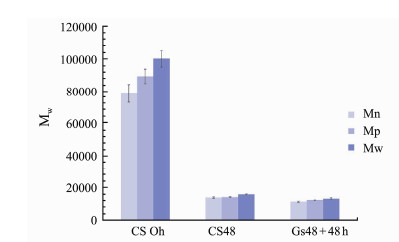
3.2 Distribution of Molecular WeightBesides low Mw, the degraded CS also possessed narrow Mw distribution. The results of GPC analysis of CS0 showed that multiple absorbance peaks were detected by both light scattering (LS) detector and ultraviolet (UV) detector, indicated CS molecular chains with various lengths were existed, which led to the wide Mw distribution. Compared with CS0, only one strong peak was observed in CS48 and CS-re48, suggested the Mw distribution of CS48 and CS-re48 were significantly narrower (Fig. 2). The elution time of mostly CS48 and CS-re48 molecule was between 19 min and 26 min. This conclusion was also reflected in the Mn, Mp and Mw of CS0, CS48 and CS-re48. In addition to the obviously lower average value, the coefficient of variation (CV) of CS48 and CS-re48 was significantly smaller than CS0, so was the Mw/Mn value (Fig. 3), demonstrated the molecule of CS48 and CS-re48 were much more uniform than that of CS0. This phenomenon could be explained that the long molecular chains of raw CS contained more amorphous regions compared with the short ones (Xia et al., 2017). Normally the stability of amorphous regions was weaker than crystal regions (Nguyen et al., 2015). Thus, the long molecular chains were more susceptible to hydrolysis than short chains during degraded progress, which finally led to smaller Mw and more uniform Mw distribution as degradation progresses. Moreover, no distinct differences were observed between the GPC analysis results of CS48 and CS-re48, indicated that re-hydrolysis treatment failed to influence the Mw distribution of the degraded CS.
|
Fig. 2 GPC traces of (a) CS0, (b) CS48 and (c) CS-re48 measured by a triple detector system, including lightscattering(LS), UV absorbance, and refractive index detectors. |
|
Fig. 3 Number average molecular weight (Mn), Peak-average molecular weight (Mp), Weight average molecular weight (Mw) of CS0, CS48 and CS-re48. |
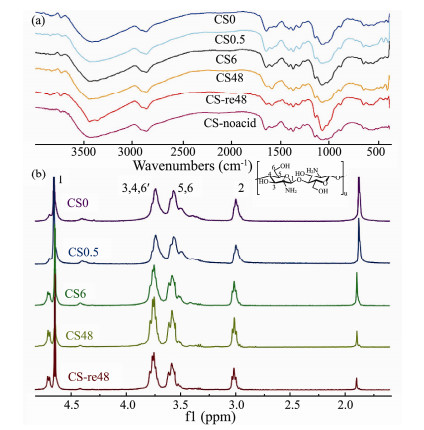
The chemical structure of degraded CS was analyzed by FT-IR and 1H NMR to clarified if it would be changed by the heterogeneous degradation process. As shown in Fig. 4(a), the FT-IR spectra of CS0.5, CS6, CS48 and CS-re48 was similar with that of CS0, in which the characteristic peaks could be observed, including the C-O band in C6 at 1031 cm-1, C-N stretching absorption at 1379 cm-1, and -OH stretching presented at 3445 cm-1 (Cocarta et al., 2017). In consistence with FT-IR spectra, little differences were observed among the 1H NMR spectra of CS0.5, CS6, CS48, CS-re48 and CS0 (Fig. 4(b)). The results demonstrated that the treatment of aqueous HCl/ethanol solution could only break the hydrogen bond and glycosidic bond between saccharide residues, and would not destroy the CS molecular backbone.
|
Fig. 4 (a) FTIR spectra and (b) 1H NMR spectra of degraded CS. |
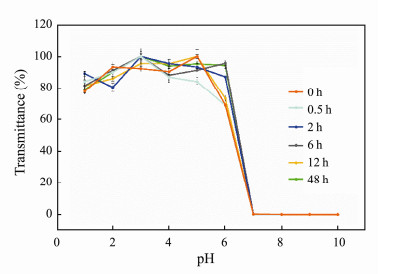
The solubility of the series of degraded CS was also studied, the results of which were shown in Fig. 5. Identical with the untreated sample, the degraded CS could hardly dissolve in neutral and alkaline aqueous solution, which made the transmittance (%) of the mixture be close to zero, though the degraded CS owned slightly better solubility in aqueous solution with the pH value at 6. The result indicated that the solubility of degraded CS was consistent with that of raw CS.
|
Fig. 5 Effect of pH on the solubility of degraded CS. |
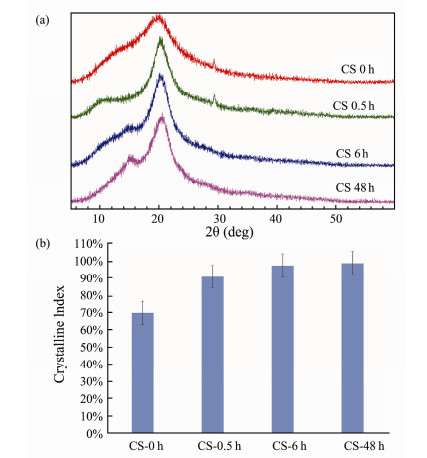
Crystalline indexes of CS sample and degraded CS were characterized by XRD. Fig. 6(a) showed the XRD pattern of CS0, CS0.5, CS6 and CS48, which clearly displayed the evolution of the CS crystal regions as the hydrolysis progresses. The major peak at 2θ=20°, which represents the plane of crystalline CS (Wang et al., 2016), was dramatically sharpening after 0.5 h's hydrolysis. This result indicated that the hydrolysis treatment could enhance crystalline index of CS, which significantly increased from 70.32% (CS0) to 91.32%, 97.92%, 99.25% after degraded for 0.5 h, 6 h and 48 h (Fig. 6(b)), respectively. Besides, as the hydrolysis proceeded, a new peak at 2θ=15° appeared and increased. We supposed that the crystal region of this peak was low content in raw CS, thus the signal of this region was shielded by amorphous regions. During the degradation progress, the amorphous regions were hydrolyzed earlier than this crystal region, which resulted that the relative content of the crystal region become higher (Wu et al., 2019). Therefore, the peak become more visible. The XRD analysis suggested that heterogeneous degradation by aqueous HCl/ethanol solution was highly effective in strengthen the crystalline index of CS (Wu et al., 2016). This result also demonstrated the degraded CS molecular chains contained higher ratio of crystal regions, which were harder to be further hydrolyzed. Therefore, after heterogeneous degradation, the Mw become smaller, while the Mw distribution was more uniform.
|
Fig. 6 (a) XRD spectra of degraded CS and (b) the crystalline index of degraded CS. |
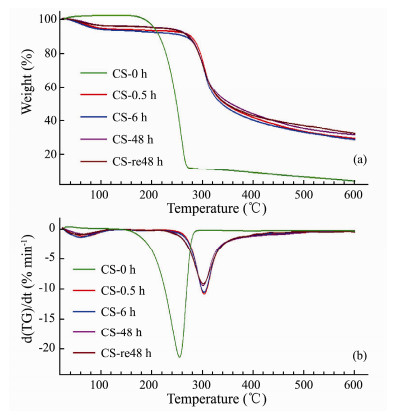
TG analysis was conducted in the next step. Normally, samples with higher crystalline index possessed more superior thermal stability, since extra heat was needed to destroy the crystal regions compared with the amorphous regions (Corazzari et al., 2015). As shown in Fig. 7, the maximum weight loss temperature of degraded CS samples was significantly higher than untreated samples. Moreover, the d(TG)/dt of degraded CS samples at the maximum weight loss temperature was pronounced lower than that of untreated samples. Thus, the residual weight of degraded CS samples was much higher than untreated samples. The results were consistent with that of XRD analysis, which suggested the treatment of heterogeneous degradation strengthened the crystal index of CS, for the thermal stability of degraded products was distinctly enhanced (Lim et al., 2018).
|
Fig. 7 (a) TG and (b) DTG of degraded CS. |
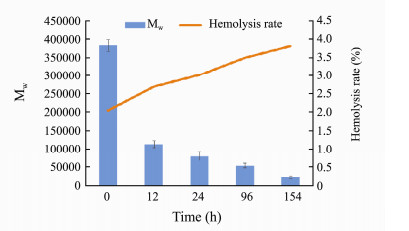
As a biomaterial utilized for the products directly contacting blood, excellent blood compatibility is required to avoid hemolysis, since poor blood compatibility might cause tissue necrosis or even death. As shown in Fig. 8, the hemolysis rates of samples degraded no more than 154 h were all below 5%, suggested degraded samples having excellent blood compatibility, though the hemolysis rate increased with the extension of processing time (Li et al., 2017). The increase of hemolysis rate might be resulted by weaker protein adsorption capacity of low Mw CS (Shen et al., 2017), which led to the increase of free hemoglobin in solution. Thus, the hemolysis rate of degraded CS was higher than raw material. The degraded CS obtained by this heterogeneous degradation method could be applicated as the material for blood contact products.
|
Fig. 8 Hemolysis rate of degraded CS. |
In this work, aqueous HCl/ethanol solution was employed for CS heterogeneous degradation. The Mw of CS sharply decreased during the initial 2 h of the hydrolysis progress, then slightly declined, and changed little 24 h. The final Mw of products was dependent on the raw materials. Besides lower Mw, the degraded CS obtained also possessed narrow Mw distribution. Moreover, treatment of the hydrolysis solution failed to destroy basic structure of chitosan backbone, and could hardly obviously influence water solubility of CS. Furthermore, compared with the untreated sample, the crystalline index of degraded products was significantly higher, which resulted in the enhancement of the thermal stability. Hemolysis rate measurement showed that similar with untreated samples, the degraded products exhibited excellent biocompatibility. In conclusion, this heterogeneous degradation method had the potential to be utilized for the producing of homogenization molecular CS, which was favorable for the fabrication of medical products requiring CS with such quality.
AbbreviationsMw, molecular weight; CS, chitosan; GPC, gel permeation chromatography; FT-IR, Fourier transform infrared spectroscopy; 1H NMR, nuclear magnetic resonance spectroscopy; XRD, X-ray diffraction; TG, thermogravimetric; HR, hemolysis rate.
AcknowledgementsThis work was supported by the National Natural Science Foundation of China (Nos. U1706212 and 81671828).
Cabrera, J. C. and Van Cutsem, P., 2005. Preparation of chitooligosaccharides with degree of polymerization higher than 6 by acid or enzymatic degradation of chitosan. Biochemical Engineering Journal, 25(2): 165-172. (  0) 0) |
Chan, L. W., Kim, C. H., Wang, X., Pun, S. H., White, N. J. and Kim, T. H., 2016. PolySTAT-modified chitosan gauzes for improved hemostasis in external hemorrhage. Acta Biomaterialia, 31: 178-185. DOI:10.1016/j.actbio.2015.11.017 (  0) 0) |
Chen, Q., Xiao, W., Zhou, L., Wu, T. and Wu, Y., 2012. Hydrolysis of chitosan under microwave irradiation in ionic liquids promoted by sulfonic acid-functionalized ionic liquids. Polymer Degradation and Stability, 97(1): 49-53. DOI:10.1016/j.polymdegradstab.2011.10.014 (  0) 0) |
Cheung, R., Ng, T., Wong, J. and Chan, W., 2015. Chitosan: An update on potential biomedical and pharmaceutical applications. Marine Drugs, 13(8): 5156-5186. DOI:10.3390/md13085156 (  0) 0) |
Chokradjaroen, C., Rujiravanit, R., Watthanaphanit, A., Theeramunkong, S., Saito, N., Yamashita, K. and Arakawa, R., 2017. Enhanced degradation of chitosan by applying plasma treatment in combination with oxidizing agents for potential use as an anticancer agent. Carbohydrate Polymers, 167: 1-11. DOI:10.1016/j.carbpol.2017.03.006 (  0) 0) |
Cocarta, A. I., Gutanu, V. and Dragan, E. S., 2017. Structural, morphological and magnetic characterization of metal-chitosan/poly (vinyl amine) complexes. Journal of Polymer Research, 24(2): 20. DOI:10.1007/s10965-016-1182-3 (  0) 0) |
Corazzari, I., Nisticò, R., Turci, F., Faga, M. G., Franzoso, F., Tabasso, S. and Magnacca, G., 2015. Advanced physicochemical characterization of chitosan by means of TGA coupled on-line with FTIR and GCMS: Thermal degradation and water adsorption capacity. Polymer Degradation and Stability, 112: 1-9. DOI:10.1016/j.polymdegradstab.2014.12.006 (  0) 0) |
Dorati, R., Pisani, S., Maffeis, G., Conti, B., Modena, T., Chiesa, E. and Genta, I., 2018. Study on hydrophilicity and degradability of chitosan/polylactide-co-polycaprolactone nanofibre blend electrospun membrane. Carbohydrate Polymers, 199: 150-160. DOI:10.1016/j.carbpol.2018.06.050 (  0) 0) |
Furuike, T., Komoto, D., Hashimoto, H. and Tamura, H., 2017. Preparation of chitosan hydrogel and its solubility in organic acids. International Journal of Biological Macromolecules, 104: 1620-1625. DOI:10.1016/j.ijbiomac.2017.02.099 (  0) 0) |
Gao, T. T., Kong, M., Cheng, X. J., Xia, G. X., Gao, Y. Y., Chen, X. G. and Park, H. J., 2014. A thermosensitive chitosan-based hydrogel for controlled release of insulin. Frontiers of Materials Science, 8(2): 142-149. DOI:10.1007/s11706-014-0247-7 (  0) 0) |
Hamedi, H., Moradi, S., Hudson, S. M. and Tonelli, A. E., 2018. Chitosan based hydrogels and their applications for drug delivery in wound dressings: A review. Carbohydrate Polymers, 199: 445-460. DOI:10.1016/j.carbpol.2018.06.114 (  0) 0) |
Huang, Q. Z., Wang, S. M., Huang, J. F., Zhuo, L. H. and Guo, Y. C., 2007. Study on the heterogeneous degradation of chitosan with hydrogen peroxide under the catalysis of phosphotungstic acid. Carbohydrate Polymers, 68(4): 761-765. DOI:10.1016/j.carbpol.2006.08.015 (  0) 0) |
Huang, Q. Z., Zhuo, L. H. and Guo, Y. C., 2008. Heterogeneous degradation of chitosan with H2O2 catalysed by phosphotungstate. Carbohydrate Polymers, 72(3): 500-505. DOI:10.1016/j.carbpol.2007.09.022 (  0) 0) |
Kalita, N. K., Nagar, M. K., Mudenur, C., Kalamdhad, A. and Katiyar, V., 2019. Biodegradation of modified Poly(lactic acid) based biocomposite films under thermophilic composting conditions. Polymer Testing, 76: 522-536. DOI:10.1016/j.polymertesting.2019.02.021 (  0) 0) |
Kloster, G. A., Muraca, D., Londoño, O. M., Knobel, M., Marcovich, N. E. and Mosiewicki, M. A., 2018. Structural analysis of magnetic nanocomposites based on chitosan. Polymer Testing, 72: 202-213. DOI:10.1016/j.polymertesting.2018.10.022 (  0) 0) |
Li, J., Ma, F. K., Dang, Q. F., Liang, X. G. and Chen, X. G., 2014. Glucose-conjugated chitosan nanoparticles for targeted drug delivery and their specific interaction with tumor cells. Frontiers of Materials Science, 8(4): 363-372. DOI:10.1007/s11706-014-0262-8 (  0) 0) |
Li, K., Xing, R., Liu, S., Qin, Y., Meng, X. and Li, P., 2012. Microwave-assisted degradation of chitosan for a possible use in inhibiting crop pathogenic fungi. International Journal of Biological Macromolecules, 51(5): 767-773. DOI:10.1016/j.ijbiomac.2012.07.021 (  0) 0) |
Li, X., Tang, J., Bao, L., Chen, L. and Hong, F. F., 2017. Performance improvements of the BNC tubes from unique double-silicone-tube bioreactors by introducing chitosan and heparin for application as small-diameter artificial blood vessels. Carbohydrate Polymers, 178: 394-405. DOI:10.1016/j.carbpol.2017.08.120 (  0) 0) |
Li, Y., Li, J., Liu, T., Wang, Y., Zhou, Z., Cheng, F. and Chen, X., 2017. Preparation and antithrombotic activity identification of Perinereis aibuhitensis extract: A high temperature and wide pH range stable biological agent. Food and Function, 8(10): 3533-3541. DOI:10.1039/C7FO00987A (  0) 0) |
Liang, D., Lu, Z., Yang, H., Gao, J. and Chen, R., 2016. Novel asymmetric wettable AgNPs/chitosan wound dressing: In vitro and in vivo evaluation. ACS Applied Materials and Interfaces, 8(6): 3958-3968. DOI:10.1021/acsami.5b11160 (  0) 0) |
Lim, L. M., Tran, T. T., Wong, J. J. L., Wang, D., Cheow, W. S. and Hadinoto, K., 2018. Amorphous ternary nanoparticle complex of curcumin-chitosan-hypromellose exhibiting builtin solubility enhancement and physical stability of curcumin. Colloids and Surfaces B: Biointerfaces, 167: 483-491. DOI:10.1016/j.colsurfb.2018.04.049 (  0) 0) |
Liu, N., Chen, X. G., Park, H. J., Liu, C. G., Liu, C. S., Meng, X. H. and Yu, L. J., 2006. Effect of MW and concentration of chitosan on antibacterial activity of Escherichia coli. Carbohydrate Polymers, 64(1): 60-65. DOI:10.1016/j.carbpol.2005.10.028 (  0) 0) |
Nguyen, A. T., Huang, Q. L., Yang, Z., Lin, N., Xu, G. and Liu, X. Y., 2015. Crystal networks in silk fibrous materials: From hierarchical structure to ultra performance. Small, 11(9-10): 1039-1054. DOI:10.1002/smll.201402985 (  0) 0) |
Nidheesh, T., Kumar, P. G. and Suresh, P. V., 2015. Enzymatic degradation of chitosan and production of d-glucosamine by solid substrate fermentation of exo-β-d-glucosaminidase (exochitosanase) by Penicillium decumbens CFRNT15. International Biodeterioration and Biodegradation, 97: 97-106. DOI:10.1016/j.ibiod.2014.10.016 (  0) 0) |
Osorio-Madrazo, A., David, L., Trombotto, S., Lucas, J. M., Peniche-Covas, C. and Domard, A., 2010. Kinetics study of the solid-state acid hydrolysis of chitosan: Evolution of the crystallinity and macromolecular structure. Biomacromolecules, 11(5): 1376-1386. DOI:10.1021/bm1001685 (  0) 0) |
Shen, S. S., Yang, J. J., Liu, C. X. and Bai, R. B., 2017. Immobilization of copper ions on chitosan/cellulose acetate blend hollow fiber membrane for protein adsorption. RSC Advances, 7(17): 10424-10431. DOI:10.1039/C7RA00148G (  0) 0) |
Sun, G., Zhang, X., Bao, Z., Lang, X., Zhou, Z., Li, Y. and Chen, X., 2018. Reinforcement of thermoplastic chitosan hydrogel using chitin whiskers optimized with response surface methodology. Carbohydrate Polymers, 189: 280-288. DOI:10.1016/j.carbpol.2018.01.083 (  0) 0) |
Vårum, K. M., Ottøy, M. H. and Smidsrød, O., 2001. Acid hydrolysis of chitosans. Carbohydrate Polymers, 46(1): 89-98. DOI:10.1016/S0144-8617(00)00288-5 (  0) 0) |
Wang, D., Zhao, T., Yan, L., Mi, Z., Gu, Q. and Zhang, Y., 2016. Synthesis, characterization and evaluation of dewatering properties of chitosan-grafting DMDAAC flocculants. International Journal of Biological Macromolecules, 92: 761-768. DOI:10.1016/j.ijbiomac.2016.07.087 (  0) 0) |
Wang, S. M., Huang, Q. Z. and Wang, Q. S., 2005. Study on the synergetic degradation of chitosan with ultraviolet light and hydrogen peroxide. Carbohydrate Research, 340(6): 1143-1147. DOI:10.1016/j.carres.2005.02.009 (  0) 0) |
Wu, J., Guo, L., Wen, M., Bu, T., Zhou, P., Zhong, J. and Zhang, Q., 2019. The self-assembling growth of copper nanowires for transparent electrodes. Journal of Wuhan University of Technology-Materials Science Edition, 34(1): 145-149. DOI:10.1007/s11595-019-2028-8 (  0) 0) |
Wu, T., Wu, C., Xiang, Y., Huang, J., Luan, L., Chen, S. and Hu, Y., 2016. Kinetics and mechanism of degradation of chitosan by combining sonolysis with H2O2/ascorbic acid. RSC Advances, 6(80): 76280-76287. DOI:10.1039/C6RA11197A (  0) 0) |
Xia, R., Cao, X., Gao, M., Zhang, P., Zeng, M., Wang, B. and Wei, L., 2017. Probing sub-nano level molecular packing and correlated positron annihilation characteristics of ionic crosslinked chitosan membranes using positron annihilation spectroscopy. Physical Chemistry Chemical Physics, 19(5): 3616-3626. DOI:10.1039/C6CP07434K (  0) 0) |
Younes, I. and Rinaudo, M., 2015. Chitin and chitosan preparation from marine sources. Structure, properties and applications. Marine Drugs, 13(3): 1133-1174. DOI:10.3390/md13031133 (  0) 0) |
Yu, X., Mu, Y., Xu, M., Xia, G., Wang, J., Liu, Y. and Chen, X., 2017. Preparation and characterization of mucosal adhesive and two-step drug releasing cetirizine-chitosan nanoparticle. Carbohydrate Polymers, 173: 600-609. DOI:10.1016/j.carbpol.2017.05.067 (  0) 0) |
Zhang, H. and Neau, S. H., 2002. In vitro degradation of chitosan by bacterial enzymes from rat cecal and colonic contents. Biomaterials, 23(13): 2761-2766. DOI:10.1016/S0142-9612(02)00011-X (  0) 0) |
Zhou, H. Y., Zhou, D. J., Zhang, W. F., Jiang, L. J., Li, J. B. and Chen, X. G., 2011. Biocompatibility and characteristics of chitosan/cellulose acetate microspheres for drug delivery. Frontiers of Materials Science, 5(4): 367-378. DOI:10.1007/s11706-011-0146-0 (  0) 0) |
Zou, P., Yang, X., Wang, J., Li, Y., Yu, H., Zhang, Y. and Liu, G., 2016. Advances in characterisation and biological activities of chitosan and chitosan oligosaccharides. Food Chemistry, 190: 1174-1181. DOI:10.1016/j.foodchem.2015.06.076 (  0) 0) |
 2020, Vol. 19


