2) Shandong Provincial Key Laboratory of Marine Environment and Geological Engineering, Ocean University of China, Qingdao 266100, China;
3) Key Laboratory of Submarine Geosciences and Prospecting Techniques, Ministry of Education, Ocean University of China, Qingdao 266100, China;
4) First Institute of Oceanography, Ministry of Natural Resource, Qingdao 266061, China;
5) National Deep Sea Center, Qingdao 266237, China
In the estuary coastal area, the reversal of the 210Pbex specific activity profile has been widely reported (Smith and Walton, 1980; Lin et al., 1998; Kirchner, 2011; Zhou et al., 2018) and was generally considered to be caused by erosion and re-deposition processes. The erosion and re-deposition made the sediments experienced an off-site transport in the horizontal space. However, on-site pore-pressure monitorring at coastal sites shows that a sandy seabed may liquefy due to large storm waves (Zen and Yamazaki, 1991; Sassa et al., 2006; Chang et al., 2007). Liquefaction has also been observed in the silt seabed of the Yellow River delta during storm waves and the liquefaction depth exceeded 3.3 m (Xu et al., 2018; Xu et al., 2021).
Sedimentary dynamic probing devices in the Yellow River subaqueous delta have been established to detect the phenomenon of slide resurrection in the silt seabed under strong wave conditions (Prior et al., 1989). The collapse depressions in the Yellow River Delta and the Mississippi Delta (Coleman et al., 1980; Prior et al., 1986), and the disdisturbed strata found during the submarine engineering and geological surveys of offshore oil production in the Sheng Li Oilfield of the Yellow River Delta (Xu et al., 2009), were identified as the result of liquefaction under the action of strong waves (Xu et al., 2012; Wang et al., 2013). The collapse depressions in the subaqueous delta of Mississippi River should be the landform remains of sediments after liquefaction (Coleman et al., 1981). The wave flume experiments demonstrate that liquefied sediments fluctuated with wave activity (Mutlu Sumer et al., 2006; Xu et al., 2012). During the continuous fluctuating of liquefied sediments, the sediment particles undergo a simultaneous wave-induced separation process with the overlying water body characterized by clay rising and relatively coarse particles sinking (Wang et al., 2014; Ren et al., 2020, 2021), which formed the storm liquefaction deposits with five sedimentary stratum (A to E, from bottom to top) due to fluctuated sorting in situ (Xu et al., 2016). The surface of seabed where storm liquefaction deposits occurred was notably lower than the surrounding un-liquefied areas (Fig. 14 in Xu et al., 2016). The sedimentary stratification of storm liquefaction deposits were formed by the vertical migration of sediments during the in-situ fluctuation. In this way, some of the older clays from the deeper stratum can be transported into the water column (Yu et al., 2010; Ren et al., 2021), participating in the new deposition process, while a significant portion may just move up and stay in the upper strata. Therefore, the dating results may be disordered, particularly when clays in the lower stratum continues to move up into the upper stratum.
During the wave flume experiment in laboratory, we observed that the sedimentary beds of liquefaction zone subsided and convolute bedding occurred in the liquefied sediments (Wang et al., 2013; Xu et al., 2016). Acoustic detection of seabed strata revealed turbulence in the profiles, which may be caused by the discontinuities in the acoustic reflection interfaces due to the convolute bedding. Then, a submarine survey discovered the collapse depression area in-situ, where a certain depth of disturbance occurred in the strata. It can be judged that storm liquefaction deposits formed in the collapse depression and a time-reversal phenomenon of the sedimentary dating may occur. Based on these understandings, we searched for the collapse depressions and disturbed strata in the Yellow River Delta, and analysed the particles size and 210Pb of the disturbed strata to determine whether there was a time-reversal in strata.
2 Investigation Method, Investigation Process and Laboratory TestsDue to the tectonic and sedimentary stability in the estuary coastal area, there is a clear difference between the seabed where liquefaction deposits occur and the adjacent un-liquefied strata. The area where the collapse depressions and the disturbed strata coexist was found in the field. Comparing the strata of this area with the adjacent un-liquefied area and the storm liquefaction deposit strata formed in laboratory, we confirmed the existence of storm liquefaction deposit strata in the estuary coastal zone.
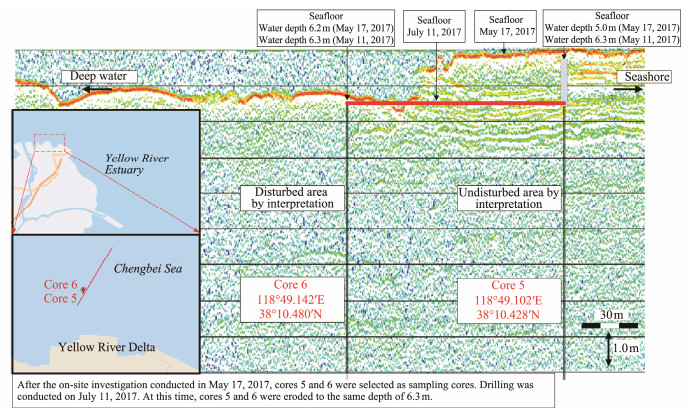
Disturbed strata in the Yellow River subaqueous delta are often present as small round or elliptical areas with a diameter of 10 m to 1 km and a depth of 2 to 5 m (Chen et al., 1992; Xu et al., 2008). To identify the disturbed strata on the seabed, a sub-bottom detection was conducted by deploying multiple survey lines perpendicular to the coast around Chengdao oilfield, located in the northern part of the Yellow River Delta. Data along the survey lines was collected by using GPS, a depth sounder, and a subbottom profiler (SES2000, Innomar Company, Germany). On-site investigations were conducted on May 17, 2017 and analysis of the sub-bottom profile data revealed the presence of disturbed strata along one of the survey lines (Fig. 1). The sea floor in the disturbed area was about 1 m lower than that of the surrounding undisturbed area. Based on the indoor flume experiment, we deduced that the disturbed stratum was formed by wave-induced liquefaction of the seabed. After locating the disturbed area, the borehole core 6 (water depth: 6.2 m; position: 118˚49.142΄E, 38˚10.480΄N) was drilled in the disturbed strata, and an adjacent borehole core 5 (water depth: 5.0 m; position: 118˚49.102΄E, 38˚10.428΄N) was drilled in the undisturbed strata (for the sake of simplification, the following text is referred to as cores 5 and 6). The two drilled cores were 113 m apart. The borehole sampling was conducted on July 11, 2017. Two months after drilling, the seafloor in the vicinity of cores 5 and 6 had flattened due to the erosive effect of ocean dynamics, with both locations now at a water depth of 6.3 m in Fig. 1. Because the Yellow River subaqueous delta was in a heavily eroded area, the high scarp was easily eroded and flattened. The length of the cores was 10 m, and the entire core was collected for laboratory analysis.
|
Fig. 1 Cross-section of the sub-bottom profiling and position of the sampling drill holes. |
The particle size distribution and 210Pbex specific activity are analysed in laboratory. The particle size analysis was conducted using a laser particle size analyzer (Mastersizer 2000, Malvern Panalytical Instruments, UK), and the nomenclature of the sediments was based on the method of Shepard (Shepard, 1954). The 210Pbex specific activity analysis was conducted using a high-purity germanium gamma spectrometer (GWL-120-15, EG & G, USA). The purpose of the particle-size analyses was to obtain the stratigraphic characteristics of the disturbed strata. The purpose of the 210Pbex specific activity analyses was to determine whether the disturbed strata had experienced vertical sediment particle migration due to sediment liquefaction.
In the laboratory, the borehole samples were divided into 20 or 40 mm vertical segments with a ring knife. The density, moisture content, and penetration resistance of each sample were measured to determine an approximate stratigraphic division. Particle size analysis was conducted on samples from each layer to classify the sediment types. At depths below 5.2 m, cores 5 and 6 solely consist of clay and silt (for convenience, core depth is abbreviated as HD and is defined as the depth below the surface of the sea floor) and the sediments in the upper layers (HD < 5.20 m) of the two cores varied greatly. Therefore, the two cores were sampled at intervals of 80 mm to 100 mm from the sea floor to HD = 5.20 m for particle size analysis and at an interval of 0.5 m for 210Pbex specific activity analysis. In addition, three samples from core 6 (HD = 1.10, 3.18, and 5.08 m) were selected for further 210Pbex specific activity analysis, and the results show that the test data was stable.
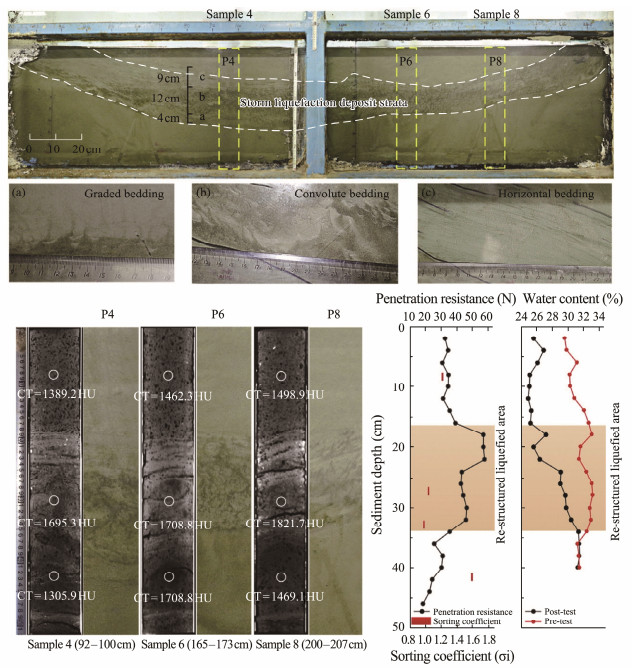
3 Results 3.1 Storm Liquefaction Deposit Strata Formed by Wave Flume ExperimentIn previous wave flume experiments, it was observed that the wave-induced seabed liquefaction enters the liquefaction deposition stage after reaching its maximum depth. During the liquefaction deposition stage, the soil particles originally suspended in the water gradually settle to form a liquefaction restructured strata (Fig. 2). Tests on the penetration resistance, density, water content, and bedding characteristics of liquefaction restructured strata revealed increased penetration resistance and density, decreased water content, and coexistence of graded bedding, convolute bedding, and horizontal bedding. These bedding features lead to disordered and discontinuous reflection signals in acoustic sub-bottom profiles, indicating disturbed strata in geotechnical surveys.
|
Fig. 2 Storm liquefaction deposit strata formed in the laboratory (Xu et al., 2016). |
During the formation process of restructured strata, the differential movement of coarse and fine particles in liquefied soil leads to an increase in density of the seabed strata (with coarse particles settling and fine particles floating), as well as the precipitation of a significant amount of fine particles such as clay on the seabed surface. After the liquefaction of sediment bed, the collapse depressions in the damaged area were observed (Fig. 3), indicating a correlation in distribution between collapse depressions and liquefaction restructured strata.

|
Fig. 3 Collapse depression formed by seabed liquefaction (Xu et al., 2009, 2016). |
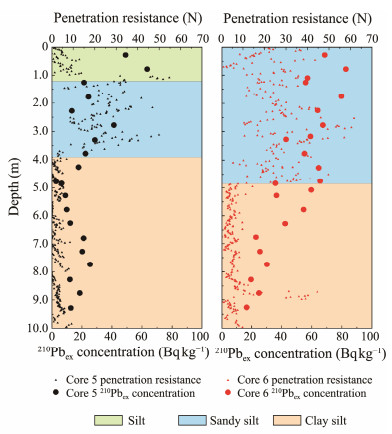
The penetration resistance of the samples can reflect the sediment composition. Based on the downcore variation of 210Pbex specific activity and penetration resistance, cores 5 and 6 were divided into multiple sedimentary stratigraphic units (Fig. 4), with each unit named according to the particle size analysis results of the corresponding layers.
|
Fig. 4 Stratigraphic division of the cores in upper 10-m sections. Core 5: 0 – 1.20 m silt; 1.20 – 3.90 m sandy silt; 3.90 – 10.00 m clay silt with silt interlayer. Core 6: 0 – 4.85 m sandy silt; 4.85 – 10.00 m clay silt. |
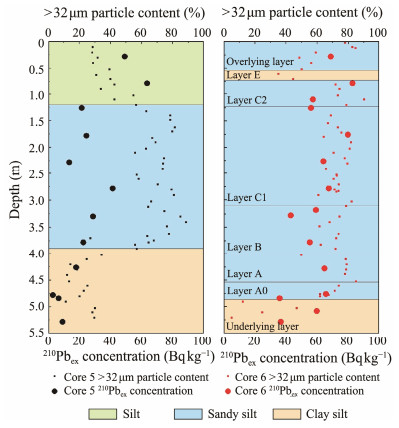
According to particle size analysis of samples collected from upper 5.2 m of the cores at intervals of 80 mm to 100 mm, we observed a trend in average particle size of the sediments changing with depth, which was in agreement with the trend of particle sizes greater than 32 μm (the stratigraphic histogram and average particle size information of cores 5 and 6 are not shown). Therefore, the content of particles greater than 32 μm and the 210Pbex specific activity were plotted against the depth. Based on this, the stratigraphy was meticulously divided (Fig. 5). The formation of a storm liquefaction deposit is due to subsidence of the upper coarser particles and the upward movement of the finer particles. Each layer in the sequence is generally composed of relatively coarse particles at the bottom due to variations of fluctuating intensity and time (Xu et al., 2016). At the same time, the vertical movement of the coarse-grained and fine-grained particles leads to remixing. Therefore, the 210Pbex specific activity of the samples varied because of the differences in the proportion of fine-grained particles in the lower part and coarse-grained particles in the upper. The sub-bottom profiling result showed that the strata of core 5 had not been disturbed, which is the same as that in the front of storm. The disturbance of core 6 was obvious. Based on the grain size and the 210Pbex specific activity, the sequence of the storm liquefaction deposits was determined.
|
Fig. 5 Stratigraphic division of the cores in upper 5.5 m. The strata from core 6 were further subdivided according to the sequence of the storm liquefaction deposits. Core 6: 0 – 0.56 m sandy silt; 0.56 – 0.74 m clay silt; 0.74 – 1.24 m sandy silt; 1.24 – 3.10 m sandy silt; 3.10 – 4.00 m sandy silt; 4.00 – 4.55 m sandy silt; 4.55 – 4.85 m sandy silty; 4.85 – 5.55 m clay silt. |
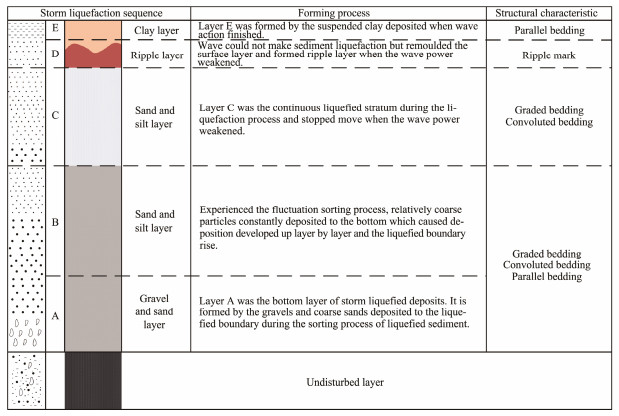
The characteristics of storm liquefaction deposits can be summarized as follows: the sediments fluctuate in situ after liquefaction, with coarser particles settling and clay particles moving upward accompanied by wave sorting. The older clay from lower strata mixes upward into the sediments of upper strata which would cause the dating data of upper strata to appear older and even reverse the dating data. Meanwhile, coarser particles such as gravel and grit were mixed into the clay silt. Five ideal sedimentary layers of storm liquefaction deposit (A to E, bottom to top) were identified (Xu et al., 2016).
|
Fig. 6 Stratigraphic characteristics of storm liquefaction deposits. |
In fact, the separation of coarse-grained and fine-grained particles can be complicated by factors such as increased variation in particle sizes of the sediments, various amounts of sediment rate at each depth, and the strength and duration of the liquefaction fluctuations. Therefore, the division of the experimental depositional layers needs to be adjusted when it is used in the field. The fluctuating liquefaction bottom interface observed in the flume experiments and settling of the upper layer of silt were not observed in layer (A) (Xu et al., 2016), which should be located at a deeper depth. Furthermore, the weaker fluctuations of the sediments near the bottom interface of the liquefaction zone result in the poor sorting of particles, which makes it difficult for coarse particles to settle further down. Thus, an addition layer (A0) of storm liquefaction deposits was defined as a transitional layer between the storm liquefaction deposits and the undisturbed layer.
According to the sub-bottom profile and topography data obtained on May 17, 2017, core 6 was interpreted to contain a storm liquefaction deposit sequence formed by a recent liquefaction event. The liquefaction bottom interface was determined to be at a HD of 4.85 m for the following reasons: 1) compared to the underlying clay silt layer, this layer has a higher content of coarse particles, which settle to the bottom during the liquefaction fluctuations; 2) the 210Pbex specific activity of the stratigraphic samples show an anomalous time-reversal at a HD of 4.85 m and above. We divided the samples from core 6 (HD ≤ 5.55 m) from bottom to top into distinct layers according to the storminduced liquefaction deposits (Fig. 5; core 6), while providing an explanation.
Underlying layer: HD = 5.55 – 4.85 m, consisted of clay silt with an average particle size of 9 – 19 μm and served as the underlying layer of the storm-induced liquefaction deposits.
Layer A0: HD = 4.85 – 4.55 m, consisted of sandy silt with an average particle size of 31 – 44 μm. Layer A0 was a transitional layer between the underlying layer and the liquefaction layer. This layer was situated at the bottom of the liquefaction layer, with weak wave fluctuations and poor particle sorting, which made it difficult to form a particle size sequence for the coarser particles. However, this layer gathered the sediments from the upper layer, as marked by a sharp increase in the 210Pbex specific activity. Additionly, the clay moved upward due to the fluctuations in the underlying layer.
Layer A: HD = 4.55 – 4.00 m, consisted of sandy silt with an average particle size of 48 – 55 μm. This layer contains coarse-grained particles deposited at the liquefaction interface during sorting. In addition, clay particles below this layer can migrate upward smoothly because the 210Pbex specific activity of this layer was lower than that of the underlying layer.
Layer B: HD = 4.00 – 3.10 m, consisted of sandy silt with an average particle size of 29 – 45 μm. This layer underwent sediment liquefied-fluctuations and sorting simultaneously with layer A. If wave intensity above layer B did not weaken, the coarser particles from the upper layers continue to settle, and the clay from layer B and the lower layers moves upwards, which leads to a layer-by-layer deposition upwards, resulting in the continuous rising of the liquefaction interface. The 210Pbex specific activity of this layer showed a downward trend from bottom to top.
Layer C1: HD = 3.10 – 1.24 m, consisted of sandy silt with an average particle size of 35 – 53 μm. This layer was formed over a relatively long period with high intensity fluctuation of storm waves fluctuation. The overall particle size was relatively coarse but a thin layer with an average particle size of 53 μm at a HD of 3.02 m near the lower part of the layer. The increase in 210Pbex specific activity from the top to the bottom of the layer was likely due to the mixing of the fine-grained clay rising in the lower part with the coarse-grained particle sinking in the upper part and the original sediment.
Layer C2: HD = 1.24 – 0.74 m, consisted of sandy silt with an average particle size of 43 – 62 μm. During the storm, the sediments in this layer are always in the state of liquefaction fluctuation. Due to long and intense disturbance, a thin layer of silty sand composed of coarse particles is present at the bottom of the layer (HD = 1.10 – 1.24 m).
Layer E: HD = 0.74 – 0.56 m, consisted of clay silt with an average particle size of 14 – 19 μm, was the negative terrain area formed by the liquefaction. After the storm, the silt in the water body deposited in this layer. In addition, at HD between 0.72 and 0.74 m, the fine sand and silt was observed to mingle with clay. It is speculated that this layer initially consisted of deposited silt suspended by storm liquefaction, with later mixing of fine sand and silty sand due to hydrodynamic forces.
Overlying layer: HD = 0.56 – 0 m, consisted of sandy silt with an average particle size of 22 – 55 μm. The overlying layer was the surface layer which re-deposited after the storm subsided. The 210Pbex specific activity at HD = 0.28 m was lower than that at HD = 0.78 m. It is speculated that during the deposition of this layer, clay suspended from the deeper layer in the process of liquefaction precipitated and mixed into sediments.
The particle size of sediments from the Yellow River Delta is generally fine. In the particle size distribution analysis of sample from core 6, only 2 sediment samples had a maximum particle size of 355 – 420 μm, and only 1.68% of the particles were larger than 125 μm. For the finergrained sediments with relatively small variations in particle size, the storm liquefaction sedimentary sequence observed in the wave flume experiment was unlikely to occur under natural conditions. In this case, the storm liquefaction sedimentary sequence was further divided into 6 layers from bottom to top: layer A0 – the transitional layer between the underlying layer and the storm liquefaction deposit layer; layer A – accumulation layer of coarse-grained particles; layer B – sedimentary return layer; layer C – continuous liquefaction layer; layer D – sand ripple layer; and layer E – desilting clay layer.
3.4 Interpretation of Stratigraphic Sequence Evolution in Cores 5 and 6The Yellow River transports a large amount of sediments into the sea, and the subaqueous delta of the Yellow River exhibits characteristics of rapid deposition. The deposition rate at the outlet can reach as high as 240 cm per year (Li and Xue, 1993). Due to small particle size and strong ocean dynamics, these sediments deposited in a wide range area in horizontal spatial distributions. The core 5 was drilled on the coastline side of the core 6. Since the two drilled cores were 113 m apart, they should have similar sedimentary formations in the early stages. The sub-bottom profile and water depth data obtained on May 17, 2017 indicated that liquefaction may have recently occurred in the area around core 6. A comparative analysis of strata in cores 5 and 6 clearly showed the liquefaction characteristics. Below the HD = 7.0 m, the sediments in both cores 5 and 6 were clay silt, and the 210Pbex specific activity had a good consistency, suggesting the similar sedimentary conditions in these 2 cores during their initial sedimentary stage. The large horizontal spatial distribution of fine sediments in the estuary due to the ocean dynamics further confirmed the similar sedimentary conditions of the two cores. When the core 5 was sampled on July 11, 2017, this area had been eroded to 6.3 m, the same as the core 6, allowing for the comparison of strata according to the same sampling depth of, without considering the original water depth differences.
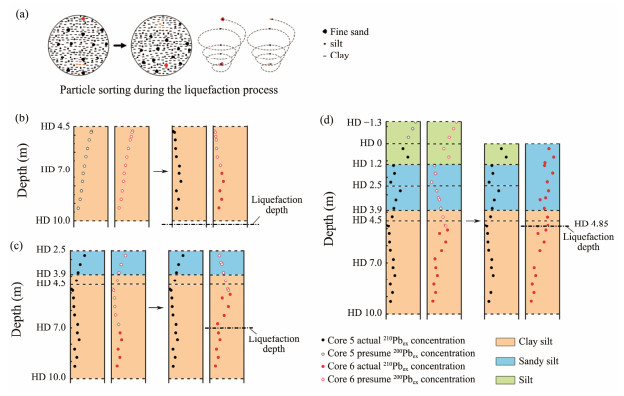
In the layer at HD = 7.0 – 4.5 m of core 5, the 210Pbex specific activity reflects a time-reversal in sedimentary strata, but in the layer HD = 4.5 – 2.5 m, the 210Pbex specific activity displays a normal depositional process. The layer at HD = 7.0 – 5.5 m in core 6 reflected a normal depositional process, but the 210Pbex specific activity indicates a younger age than that of the sediments at the same depth in the core 5. Based on the consistent sedimentary environments when strata formed and the variation characteristics of the 210Pbex specific activity in the same depth of cores 5 and 6, the following depositional hypothesis is proposed to explain this phenomenon (Fig. 7).
|
Fig. 7 Strata formation process in upper 10 m of cores 5 and 6. (a) The relatively coarse particles settle, while the relatively fine particles migrated upwards during the fluctuating process in the liquefaction of the sediment. (b) When deposited at a HD = 4.5 m, the sediments in cores 5 and 6 liquefied under the action of strong waves. (c) At the time of deposition at a HD = 2.5 m, only the sediments in core 6 was liquefied. (d) At the time of deposition at a HD = 1.3 m, only the sediments in core 6 was liquefied, and then, the strata was eroded by 1.3 m. |
The sediments in the layers of HD = 4.5 m in cores 5 and 6 were mainly subjected to the accumulation of silt with a high clay content, and the liquefaction occurred simultaneously during this process (Fig. 7b). Due to the high clay content, a soft layer with high water content was formed. Under the prevailing water depth conditions and storm wave action, the liquefaction occurred to a HD of 10 m (more than 5.5 m below the sea floor at that time). Therefore, below the HD = 4.5 m in core 5, a time reversal of sedimentary strata was detected by the 210Pbex specific activity analysis. Especially at HD = 4.78 m and HD = 4.84 m, the values of 210Pbex specific activity were small compared to those of the upper and lower layers, which may be caused by the upward movement of clay from the deeper layer at HD = 10 m. It was assumed that core 6 experienced the same depositional event as core 5. Thereafter, normal deposition continued in cores 5 and 6 until the deposition of sediments at HD = 2.5 m. The sediments at HD of 4.5 – 3.9 m were clay silt, and the sediments at HD of 3.9 – 2.5 m were sandy silt. At this time, the sediment was liquefied again only in the area around core 6, affecting the sedimentary strata at HD = 2.5 – 7.0 m (the liquefaction depth was about 4.5 m below the sea floor at that time). The liquefaction of the sediments in the area around core 6 was not strong, but making the upper sandy silt mix into the clay silt layer at HD = 3.9 – 7.0 m (Fig. 7c). According to the particle size analysis data of 13 samples at HD = 5.1 – 7.1 m, the average particle size in core 5 is 9 – 24 μm, with 62% of particles falling between 10 μm and 15 μm and 25% particles larger than 32 μm. However, the average particle size of core 6 is 9 – 35 μm. The proportion of particles between 12 μm and 33 μm is 62%, and the average content of particles larger than 32 μm is 29%. The layer at HD = 5.10 – 7.10 m in core 6 had a higher coarse particle content compared to the same layer in core 5, which is potentially the result of the aforementioned liquefaction that occurred in the area around core 6. Due to the re-liquefaction of sediments in the layer at HD = 2.5 – 7.0 m in core 6, the upper sandy silt migrated downwards into the clay silt layer. Consequently, the 210Pbex specific activity decreased from top to bottom from the layer at HD = 5.5 m to the layer at HD = 7.0 m in core 6, which is contrary to the variation trend observed in core 5. The decrease of 210Pbex specific activity at HD = 2.5 – 1.2 m in core 5 was most likely caused by the redeposition of clay particles due to liquefaction in the surrounding area.
Compared to core 5, the 210Pbex specific activity in upper 4.85 m sediment layers from core 6 is larger, which showed the new age characteristics of sediments and the liquefaction depth during the latest event reached 4.85 m. Prior to liquefaction, a 1.3 m thick layer occurred in the upper part with a water depth of 6.3 m during drilling, similar to the case of the core 5, which sank into the lower liquefied stratum during liquefaction. Since the core 5 did not experience the most recent liquefaction, the current surface of the seabed is exposed after eroding the new upper strata (Fig. 7d).
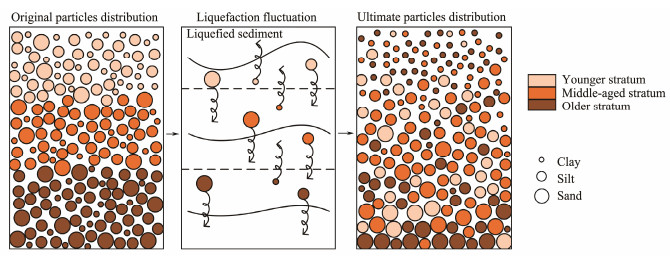
4 DiscussionIn the dating of upper 10 m sedimentary strata in the Yellow River Delta, the 210Pbex activity values often increase abnormally with depth in some layers. This phenomenon may be explained by the fact that these layers undergo a liquefaction event after deposition. The seabed sediments undergo continuous sorting of coarse and fine particles during liquefaction, leading to the upward movement of older fine particles in the lower layers and the downward movement of newer coarse particles in the upper layers. This disturbance disrupts the original normal age sequence, causing anomalous stratigraphic dating results (Fig. 8).
|
Fig. 8 In-situ stratigraphic time reversal caused by storm liquefaction deposit. |
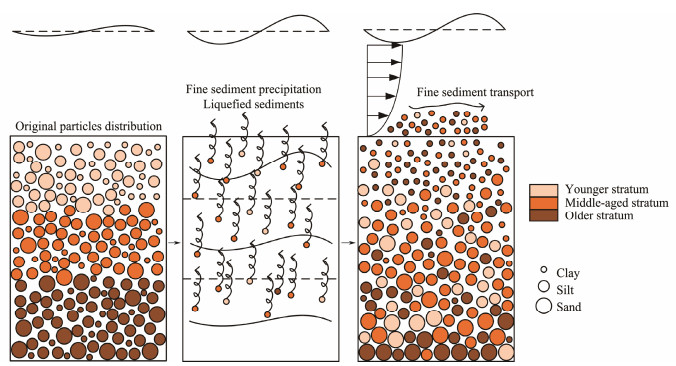
Furthermore, Liu et al. (2007) discovered a 'sink' of sediments from the Yellow River Delta 'source' through drilling in the muddy area of the Shandong Peninsula. Age dating of the sediments revealed a generally older age. It is difficult to explain this phenomenon solely based on the aggregation of sediments erode from the delta surface and resuspended by waves and currents. From the perspective of storm liquefaction deposit, a reasonable explanation can be provided as follows: 1) the sediments of the Yellow River subaqueous delta undergo liquefaction under strong wave conditions; 2) This liquefaction causes a large amount of older fine-grained sediment particles buried in deeper layers to be activated and moved to the seabed surface or enter the water; 3) These fine particles precipitated on the surface are then transported by the combined action of waves, tides, and alongshore currents, and redeposit in areas with weaker dynamics; 4) As a result, the age dating results of the sediments from this 'sink' zone exhibit a reversal of time, with older sediments found on top and newer sediments found below (Fig. 9).
|
Fig. 9 Out-situ stratigraphic time reversal caused by storm liquefaction deposit. |
In this study, based on the characteristics of the storm liquefaction deposits obtained in the laboratory experiment, we identified the storm liquefaction sedimentary strata in the field investigation of the Yellow River Delta. The relationship between the change of 210Pbex specific activity with strata depth and the sediment liquefaction was analyzed and the abnormal time-reversal phenomenon in the shallow strata of the estuary coastal area found by the sedimentary dating was explained. Based on the particle size distribution characteristics of the storm liquefaction deposits, the strata sequence of storm liquefaction deposits obtained in laboratory is redefined.
Because the collapse depressions occur in the region where disturbed strata indicating the storm liquefaction deposits are distributed in the wave flume experiment, the time reversed sediment sequence in the collapse depression area of Yellow River Delta was judged as the storm induced liquefaction deposits. Since there was no direct observation of the formation of storm liquefaction deposits, a further research in the field is necessary to find direct evidence confirming that the time reversal of strata was caused by storm liquefaction deposition.
AcknowledgementsThe funding for this project was provided by the National Natural Science Foundation of China (No. 41976049). We thank Dr. Weilan Xia, a researcher at the Nanjing Institute of Geography and Limnology, Chinese Academy of Sciences, for conducting the 210Pbex specific activity analyses. We would also like to thank Ms. Xinyue Xu and Let-Pub (www.letpub.com) for their assistance with the English translation, and graduate students Xingbei Xu, Mingchao Cao, Huiguang Zhou, Wenhao Chen, Tianlin Zhao and Xinzhi Wang for their help with on-site sampling and sample processing.
Chang, W. J., Rathje, E. M., Stokoe, K. H., and Hazirbaba, K., 2007. In situ pore-pressure generation behavior of liquefiable sand. Journal of Geotechnical and Geoenvironmental Engineering, 133(8): 921-931. DOI:10.1061/(ASCE)1090-0241(2007)133:8(921) (  0) 0) |
Chen, W., Yang, Z., and Prior, D., 1992. The classification and analysis of seafloor micromorphology on the Huanghe River (Yellow River) subaqeous slope. Periodical of Ocean University of Qingdao, 22(1): 71-81 (in Chinese with English abstract). (  0) 0) |
Coleman, J. M., Prior, D. B., and Garrison, L. E., 1981. Subaqueous Sediment Instabilities in the Offshore Mississippi River Delta. Bureau of Land Management, New Orleans OCS Office, 872-881.
(  0) 0) |
Kirchner, G., 2011. 210Pb as a tool for establishing sediment chronologies: Examples of potentials and limitations of conventional dating models. Journal of Environmental Radioactivity, 102(5): 490-494. DOI:10.1016/j.jenvrad.2010.11.010 (  0) 0) |
Li, G., and Xue, C., 1993. Sediment thickness, sedimentation rate and silt body shape of the Yellow River subaqueous delta lobe. Marine Geology & Quaternary Geology, 13(4): 35-44 (in Chinese with English abstract). (  0) 0) |
Lin, R., Min, Y., Wei, K., Zhang, G., Yu, F., and Yu, Y., 1998. 210Pb-dating of sediment cores from the Pearl River Mouth and its environmental geochemistry implication. Geochimica, 27(5): 401-411 (in Chinese with English abstract). DOI:10.3321/j.issn:0379-1726.1998.05.001 (  0) 0) |
Liu, J., Saito, Y., Wang, H., Yang, Z., and Nakashima, R., 2007. Sedimentary evolution of the Holocene subaqueous clinoform off the Shandong Peninsula in the Yellow Sea. Marine Geology, 236: 165-187. DOI:10.1016/j.margeo.2006.10.031 (  0) 0) |
Mutlu Sumer, B., Hatipoglu, F., Fredsøe, J., and Kaan Sumer, S., 2006. The sequence of sediment behaviour during wave-induced liquefaction. Sedimentology, 53(3): 611-629. DOI:10.1111/j.1365-3091.2006.00763.x (  0) 0) |
Prior, D., Suhayda, J., Lu, N., Bornhold, B., Keller, G., Wiseman, W., et al., 1989. Storm wave reactivation of a submarine landslide. Nature, 341(6237): 47-50. DOI:10.1038/341047a0 (  0) 0) |
Prior, D., Yang, Z., Bornhold, B., Keller, G., Lu, N., Wiseman, W., et al., 1986. Active slope failure, sediment collapse, and silt flows on the modern subaqueous Huanghe (Yellow River) Delta. Geo-Marine Letters, 6(2): 85-95. DOI:10.1007/BF02281644 (  0) 0) |
Ren, Y., Xu, X., Xu, G., and Liu, Z., 2020. Measurement and calculation of particle trajectory of liquefied soil under wave action. Applied Ocean Research, 101: 102202. DOI:10.1016/j.apor.2020.102202 (  0) 0) |
Ren, Y., Zeng, Y., Xu, X., and Xu, G., 2021. Sedimentary changes of a sand layer in liquefied silts. Journal of Ocean University of China, 20(5): 1046-1054. DOI:10.1007/s11802-021-4624-4 (  0) 0) |
Sassa, S., Takayama, T., Mizutani, M., and Tsujio, D., 2006. Field observations of the build-up and dissipation of residual pore water pressures in seabed sands under the passage of storm waves. Journal of Coastal Research, 39(1): 410-414. (  0) 0) |
Shepard, F. P., 1954. Nomenclature based on sand-silt-clay ratios. Journal of Sedimentary Research, 24(3): 151-158. (  0) 0) |
Smith, J. N., and Walton, A., 1980. Sediment accumulation rates and geochronologies measured in the Saguenay Fjord using the Pb-210 dating method. Geochimica et Cosmochimica Acta, 44(2): 225-240. DOI:10.1016/0016-7037(80)90134-9 (  0) 0) |
Wang, G., Xu, G., Huang, Z., Liu, H., Sun, Z., and Fang, H., 2014. Experimental study on collapse depth by liquefaction of the silty soil bed. Marine Geology & Quaternary Geology, 34(5): 171-178 (in Chinese with English abstract). (  0) 0) |
Wang, X., Xu, G., Sun, Y., Hu, G., Yu, Y., and Lin, L., 2013. Storm-waves-induced seabed sediment liquefaction and re-stratification on the Yellow River subaqueous delta. Marine Geology & Quaternary Geology, 33(6): 29-40 (in Chinese with English abstract). (  0) 0) |
Xu, G., Liu, Z., Sun, Y., Wang, X., Lin, L., and Ren, Y., 2016. Experimental characterization of storm liquefaction deposits sequences. Marine Geology, 382(1): 191-199. (  0) 0) |
Xu, G., Sun, Y., Wang, X., Hu, G., and Song, Y., 2009. Wave-induced shallow slides and their features on the subaqueous Yellow River Delta. Canadian Geotechnical Journal, 46(12): 1406-1417. DOI:10.1139/T09-068 (  0) 0) |
Xu, G., Sun, Y., Yu, Y., Lin, L., Hu, G., Zhao, Q., et al., 2012. Discussion on storm-induced liquefaction of the superficial stratum in the Yellow River subaqueous delta. Marine Science Bulletin, 14(1): 80-89. (  0) 0) |
Xu, G., Wei, C., Sun, Y., and Song, Y., 2008. The engineering characteristics of shallow disturbed strata and analysis of their formation on the subaqueous Yellow River Delta. Marine Geology & Quaternary Geology, 28(6): 19-25 (in Chinese with English abstract). (  0) 0) |
Xu, X., Xu, G., Yang, J., Xu, Z., and Ren, Y., 2021. Field observation of the wave-induced pore pressure response in a silty soil seabed. Geo-Marine Letter, 41(1): 13. DOI:10.1007/s00367-020-00680-6 (  0) 0) |
Xu, Z., Xu, G., Chen, C., Xu, X., Ren, Y., Ma, C., et al., 2018. The rate characteristics of the wave-induced liquefaction process of the silty soil in the seabed. Periodical of Ocean University of China, 48(1): 115-122 (in Chinese with English abstract). (  0) 0) |
Yu, Y., Xu, G., Zhao, Q., Lin, L., Liu, W., and Guo, X., 2010. An experiment study on L-shaped vertical characteristics of suspended sediment content on the liquefied silty soil bed. Acta Oceanologica Sinica, 32(6): 144-151 (in Chinese with English abstract). (  0) 0) |
Zen, K., and Yamazaki, H., 1991. Field observation and analysis of wave-induced liquefaction in seabed. Soils and Foundations, 31(4): 161-179. (  0) 0) |
Zhou, Y., Zhu, Y., Zhou, S., Liu, J., Wang, S., and Zhuang, L., 2018. Turbidites at the continental slope on the west side of Dongsha uplift in the northern South China Sea. Marine Science, 4(2): 23-33. (  0) 0) |
 2024, Vol. 23


