2) Qingdao Institute of Marine Geology, Ministry of Natural Resources, Qingdao 266071, China;
3) Guangzhou Marine Geological Survey, China Geological Survey, Sanya 572024, China;
4) Guangdong Nanyou Holding Group Company Limited, Guangzhou 510075, China
Natural gas hydrates are crystalline compounds that primarily consist of hydrocarbons, predominantly methane (Koh et al., 2011). They are widely distributed in marine and permafrost environments. There are over 230 regions worldwide with direct or indirect evidence of gas hydrates, with 97% of these occurrences located in continental margin seas. The estimated volume of methane gas stored in gas hydrates is approximately 1.8 × 10¹⁶ to 2.1 × 10¹⁶ m3, surpassing the combined reserves of coal, oil, and conventional natural gas on a global scale (Collett et al., 2009, 2015; Boswell et al., 2020). This immense energy potential has sparked the interest of scientific research communities worldwide. The South China Sea, Nankai Trough of Japan, Ulleung Basin of the East Sea, and the Gulf of Mexico have emerged as key areas for marine gas hydrate investigations (Bahk et al., 2013; Majumdar et al., 2017; Collett et al., 2019; Chen et al., 2022b).
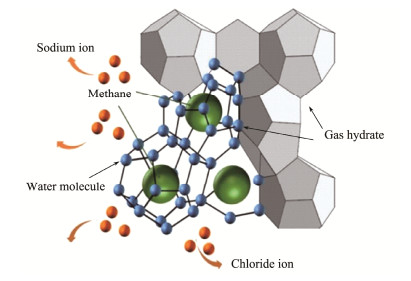
Under high-pressure and low-temperature conditions, the formation of gas hydrates involves the consumption of methane and pore water, leading to the exclusion of salt ions from the process (Fig.1). As gas hydrates grow, the connectivity of sediment pores weakens, and cores may even be obstructed by the presence of insulating solid crystals. As a result, hydrate-bearing reservoirs often exhibit geophysical anomalies. Consequently, electrical resistivity logging plays a crucial role in identifying gas hydrates and are widely employed in marine gas hydrate geological surveys (Wang et al., 2010; Zhang and Wright, 2017; Qian et al., 2018).
|
Fig. 1 Schematic of salt expulsion effect during hydrate formation. |
Taking the Gulf of Mexico Gas Hydrate Joint Industry Project Leg Ⅱ as an example, a comprehensive set of logging data was gathered from sandy reservoirs bearing gas hydrates. This data collection aimed to accurately estimate gas hydrate saturation under diverse geological conditions and analyze the geological factors influencing gas hydrate occurrence (Riedel et al., 2011; Daigle et al., 2018). The logging-while-drilling (LWD) assembly provided by Schlumberger was utilized to obtain the downhole log data (Birchwood and Noeth, 2012). The findings indicated that gas hydrate saturation exhibited significant variability across different sites, and electrical resistivity data were proved useful for determining gas hydrate saturations in sediment grain-supported systems, such as sand reservoirs.
The Korea Institute of Geoscience and Mineral Resources (KIGAM) has conducted regional geophysical surveys and geological studies on gas hydrates in the Ulleung Basin since 2000 (Kang et al., 2009; Lee et al., 2011; Ryu et al., 2013). Utilizing the LWD data acquired during the first Ulleung Basin Gas Hydrate Drilling Expedition (UBGH1), two drilling sites with abnormally high resistivity values (> 80 Ω m) were identified. Gas hydrate saturation was estimated to be higher than 60% based on Archie's equation. Subsequent analysis of core-log and LWD measurements from the second expedition (Table 1) indicated that potential gas hydrate-bearing layers are located at depths ranging from approximately 60 to 180 meters below seafloor (mbsf) (Horozal et al., 2015). The LWD records revealed that the resistivity of background sediments is around 1.0 Ω m, while the resistivity of potential gas hydrate reservoirs ranged from 5.0 to 30.0 Ω m. High resistivity values were observed in coarse-grained turbidites, while medium resistivities were observed in silt-dominant hemi-pelagic and turbiditic sediments. Due to the substantial variations in sediment properties across different layers, it is necessary to establish empirical coefficients in Archie's equation for segmented intervals to enhance the accuracy of gas hydrate saturation calculations.
|
|
Table 1 List of cores and corresponding facies with sediment physical properties (Horozal et al., 2015) |
The first expedition of the Indian National Gas Hydrates Program (NGHP-01) was conducted in 2006 (Riedel et al., 2010). The occurrence of Gas hydrates in the Mahanadi Basin was confirmed through resistivity and sonic logging. Gas hydrate saturations in these sites were estimated to be around 10% – 15% using Archie's equation. The expedition report also highlighted that the empirical parameter in Archie's equation is not a constant and is influenced by factors such as sediment grain size and the occurrence of hydrates (Lee and Collett, 2009).
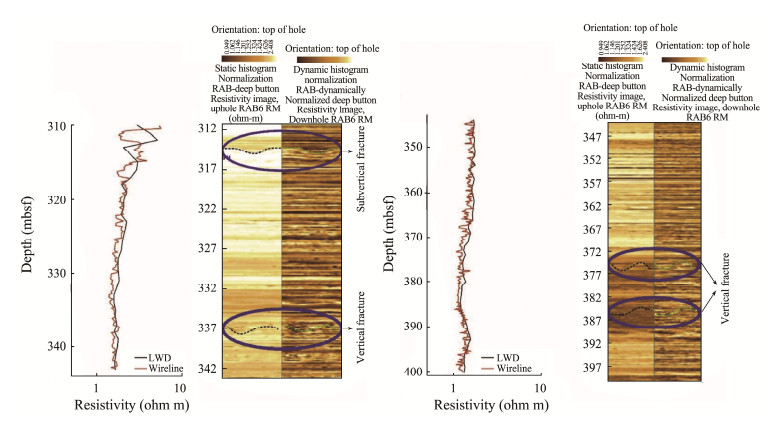
During the second expedition, logging data was acquired in the Krishna-Godavari (KG) Basin, revealing two levels of resistivity anomalies (Joshi et al., 2018; Waite et al., 2019). Fig.2 illustrates the resistivity-at-bit (RAB) image of NGHP-02-19, along with a resistivity log (Joshi et al., 2018). The sinusoidal features observed in the image represent vertical fractures. The core is characterized by a mixture of isotropic sediments and near-vertically fractured sediments. The average gas hydrate saturation between 306 and 312 m below seafloor (mbsf) is approximately 33.8%. The presence of high-quality gas hydrate reservoir accumulations on the northern slope of the South China Sea has been confirmed. The China Geological Survey initiated marine gas hydrate investigations in 1999 (Liang et al., 2016). Over the past 20 years, exploration expeditions have been conducted from west to east in the South China Sea, covering areas such as the Qiongdongnan Basin, Xisha Trough, Shenhu area, and Dongsha area (Liu et al., 2017; Zhang and Wright, 2017; Zhang et al., 2018). A comprehensive set of Logging-While-Drilling (LWD) data has been acquired.
|
Fig. 2 RAB image of NGHP-02-19 (Joshi et al., 2018). |
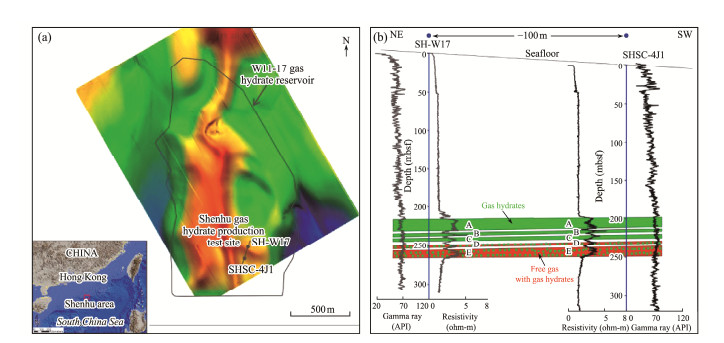
Taking the fine-grained W11-17 area in Shenhu as an example, reservoir properties were determined using well logs and laboratory measurements (Fig.3) (Kang et al., 2020). Gas hydrate saturation was estimated utilizing resistivity and Nuclear Magnetic Resonance (NMR) data. Units A to C were found to contain three intervals of hydrate, with a maximum thickness of 32 m and an average hydrate saturation of 32% ± 5%. Units D and E were inferred to be 20 m thick and identified as free gas layers containing gas hydrates. It is important to note that the coexistence of gas hydrates and free gas led to most of the saturation deviations.
|
Fig. 3 Study area of W11-17 gas hydrate reservoir and logging results of drilled wells SH-W17 and SHSC-4J1 (Kang et al., 2020). |
Based on the advancements in global gas hydrate investigations, it is evident that resistivity logging results around the world exhibit substantial variations. These differences can be attributed to various tectonic conditions, reservoir mineral compositions, gas hydrate stability conditions, and the specific forms of gas hydrate occurrence within sediments. While resistivity logging is a viable method for reservoir evaluation, there are significant challenges that restrict the correct interpretation of logging data.
In this paper, our work begins with simulating the vertical inhomogeneous output of a gas hydrate reservoir using a high-pressure vessel equipped with multilayer resistivity probes. We recorded resistivity data from different layers during gas hydrate formation and analyzed the parameters of Archie's equation based on these measurements. Subsequently, we employed a hydrate simulator that integrates X-ray computed tomography (X-CT) and resistivity detection to investigate the variation in pore space during gas hydrate growth. This analysis contributes to a better understanding of the electrical conductivity mechanism of gas hydrate-bearing sediments. Finally, we propose an Archie's equation correction method aimed at enhancing the accuracy of gas hydrate saturation prediction.
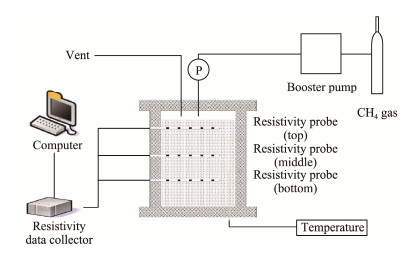
2 Sediment Resistivity Analysis for Vertically Uneven Gas Hydrate Occurrence 2.1 Experimental Apparatus and MaterialsTo investigate the non-uniform distribution of marine gas hydrates, this experiment utilized a high-pressure vessel capable of simulating vertical variations in hydrate distribution. The setup involved a high-pressure vessel, detection sensors, and a data acquisition module (Fig.4). The vessel had a length of 400 mm, and three resistivity sensors were arranged vertically at intervals of 110 mm. Resistivity measurements were conducted using the Wenner method, with a 20 kHz AC excitation voltage.
|
Fig. 4 Schematic diagram of hydrate resistivity experiment apparatus. |
The sediment used in the experiment consisted of natural sea sand with particle sizes ranging from 0.180 to 0.125 mm and a porosity of 40%. The pore water was artificially prepared using a 3.5% NaCl solution by mass, while the natural gas employed was 99.99% pure methane gas.
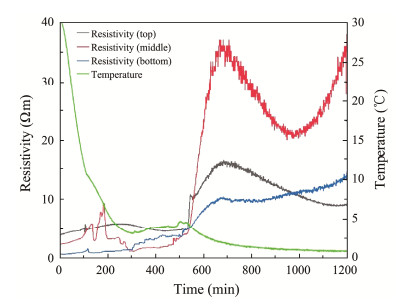
2.2 Gas Hydrate Formation Characteristics Indicated by Resistivity VariationThe sediment used in the experiment has an average pore water content of 75%, which increases gradually from the top to the bottom of the sample due to gravity. The ambient conditions selected for methane hydrate synthesis were a pressure of 9 MPa and a temperature of 1℃. Fig.5 displays the variations of temperature and resistivity over time for different layers during the synthesis process of methane hydrates.
|
Fig. 5 Resistivity variation of methane hydrates synthesized in brine-sediment system. |
The resistivity of the reservoir is highly influenced by temperature and pore water characteristics. During the 200-minute cooling stage, a slight increase in resistivity is observed, which is not directly associated with gas hydrate formation. However, the noticeable resistivity increase in the middle layer between 150 and 200 min is attributed to gas hydrate nucleation and aggregation. Furthermore, a significant surge in resistivity around 500 min indicates the onset of substantial gas hydrate formation. This stage is accompanied by high temperature anomalies resulting from the heat released during hydrate crystallization.
The significant increase in resistivity observed in the middle layer can be attributed to a combination of the vertically varying distributed pore water and gas supply. The upper sediment, with lower water content, contains ample empty spacing between particles, serving as gas transport channels towards the middle layers. As a result, the middle layer not only possesses more free pore water but also receives a greater gas supply. On the other hand, although the bottom region has an excess of pore water, the middle layer acts as a barrier to gas supply, resulting in lower hydrate generation in this region.
These findings suggest that gas transport channels and pore water content play a crucial role in governing hydrate formation. Resistivity measurements can provide qualitative insights into the different stages of gas hydrate formation. Next, we conducted an analysis to assess the applicability of Archie's equation in accurately calculating hydrate saturation using the experimental data.
In our experiment, gas consumption was estimated by monitoring pressure changes, and the average gas hydrate saturation was determined using Eq. (1) (Chen et al., 2016).
| $ {S_h} = \frac{{\left({\frac{{{P_1}}}{{{Z_1}T}}- \frac{{{P_2}}}{{{Z_2}T}}} \right) \times \frac{{{V_g}}}{R} \times {M_h}}}{{{\rho _h}{V_p}}}, $ | (1) |
where Sh is the hydrate saturation, Mh is the hydrate molar mass; ρh is the hydrate density, which is taken as 0.91 g mL−1; Vp is the pore volume of the porous medium, L; Vg is the gas phase volume in reactor, L; T is the system temperature, K; T1 is the initial pressure, MPa; T2 is the pressure during hydrate formation, MPa; R is the molar gas constant, 8.314 J (mol K)−1. Z is the gas compression factor.
The Archie's equation is an empirical relationship that describes the relationship between porosity, water content saturation, and resistivity in pure sandstone under ideal conditions (Ning et al., 2020). The critical parameters such as the cementation index and saturation index are typically determined through core analysis (Wang et al., 2017; Guan et al., 2019). Using these parameters, the gas hydrate saturation can be calculated using Eq. (2):
| $ {S_h} = 1 -{\left({\frac{{{R_0}}}{{{R_t}}}} \right)^{1/n}}, $ | (2) |
where Sh is the hydrate saturation; R0 is the resistivity of the water saturated sediment, Ω m; Rt is the measured resistivity of hydrate-bearing sediment, Ω m; n is the saturation index.
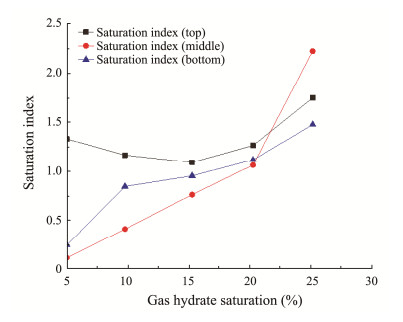
Fig.6 illustrates the variations in the saturation index of hydrate-bearing sediments observed in the experiments. The average gas hydrate saturation was determined based on the gas pressure drop measurements. While there are some discrepancies among different layers, the analysis of the saturation index still highlights certain limitations in the application of Archie's equation to hydrate-bearing cores. It is evident that not only do the equation parameters require optimization based on specific samples, but the prediction model itself also needs further refinement. Hence, our study proceeded to interpret the resistivity data in conjunction with the micro-distribution of gas hydrates.
|
Fig. 6 Saturation index variation with the hydrate formation. |
The advancement of X-ray computed tomography (X-CT) in recent years has enabled precise detection of the pore-scale gas hydrate formation and dissociation processes (Li et al., 2019). By combining X-CT with resistivity measurements, more detailed insights into the control mechanism of electrical resistance in gas hydrate-bearing sediments can be revealed. This integrated approach holds the potential to enhance our understanding of the complex behavior of gas hydrates and their interaction with sediment pore structures.
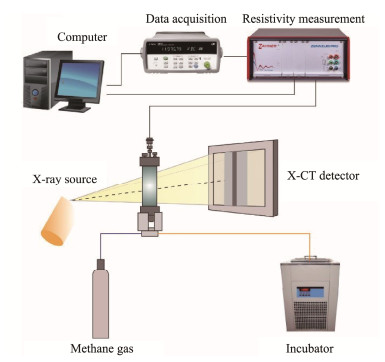
The experimental setup consists of four main units, as shown in Fig.7: a high-pressure vessel, an X-CT scanning device, a resistivity measurement unit, and a temperature-pressure control unit. The high-pressure vessel is constructed using PEEK material and has dimensions of 35 mm in diameter, 70 mm in height, and a 2 mm thick outer shell. The inner layer of the vessel has a diameter of 25 mm, a thickness of 0.5 mm, and a height of 45 mm. For high-resolution X-CT scanning, a Phoenix V |tome| x Industrial CT equipment from GE is utilized. The detector is a 16-bit digital flat panel with an effective area of 20 × 20 cm2. The maximum pixel resolution of the scanned images is 1024 × 1024.
|
Fig. 7 Schematic diagram of the whole experiment apparatus. |
The gas hydrate-bearing samples used in the synthesis process are composed of the same materials as described in Section 1. More detailed information about this apparatus can be found in a previously published paper by Chen et al. (2022a).
3.2 Pore-Scale Gas Hydrate Distribution IdentificationIn the X-CT scanning process, grayscale images of the gas hydrate-bearing sediment are obtained. Each component, such as free gas, solid gas hydrate, liquid pore water and solid sand, has a distinct gray value in the image. To analyze and distinguish these components, the image needs to undergo segmentation and processing techniques.
The solid gas hydrate particles serve as the sediment skeleton and affect the effective porosity of the sample. By reconstructing the original image data using software such as VG Studio MAX 3D and Avizo 3D, the effective porosity information can be extracted. This allows for the identification of the pore-scale distribution during gas hydrate growth.
Fig.8 illustrates the process of X-CT image processing, which includes segmentation and extraction of relevant information from the image data.

|
Fig. 8 Effective pore distribution extracting process. |
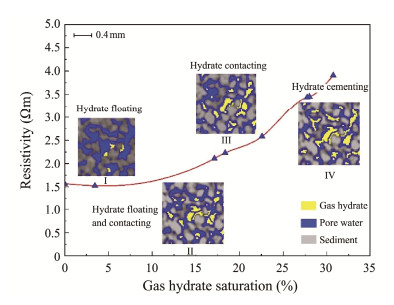
Fig.9 demonstrates the resistivity response and gas hydrate distribution during the gas hydrate formation process. As gas hydrate saturation increases from low to high, three main contact modes between gas hydrate and sediment particles are observed: floating, contacting, and cementing (Brugada et al., 2010).
|
Fig. 9 Resistivity and hydrate distribution during gas hydrate formation. |
The gas hydrate distribution images at the 4 saturations are projected onto the resistivity curves, which are 3.46%, 17.13%, 22.59% and 30.72% at moments Ⅰ, Ⅱ, Ⅲ and Ⅳ, respectively. By projecting the gas hydrate distribution images onto the resistivity curves at different saturations, the relationship between gas hydrate content and resistivity changes during the formation process is displayed. This information is valuable for understanding the influence of gas hydrate distribution on the electrical properties of the sediment.
At moment Ⅰ, with a gas hydrate saturation of 3.46%, the amount of gas hydrate is small, and the dominant contact mode is floating. At this stage, the resistivity change is insignificant. This can be attributed to the competing effects of pore space reduction (due to gas hydrate filling) and an increase in pore water ionic concentration, which offset each other and result in a negligible change in resistivity.
At moment Ⅱ, the gas hydrate saturation increases to 17.13%. Both the floating and contacting modes coexist, and gas hydrate filling becomes the main factor affecting resistivity. As the gas hydrate concentration increases, the resistivity also increases, indicating a higher degree of pore blockage and reduced pore water conductivity.
At moments Ⅲ and Ⅳ, the gas hydrate saturation continues to increase, reaching 22.59% and 30.72%, respectively. At these stages, gas hydrate gradually fills a significant portion of the pore space, resulting in a depletion of liquid pore water, which transforms into solid-phase gas hydrate. As a result, the resistivity exhibits a continuous increase as the gas hydrate content rises.
Based on the above results, it can be inferred that pore water is important to electric current conduction. The pore water information under different gas hydrate saturations was extracted using the Avizo software. In Fig.10, the black portions represent sediment particles, while the colored areas depict pores. Various colors are used mainly to distinguish different shapes and connectivity of the pores. Initially, the pore water exists as a single connected domain, as represented by the large green pore in Fig.10a. After the gas hydrate formation, the pore water domain is divided into five smaller disconnected pores, as shown in Fig.10b. This division occurs due to the presence of gas hydrate, which splits the pore space and narrows the channels through which pore water can flow. The formation of gas hydrate alters the connectivity of the porous network, leading to an increase in pore tortuosity. Tortuosity refers to the deviation or winding path that fluid (in this case, pore water) must take through a porous medium. The increased tortuosity indicates a more convoluted pathway for pore water flow due to the presence of gas hydrate, potentially impeding fluid transport and affecting electrical conductivity.

|
Fig. 10 Pore water variation during gas hydrate formation. |
These observations suggest that gas hydrate can significantly impact the pore structure and connectivity within the sediment, thereby influencing the movement of pore water and the electrical properties of the system. The changes in pore water distribution and tortuosity provide further evidence of the complex interplay between gas hydrate and sediment properties, highlighting the necessity to consider these factors in understanding electrical resistance variations in gas hydrate-bearing sediments.
Based on the topological relationships between pore water and other components in the X-CT images (as shown in Fig.11), quantitative information about pore water is calculated. This includes pore water quantity, maximum pore water volume and tortuosity. Tortuosity is defined as the ratio of the path length to the distance between the starting and ending points, describing the complexity of the path. When the gas hydrate saturation is less than 20%, the majority of gas hydrate is distributed in the middle portion of the pore space. At this stage, the number of water-bearing pores is relatively high, indicating that a significant portion of the pore space is still occupied by pore water. As the gas hydrate saturation increases to more than 30%, the gas hydrate gradually occupies a larger portion of the water-bearing pore space. Consequently, the number of water-bearing pores starts to decrease. The tortuosity of the water-bearing pores exhibits a linear increasing trend. Tortuosity represents the propotion of convoluted or winding pathway in the pore space, and its increase suggests a more complex and meandering flow path for pore water due to the presence of gas hydrates.

|
Fig. 11 Pore parameter variation of gas hydrate bearing sediments. |
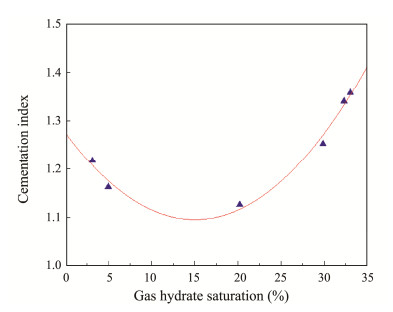
The most important goal of the joint X-CT and resistivity measurement is to optimize the gas hydrate saturation model. As shown in Archie's equation (Eq. (3)), m represents the cementation index and it is related to the pore structure (Paul et al., 2000). Fig.12 shows the variation of cementation index during gas hydrate formation process.
| $ {[{\phi _0}(1- {S_h})]^{-m}} = \frac{{{\rho _t}}}{{{\rho _w}}} . $ | (3) |
|
Fig. 12 Cementation index variation with the gas hydrate saturation. |
It can be seen that the cementation index tends to decrease and then increase with the increase of gas hydrate saturation. When the gas hydrate is in floating mode, the cementation index decreases with the increase in gas hydrate concentration; when the gas hydrate is in contacting mode, the cementation index shows opposite variation trend.
Therefore, it is necessary to consider the effect of gas hydrate distribution mode to optimize Archie's equation. We define the volume ratio of contacting gas hydrate as w1, the corresponding saturation as w1Sh, denoted as S1; the volume ratio of floating gas hydrate as w2, the corresponding saturation as w2Sh, denoted as S2. Therefore, the cementation index m and saturation index n in Archie's equation can be expressed as Eq. (4):
| $ m = \psi ({S_1}, {S_2}), {\kern 1pt} {\kern 1pt} {\kern 1pt} {\kern 1pt} n = f({S_1}, {S_2}). $ | (4) |
So, the Archie's equation could be written as Eq. (5):
| $ S_w^{f({S_1}, {S_2})} = a{\phi ^{\psi ({S_1}, {S_2})}}\frac{{{\rho _w}}}{{{\rho _t}}}, $ | (5) |
where Sw is the water saturation of sediment, ϕ is the porosity of sediment, ρw is the resistivity of pore water, ρt is the resistivity of gas hydrate bearing sediment.
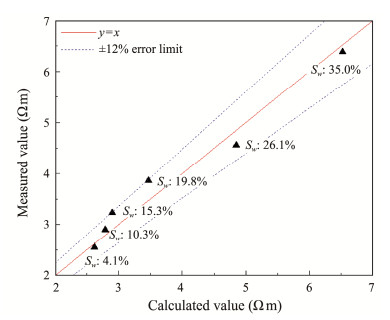
The expressions for the cementation index m and the saturation index n can be obtained by fitting the experimental data, and the resistivity and the saturation of gas hydrate bearing sediment at each moment can be acquired through resistivity measurement and X-CT image analysis, respectively. In the experiment, initially, CT images were analyzed to statistically assess the percentages of floating and contacting hydrates at different saturations. Subsequently, the corresponding proportions of these modes were used to substitute the cementation index (m) and saturation index (n) in Eqs. (4) and (5). A bivariate function fitting approach was employed to establish the relationships between the cementation index, saturation index, and the saturation of hydrates for floating and contacting modes. The calculated and measured resistivity were compared (Fig.13) and the relative error is less than 12% in the saturation range of 4.08% to 35.02%. The model performs well in calculating the hydrate saturation in sediments.
|
Fig. 13 Comparison between measured and calculated resistivity values. |
Resistivity logging is extensively utilized for locating marine gas hydrate reservoirs and estimating their resources. However, global surveys of gas hydrates have revealed a wide range of resistivity increases, varying from a few units to tens or hundreds of units. This variability can be attributed to the inherent inhomogeneity and diverse production types of gas hydrate reservoirs, which significantly influence resistivity. Therefore, it is crucial to further investigate the electrical response mechanism of hydrate-bearing sediments.
In this study, we conducted gas hydrate synthesis experiments to analyze resistivity variations at the core scale. Our findings confirmed that gas hydrate formation exhibits vertical heterogeneity due to the combined effects of gas transport, pore water supply, and other factors. The observed resistivity characteristics were linked to different gas hydrate formation stages in various regions. We applied the Archie's equation for data processing and gas hydrate saturation index values (n) varied in a range from 0 to 3. This suggests that the conventional Archie's equation may not be suitable for massive or fracture-filled gas hydrate reservoirs. Moreover, in the estimation of pore-filled gas hydrates, careful selection of the saturation index (n) is crucial for results.
Furthermore, we conducted gas hydrate simulation experiments using a combination of X-ray computed tomography (X-CT) and resistivity measurements. This allowed us to investigate the electrical resistivity response associated with the pore-scale distribution of gas hydrates. X-CT imaging confirmed the floating, contacting, and cementing micro-distribution patterns of gas hydrates as saturation increased. The resistivity curve exhibited distinct variations throughout the gas hydrate formation process, which can be divided into four distinct stages. Additionally, we found that the tortuosity of aqueous pores was a useful parameter for correcting the saturation index (n) in the Archie's equation. Based on our experimental data analysis, we proposed a correction method for the Archie's equation, and the results demonstrated improved performance in terms of relative errors.
Through our comprehensive studies, we have gained a deeper understanding of the conductive mechanism and key controlling factors of hydrate reservoirs. Additionally, we have optimized the saturation calculation method, which could provide a new basis for the interpretation of logging data. These findings contribute to advancing our knowledge of gas hydrate formations and enhance our ability to accurately evaluate and characterize gas hydrate reservoirs.
AcknowledgementsThis research was financially supported by the National Natural Science Foundation of China (No. 42376067), the Natural Science Foundation of Shandong Province (No. ZR202011030013), the Laoshan Laboratory (No. LSKJ20 2203506), and the China Geological Survey Program (No. DD20230064). Thanks are extended to my research team and all members of Key Laboratory of Gas Hydrate, Qingdao Institute of Marine Geology due to their helpful suggestions.
Author Contributions
All authors contributed to the study conception and design. Material preparation was performed by Jianye Sun. Data collection was performed by Chengfeng Li and Qingtao Bu. The draft of the manuscript was written by Qiang Chen. Data analysis was performed by Hongbin Wang and Changling Liu. The manuscript was reviewed and revised by Jiangong Wei and Beibei Kou, and all authors commented on previous versions of the manuscript. All authors read and approved the final manuscript.
Data Availability
The data and references presented in this study are available from the corresponding author upon reasonable request.
Declarations
Ethics Approval and Consent to Participate
This article does not contain any studies with human participants or animals performed by any of the authors.
Consent for Publication
Informed consent for publication was obtained from all participants.
Conflict of Interests
The authors declare that they have no conflict of interests.
Bahk, J., Kim, D., and Chun, J., 2013. Gas hydrate occurrences and their relation to host sediment properties: Results from Second Ulleung Basin Gas Hydrate Drilling Expedition, East Sea. Marine and Petroleum Geology, 47: 21-29. DOI:10.1016/j.marpetgeo.2013.05.006 (  0) 0) |
Birchwood, R., and Noeth, S., 2012. Horizontal stress contrast in the shallow marine sediments of the Gulf of Mexico sites Walker Ridge 313 and Atwater Valley 13 and 14 – Geological observations, effects on wellbore stability, and implications for drilling. Marine and Petroleum Geology, 34(1): 186-208. DOI:10.1016/j.marpetgeo.2012.01.008 (  0) 0) |
Boswell, R., Hancock, S., Yamamoto, K., Collett, T., Pratap, M., and Lee, S. R., 2020. Natural gas hydrates: Status of potential as an energy resource. In: Future Energy. Third Edition. Elsevier, Amsterdam, 111-131, https://doi.org/10.1016/B978-0-08-102886-5.00006-2.
(  0) 0) |
Brugada, J., Cheng, Y. P., Soga, K., and Santamarina, J. C., 2010. Discrete element modelling of geomechanical behaviour of methane hydrate soils with pore-filling hydrate distribution. Granular Matter, 12(5): 517-525. DOI:10.1007/s10035-010-0210-y (  0) 0) |
Chen, Q., Liu, C. L., Xin, L. C., Hu, G. W., Meng, Q. G., Sun, J. Y., et al., 2016. Resistivity variation during hydrate formation in vertical inhomogeneous distribution system of pore water. Acta Petrolei Sinica, 37(2): 222-229. (  0) 0) |
Chen, Q., Liu, C., Wu, N., Li, C., Chen, G., Sun, J., et al., 2022a. Experimental apparatus for resistivity measurement of gas hydrate-bearing sediment combined with X-ray computed tomography. Review of Scientific Instruments, 93(9): 094708. DOI:10.1063/5.0093861 (  0) 0) |
Chen, Q., Wu, N., Liu, C., Zou, C., Liu, Y., Sun, J., et al., 2022b. Research progress on global marine gas hydrate resistivity logging and electrical property experiments. Journal of Marine Science and Engineering, 10(5): 645. DOI:10.3390/jmse10050645 (  0) 0) |
Collett, T. S., Boswell, R., Waite, W., Kumar, P., Roy, S., Chopra, K., et al., 2019. India National Gas Hydrate Program Expedition 02 summary of scientific results: Gas hydrate systems along the eastern continental margin of India. Marine and Petroleum Geology, 108: 39-142. DOI:10.1016/j.marpetgeo.2019.05.023 (  0) 0) |
Collett, T. S., Johnson, A. H., Knapp, C. C., and Boswell, R., 2009. Natural gas hydrates – A review. Browse Collections, 89: 146-219. (  0) 0) |
Collett, T. S., Lee, M. W., Zyrianova, M. V., Mrozewski, S. A., Guerin, G., Cook, A. E., et al., 2012. Gulf of Mexico Gas Hydrate Joint Industry Project Leg Ⅱ logging-while-drilling data acquisition and analysis. Marine and Petroleum Geology, 34(1): 41-61. DOI:10.1016/j.marpetgeo.2011.08.003 (  0) 0) |
Collett, T., Bahk, J. J., Baker, R., Boswell, R., Divins, D., Frye, M., et al., 2015. Methane hydrates in nature – Current knowledge and challenges. Journal of Chemical & Engineering Data, 60: 319-329. DOI:10.1021/je500604h (  0) 0) |
Daigle, H., Cook, A., and Malinverno, A., 2018. Formation of massive hydrate deposits in Gulf of Mexico sand layers. Fire in the Ice, 18(1): 1-16. (  0) 0) |
Glover, P. W. J., Hole, M. J., and Pous, J., 2000. A modified Archie's law for two conducting phases. Earth and Planetary Science Letters, 180(3-4): 369-383. DOI:10.1016/S0012-821X(00)00168-0 (  0) 0) |
Guan, J. A., Fan, S. S., Liang, D. Q., Wan, L. H., and Li, D. L., 2019. An overview on gas hydrate exploration and exploitation in natural fields. Advances in New and Renewable Energy, 7(6): 522-531 (in Chinese with English abstract). (  0) 0) |
Horozal, S., Kim, G. Y., Bahk, J. J., Wilkens, R. H., Yoo, D. G., Ryu, B. J., et al., 2015. Core and sediment physical property correlation of the second Ulleung Basin Gas Hydrate Drilling Expedition (UBGH2) results in the East Sea (Japan Sea). Marine and Petroleum Geology, 59: 535-562. DOI:10.1016/j.marpetgeo.2014.09.019 (  0) 0) |
Joshi, A. K., Sain, K., and Pandey, L., 2019. Gas hydrate saturation and reservoir characterization at sites NGHP-02-17 and NGHP-02-19, Krishna Godavari Basin, eastern margin of India. Marine and Petroleum Geology, 108: 595-608. DOI:10.1016/j.marpetgeo.2018.06.023 (  0) 0) |
Kang, D. H., Yoo, D. G., Bahk, J. J., Ryu, B. J., Koo, N. H., Kim, W. S., et al., 2009. The occurrence patterns of gas hydrate in the Ulleung Basin, East Sea. Journal of the Geological Society of Korea, 45: 143-155. (  0) 0) |
Kang, D. J., Lu, J. A., Zhang, Z., Liang, J., Kuang, Z., Lu, C., et al., 2020. Fine-grained gas hydrate reservoir properties estimated from well logs and lab measurements at the Shenhu gas hydrate production test site, the northern slope of the South China Sea. Marine and Petroleum Geology, 122: 104676. DOI:10.1016/j.marpetgeo.2020.104676 (  0) 0) |
Koh, C. A., Sloan, E. D., Sum, A. K., and Wu, D. T., 2011. Fundamentals and applications of gas hydrates. Annual Review of Chemical Biomolecular Engineering, 2: 237-257. DOI:10.1146/annurev-chembioeng-061010-114152 (  0) 0) |
Lee, C., Yun, T. S., Lee, J. S., Bahk, J. J., and Santamarina, J. C., 2011. Geotechnical characterization of marine sediments in the Ulleung Basin, East Sea. Engineering Geology, 117(1-2): 151-158. DOI:10.1016/j.enggeo.2010.10.014 (  0) 0) |
Lee, M., and Collett, T., 2009. Gas hydrate saturations estimated from fractured reservoir at site NGHP‐01‐10, Krishna‐Godavari Basin, India. Journal of Geophysical Research: Solid Earth, 114 (B7): B07102, DOI: 2008JB006237.
(  0) 0) |
Li, C., Liu, C., Hu, G., Sun, J., Hao, X., Liu, L., et al., 2019. Investigation on the multi-parameter of hydrate-bearing sands using nano-focus X-ray computed tomography. Journal of Geophysical Research: Solid Earth, 124(3): 2286-2296. DOI:10.1029/2018JB015849 (  0) 0) |
Liang, J. Q., Zhang, G. X., Lu, J. A., Su, P. B., Sha, Z. B., Gong, Y. H., et al., 2016. Accumulation characteristics and genetic models of natural gas hydrate reservoirs in the NE slope of the South China Sea. Natural Gas Industry, 36(10): 157-162 (in Chinese with English abstract). (  0) 0) |
Liu, J., Zhang, J. Z., Sun, Y. B., and Zhao, T. H., 2017. Gas hydrate reservoir parameter evaluation using logging data in the Shenhu area, South China Sea. Natural Gas Geoscience, 28(1): 164-172 (in Chinese with English abstract). (  0) 0) |
Majumdar, U., Cook, A. E., Scharenberg, M., Burchwell, A., Ismail, S., Frye, M., et al., 2017. Semi-quantitative gas hydrate assessment from petroleum industry well logs in the northern Gulf of Mexico. Marine and Petroleum Geology, 85: 233-241. DOI:10.1016/j.marpetgeo.2017.05.009 (  0) 0) |
Ning, F. L., Liang, J. Q., Wu, N. Y., Zhu, Y. H., Wu, S. G., Liu, C. L., et al., 2020. Reservoir characteristics of natural gas hydrates in China. Natural Gas Industry, 40(8): 1-25 (in Chinese with English abstract). DOI:10.3787/j.issn.1000-0976.2020.08.001 (  0) 0) |
Qian, J., Wang, X., Collett, T. S., Guo, Y., Kang, D., and Jin, J., 2018. Downhole log evidence for the coexistence of structure Ⅱ gas hydrate and free gas below the bottom simulating reflector in the South China Sea. Marine and Petroleum Geology, 98: 662-674. DOI:10.1016/j.marpetgeo.2018.09.024 (  0) 0) |
Riedel, M., Collett, T. S., and Shankar, U., 2011. Documenting channel features associated with gas hydrates in the Krishna-Godavari Basin, offshore India. Marine Geology, 279(1-4): 1-11. DOI:10.1016/j.margeo.2010.10.008 (  0) 0) |
Riedel, M., Collett, T., Kumar, P., Sathe, A., and Cook, A., 2010. Seismic imaging of a fractured gas hydrate system in the Krishna-Godavari Basin offshore India. Marine and Petroleum Geology, 27(7): 1476-1493. (  0) 0) |
Ryu, B. J., Collett, T. S., Riedel, M., Kim, G. Y., Chun, J. H., Bahk, J. J., et al., 2013. Scientific results of the Second Gas Hydrate Drilling Expedition in the Ulleung Basin (UBGH2). Marine and Petroleum Geology, 47: 1-20. DOI:10.1016/j.marpetgeo.2013.07.007 (  0) 0) |
Waite, W. F., Jang, J., Collett, T. S., and Kumar, P., 2018. Downhole physical property-based description of a gas hydrate petroleum system in NGHP-02 area C: A channel, levee, fan complex in the Krishna-Godavari Basin offshore eastern India. Marine and Petroleum Geology, 108: 272-295. DOI:10.1016/j.marpetgeo.2018.05.021 (  0) 0) |
Wang, L. F., Fu, S. Y., Liang, J. Q., Shang, H. J., and Wang, J. L., 2017. A review on gas hydrate developments propped by worldwide national projects. China Geology, 44(3): 439-448 (in Chinese with English abstract). DOI:10.12029/gc20170303 (  0) 0) |
Wang, X. J., Wu, S. G., Liu, X. W., Guo, Y. Q., Lu, J. A., Yang, S. X., et al., 2010. Estimation of gas hydrate saturation based on resistivity logging and analysis of estimation error. Geoscience, 24(5): 993-999 (in Chinese with English abstract). (  0) 0) |
Zhang, W., Liang, J. Q., He, J. X., Cong, X. R., Su, P. B., Lin, L., et al., 2018. Differences in natural gas hydrate migration and accumulation between GMGS1 and GMGS3 drilling areas in the Shenhu area, northern South China Sea. Natural Gas Science, 38(3): 138-149 (in Chinese with English abstract). DOI:10.3787/j.issn.1000-0976.2018.03.017 (  0) 0) |
Zhang, Z., and Wright, C. S., 2017. Quantitative interpretations and assessments of a fractured gas hydrate reservoir using three-dimensional seismic and LWD data in Kutei Basin, East Kalimantan, offshore Indonesia. Marine and Petroleum Geology, 84: 257-273. (  0) 0) |
 2025, Vol. 24


