2) East China Sea Environment Monitoring, Ministry of Natural Resources, Shanghai 201206, China;
3) China Waterborne Transport Research Institute, Ministry of Transport, Beijing 100088, China
As proven in a previous study (Pun et al., 2013), tropical cyclones frequently occur in the Northwest Pacific Ocean (NPO). Typhoons affect the momentum and energy exchange in the air-sea boundary layer (Emanuel, 1985; Rastigejev and Suslov, 2019) and result in marine hazards, i.e., extreme waves (Jun et al., 2015) and rainstorms (Xie and Zhang, 2011). The Kuroshio Current is an important western boundary current in the NPO, which contains high-temperature and high-salinity seawater and affects the meteorological and hydrological processes in coastal ocean areas (Caruso et al., 2006). During typhoon events, the sea state is complicated due to strong winds, complex air-sea interaction, and turbulent mixing (Jiang et al., 2008). Sea surface temperature (SST) cooling is observed in typhoons using remote-sensing technology and numerical modeling. Based on the literature, SST cooling is affected by the wave-current interaction in the background of the Kuroshio Current and the strong wind-induced current. In this sense, the characteristics of SST cooling should be further studied as typhoons pass the Kuroshio Current.
Over the past few decades, the performance of ocean waves under typhoon conditions has been widely investigated using multiple technologies, including moored buoys from the National Data Buoy Center (NDBC) of the National Oceanic and Atmospheric Administration (Doong et al., 2015), numerical model simulations (Hu et al., 2020), and remote-sensing satellites (Li, 2015; Wang and Cheng, 2015). Although open-access NDBC buoy data is a valuable source in regional seas, the measurements from microwave satellites are popular for wave monitoring over global oceans, e.g., Jason and HY-2 altimeter (Abdalla et al., 2010; Chen et al., 2017), synthetic aperture radar (Shao et al., 2022), and the Chinese-French Oceanic Satellite (Liang et al., 2021). However, the above wave measurements cannot be easily used for analyzing the sea state under typhoon conditions, which requires a wide spatial coverage with a fine time resolution. Numerical ocean models have been well developed and are useful for studying extreme sea states (Yuan et al., 1991), including waves, currents, and water temperatures. Currently, two third-generation numerical models, namely, the WAVEWATCH-Ⅲ (WW3) model (version 6.07) (WAVEWATCH-Ⅲ Development Group, 2019) developed by the National Centers for Environmental Prediction (NCEP) (Tolman, 1991; Zhou et al., 2014) and the Simulating Waves Nearshore (SWAN) model developed by the Delft University of Technology (Holthuijsen, 2001; Rogers et al., 2010), are widely used for wave simulations. These models are based on the principle of the energy density balance in terms of wave propagation in the ocean wave model (WAM) (Bender, 2009). The WW3 model has a good performance in modeling typhoon waves using structured grids in regional seas, e.g., the North China Sea (Zhang et al., 2018) and the Beibu Bay (Shao et al., 2018). Similarly, the SWAN model could be applied to modeling typhoon waves (Yang et al., 2020) in shallow waters around Zhoushan Islands (Sheng et al., 2019; Yang et al., 2020) due to the unstructured triangular grid.
Numerical circulation models are popularly used for research on global climate change, especially for circulation variation and SST anomalies, e.g., Harvard Ocean Prediction System (Robinson and Walstad, 1987), Geophysical Fluid Dynamics Laboratory's modular ocean model (Zhang et al., 1998), Parallel Ocean Program (Jones et al., 2010), Princeton Ocean Model (POM) (Robertson et al., 2001; Kamenkovich and Nechaev, 2009), estuarine coastal and ocean model (Chen et al., 2007), Regional Ocean Modeling System (Shchepetkin and McWilliams, 2005), and Hybrid Coordinate Ocean Model (HYCOM) (Bleck, 2002; Chassignet et al., 2003). In particular, the circulation models are also useful for investigating the variations of water temperatures responding to the changes in the atmospheric boundary layer in tropical cyclones (Lee and Chen, 2014). However, the relationship between the sea state and typhoon-induced SST cooling necessitates the analysis considering wave-induced effects, e.g., breaking waves, nonbreaking waves, radiation stress, and Stokes drift. The newly released version of the POM, i.e., sbPOM (Jordi and Wang, 2012), is an ocean circulation model with a high computational efficiency based on a parallel computing method.
Generally, a mixed layer is deepened under typhoon conditions (Shay et al., 1992; Tsai et al., 2008), which is caused by air-sea mixing, turbulence, and the Ekman pumping. In particular, the upwelling of cold water caused by a strong wind stress curl results in the reduction of the water temperature during a typhoon event. As a matter of fact, SST cooling in typhoons is observed using real-time techniques, such as Advanced Research and Global Observation Satellite (ARGOS) data (Oke and Schiller, 2007). Typhoon-induced SST cooling in the open ocean has been well studied (Sakaida et al., 1998; Ma et al., 2013) using satellite observations and numerical modeling. The study on atmosphere-ocean interactions in typhoons also revealed that the surface wind speed is weakened by cold SST patches (Lin et al., 2003), where the SST is 6℃ lower than the SST of the surrounding warm tropical ocean. Occasionally, the typhoon path passes the Kuroshio Current. The dynamic and thermal responses of the Kuroshio Current to typhoon-induced SST cooling have been studied through modeling and measurement data (Wei et al., 2014). A case study of Typhoon Nari focused on the variations in the water temperature and concluded that SST cooling is influenced by strong atmosphere-ocean interactions (Wu et al., 2008). Furthermore, the typhoon-induced reduction of the SST influenced by the movement of the Kuroshio Current reached 13℃ (Morimato et al., 2009) at the northeast shelf of Taiwan. Based on glider data, ocean subsurface layer warming and freshening are changed in the Kuroshio region (Hsu and Ho, 2019). However, the typhoon wave is affected by the Kuroshio Current through strong wave-current interactions, which plays an important role in SST cooling. In our previous study, the combination of the WW3 model and sbPOM produced a good performance for analyzing typhoon-induced SST cooling in binary typhoons (Sun et al., 2021). In this study, the waves when a typhoon passed the Kuroshio Current were simulated using the WW3 model considering wave-current interactions, and the four effects of strong waves, i.e., breaking waves, nonbreaking waves, radiation stress, and Stokes drift, were calculated. Subsequently, the water temperature was simulated by the sbPOM, including the four wave-induced terms. In particular, the profile of the water temperature in the vertical direction considering the wave-induced terms was analyzed.
The remainder of this work is organized as follows: The dataset and settings of the two ocean models and the validation of model-simulated results are described in Section 2. The variation of the SST in the Kuroshio Current and the relationship between the SST and sea state (sea surface current and wave) are shown in Section 3. The variations in the water temperature in the vertical direction and mixing layer depth (MLD) are discussed in Section 4. The conclusions are summarized in Section 5.
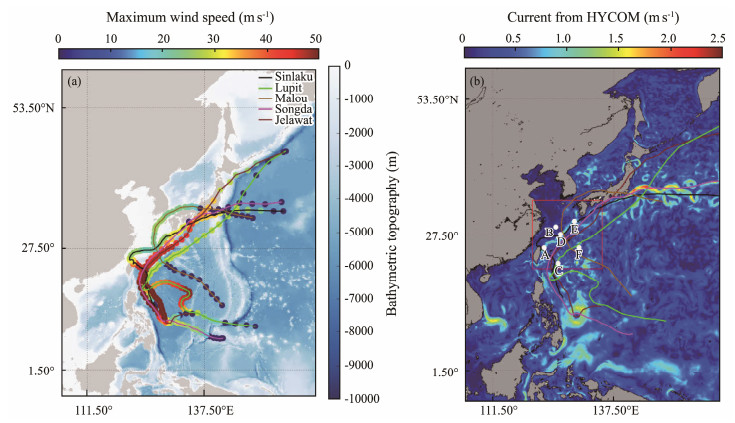
2 Materials and Methods 2.1 Data CollectionIn this study, five typhoons, i.e., Typhoons Sinlaku (2008), Lupit (2009), Malou (2010), Songda (2011), and Jelawat (2012) that passed the Kuroshio Current, were selected. Detailed information about these typhoons is listed in Table 1. The typhoon track data were obtained from the Regional Specialized Meteorological, Tokyo-Typhoon Center of the Japan Meteorological Agency. The typhoon tracks and maximum wind speeds of the typhoons associated with the bathymetric topography obtained from the General Bathymetry Chart of the Oceans (GEBCO) for the study area are shown in Fig. 1a. All of the typhoons lasted for more than eight days, and the maximum wind speeds occurred in the Kuroshio Current area (Fig. 1a). Then, HYCOM sea surface current data with a 24-h interval and a spatial resolution of 0.08˚ were collected. Fig. 1b shows the HYCOM sea surface current field at 20:00 UTC on September 24, 2012, and the typhoon tracks. The area outlined by the red rectangle is the region in which the typhoon and the Kuroshio Current interacted, and six points (A − F) used for quantitatively analyzing the water temperature are also shown in Fig. 1b. In particular, the tracks of the studied typhoons clearly passed or were consistent with the flow of the Kuroshio Current.
|
|
Table 1 Detailed information about typhoons |
|
Fig. 1 (a) Bathymetric topography used in the simulations; (b) hybrid coordinate ocean model (HYCOM) sea surface current at 20:00 UTC on September 24, 2012. The colored lines represent the tracks of the typhoons collected in this study. |
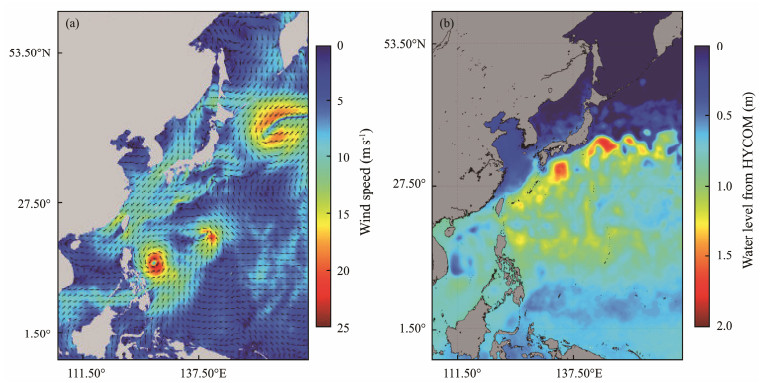
The European Center for Medium-Range Weather Forecasts reanalysis (ERA-5) wind data with a 24-h interval and a spatial resolution of 0.25˚ are valuable sources, which were used for studying the variability of wave climate using a numerical WAM. A previous study (Shao et al., 2021) reconstructed the typhoon's composited wind field, which was derived from ERA-5 and a parametric Holland model (Holland, 1980), hereafter called the H-E wind. The model-simulated wind speeds had a good performance compared to those measured by moored buoys. An example of the H-E winds is shown in Fig. 2a for Typhoon Jelawat at 00:00 UTC on September 26, 2012, with a shape parameter equivalent to 0.2 in the Holland model. The HYCOM water level map at 20:00 UTC on September 24, 2012, is presented in Fig. 2b, in which the maximum water level is 2 m. The current and water level were also used in the wave simulation.
|
Fig. 2 (a) Wind field for Typhoon Jelawat at 00:00 UTC on September 26, 2012. The wind field was derived from the European Centre for Medium-Range Weather Forecasts (ECMWF) wind data and a parametric Holland model (H-E); (b) HYCOM sea surface current at 20:00 UTC on September 24, 2012. |
Following the principle of the WAM, the methodology of wave simulations in the WW3 model is to solve the wave propagation balance equation, stated as follows:
| $ \frac{{N(k, \theta, x, t)}}{\sigma } = {S_{in}} + {S_{nl}} + {S_{ds}} + {S_{bot}} + {S_{db}}, $ | (1) |
where N is the variation in the wave energy as a function of the wave number k, wave propagation direction θ, space x, and time t; σ is the intrinsic frequency; Sin is the input of the wind-induced energy at the air-sea boundary layer; Sbot is the friction caused by the wave-bottom interaction; Sdb is the energy dissipation induced by wave breaking; and Snl is the nonlinear energy exchange due to multiple (triad and four) wave-wave interactions. The details of the description of the parameterizations of these terms are provided in the user manual of the WW3 model (WAVEWATCH-Ⅲ Development Group, 2019); thus, it is not repeated here. The settings are briefly introduced as follows: A switch called the TC96 established by Tolman and Chalikov for the input/dissipation terms was selected. For the four wave-wave interactions, the Generalized Multiple DIA package was employed. The H-E wind field with a 0.25˚ grid and a 1-h interval, the HYCOM currents and water level with a 0.08˚ grid and a 3-h interval, and the boundary condition of the water depth from the GEBCO were used as the forcing field. The temporal resolution of the WW3-simulated wave spectrum was 30 min, and the spatial grid resolution was settled as 0.1˚.
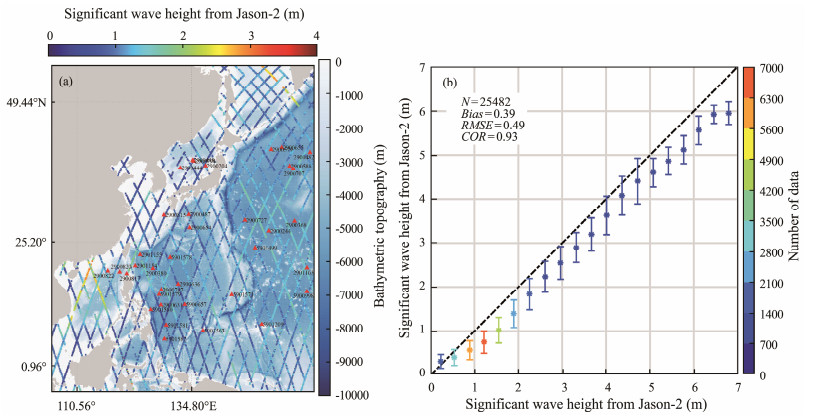
To validate the accuracy of the WW3 simulation results, the measurements from the Jason-2 altimeter data were collected in the region between (5˚N, 105˚E) and (60˚N, 163˚E) during the typhoon periods. As an example, the measurements following the footprints of the Jason-2 altimeter on September 20 – 30, 2012, are shown in Fig. 3a, in which the color representing the significant wave height (SWH) data and the red triangles represent the geographic locations of the available ARGOS on September 25, 2012. In total, more than 25000 matchups during Typhoons Songda (on May 18 – 30, 2011) and Jelawat (September 20 – 30, 2012) were used to validate the SWH simulations, yielding a root mean square error (RMSE) of 0.49 m and correlation coefficient (COR) of 0.93, as exhibited in Fig. 3b. These results indicate that the WW3-simulated wave fields are reliable for this study, although the WW3-simulated waves had underestimation compared with the measurements from the Jason-2 altimeter.
|
Fig. 3 (a) Significant wave height (SWH) data measured by the Jason-2 altimeter overlain with the bathymetric topography. The red triangles represent the geographic locations of the Argo with the ARGOS ID; (b) comparisons of the SWHs simulated using WAVEWATCH-Ⅲ (WW3) and the measurements from the Jason-2 altimeter in 0.35 m bins from 0 to 7 m on May 18 – 30, 2011 and September 20 – 30, 2012. |
The four wave-induced terms, namely, breaking waves, nonbreaking waves, radiation stress, and Stokes drift, were included in the water temperature simulation by the sb-POM during typhoon events (Sun et al., 2021). These wave-induced terms were conveniently calculated using the theoretical parametrizations and wave parameters from the WW3 model. In practice, the breaking waves have an energy dissipation rate Rds that obeys the following function (Guan et al., 2007):
| $ {R_{ds}} = \frac{{2.97\gamma {\rho _\omega }g{\beta ^{ - 2}}}}{{{\omega _p}S}}, $ | (2) |
where
| $ S = \frac{1}{{16}}H_s^2, {\omega _p}{\text{ = }}\frac{{0.91 \times 2{{\rm{ \mathsf{ π} }}}}}{{{T_0}}}, $ | (3) |
where ρw is the density of seawater (1.07 g cm−1); g is the acceleration due to gravity (9.8 m s−2); γ is a constant (0.1), representing the ratio of the dissipated energy to the total wave energy dissipation per unit of white crown; β is the wave age accounting for the ratio between the SWH Hs and wavelength λp at a peak in a two-dimensional wave spectrum S; ωp is the angular frequency at the peak in the wave spectrum; and T0 is the cross-zero mean wave period.
The vertical diffusion coefficient Kh and vertical eddy viscosity coefficient Km influenced by the nonbreaking waves, which are essential in the sbPOM, have the following formulation (Hu and Wang, 2010):
| $ {K_m} = \frac{{2a{k^2}\lambda }}{{{{\rm{ \mathsf{ π} }}}{T_0}}}{{\text{e}}^{\frac{{2{{\rm{ \mathsf{ π} }}}z}}{\lambda }}}, $ | (4a) |
| $ {K_h} = \frac{{2P{k^2}}}{g}\delta {\beta ^3}U_{10}^3{{\text{e}}^{\frac{{gz}}{{{\beta ^2}U_{10}^2}}}}, $ | (4b) |
where k is the Kaman constant (0.4); g is the acceleration; a is twice the value of the SWH Hs; T0 is the cross-zero mean wave period; λ is the wavelength; z is the water depth (negative from the sea surface); β is the wave age (Hs/λp); P is the Richardson number coefficient (0.1); δ is the wave steepness (cp/U10); cp is the wave velocity at a peak in a two-dimensional wave spectrum; and U10 is the wind speed at the height of 10 m above the sea surface.
The four components, i.e., Sxx, Syy, Sxy, and Syx, which are influenced by the wave-induced radiation stress, were calculated using the following equations (Wu et al., 2011):
| $ {S_{xx}} = kE\left({\frac{{{k_x}{k_x}}}{{k_x^2 + k_y^2}}{F_{CS}}{F_{CC}} - {F_{SC}}{F_{SS}}} \right) + {E_d}, $ | (5a) |
| $ {S_{yy}} = kE\left({\frac{{{k_y}{k_y}}}{{k_x^2 + k_y^2}}{F_{CS}}{F_{CC}} - {F_{SC}}{F_{SS}}} \right) + {E_d}, $ | (5b) |
| $ {S_{xy}} = {S_{yx}}{\text{ = }}\sqrt {k_x^2 + k_y^2} E\frac{{{k_x}{k_y}}}{{{k^2}}}{F_{CS}}{F_{CC}}, $ | (5c) |
where
| $ {F_{SC}} = \frac{{\sinh k(z + h)}}{{\cosh kD}}, {F_{CC}} = \frac{{\cosh k(z + h)}}{{\cosh kD}}, $ | (6a) |
| $ {F_{SS}} = \frac{{\sinh k(z + h)}}{{\sinh kD}}, {F_{CC}} = \frac{{\cosh k(z + h)}}{{\sinh kD}}, $ | (6b) |
| $ E = \frac{1}{{16}}{\rho _\omega }gH_s^2, $ | (6c) |
| $ \int_{ - h}^\eta {{E_d}{d_z} = \frac{E}{2}}, $ | (7) |
where ρw = 1.07 g cm−1; Hs is the SWH; g = 9.8 m s−2; kx and ky are the components of the wave number k in the horizontal directions x and y, respectively; D is the sum of the water depth h and sea surface elevation η in the vertical direction z; and Ed is a modified Dirac delta function.
The Stokes drift causes the sea surface water transport to be included in the sbPOM, and the Stokes drift rate on the sea surface Us can be expressed as follows (Mesquita et al., 1992):
| $ {U_s} = {U_{ss}}{{\text{e}}^{\frac{{8{{{\rm{ \mathsf{ π} }}}^2}h}}{{g{T^2}}}}}\vec k, $ | (8a) |
| $ {U_{ss}} = \frac{{2{{{\rm{ \mathsf{ π} }}}^3}H_s^2}}{{gT_0^3}}, $ | (8b) |
where k is the wave number vector; Hs is the SWH; T0 is the cross-zero mean wave period; g = 9.8 m s−2; and h is the water depth (negative value in the vertical direction). As an example, the SWH (Fig. 4a), peak wavelength (Fig. 4b), mean wave period (Fig. 4c), and friction velocity (Fig. 4d) simulated by the WW3 model at 20:00 UTC on September 24, 2012, are shown in Fig. 4, which were used as the wave parameters for calculating the wind-induced terms.

|
Fig. 4 Simulation results obtained using the WW3 model at 20:00 UTC on September 24, 2012. (a), significant wave height; (b), peak wavelength; (c), mean wave period; and (d), friction velocity. |
The sbPOM follows the unique principles of the POM, which is a well-known ocean circulation model for water temperature and salinity simulations. Specifically, the improvement of the sbPOM is the utilization of a parallel computing environment to enhance computational efficiency. In addition, the sbPOM uses the σ coordinate system in the vertical direction instead of z-coordinates ranging from −1 to 0. The solution of the sbPOM follows the equation:
| $ \frac{{\partial uD}}{{\partial t}} + \frac{{\partial {u^2}D}}{{\partial x}} + \frac{{\partial uvD}}{{\partial y}} + \frac{{\partial u\omega }}{{\partial \sigma }} - fvD + gD\frac{{\partial \eta }}{{\partial x}} + $ |
| $ \frac{{g{D^2}}}{{{\rho _0}}}\int_\sigma ^0 {\left[ {\frac{{\partial \rho }}{{\partial x}} - \frac{\sigma }{D}\frac{{\partial D}}{{\partial x}}\frac{{\partial \rho }}{{\partial \sigma }}} \right]} {\text{d}}\sigma = \frac{\partial }{{\partial \sigma }}\left[ {\frac{{{K_M}}}{D}\frac{{\partial u}}{{\partial \sigma }}} \right] + {F_x}, $ | (9) |
| $ \frac{{\partial vD}}{{\partial t}} + \frac{{\partial uvD}}{{\partial x}} + \frac{{\partial {v^2}D}}{{\partial y}} + \frac{{\partial v\omega }}{{\partial \sigma }} + fuD + gD\frac{{\partial \eta }}{{\partial y}} + $ |
| $ \frac{{g{D^2}}}{{{\rho _0}}}\int_\sigma ^0 {\left[ {\frac{{\partial \rho }}{{\partial y}} - \frac{\sigma }{D}\frac{{\partial D}}{{\partial y}}\frac{{\partial \rho }}{{\partial \sigma }}} \right]} {\text{d}}\sigma = \frac{\partial }{{\partial \sigma }}\left[ {\frac{{{K_M}}}{D}\frac{{\partial v}}{{\partial \sigma }}} \right] + {F_y}, $ | (10) |
where
| $ D = H(x, y) + \eta (x, y, t), $ | (11) |
| $ \sigma = \frac{{z - \eta (x, y, t)}}{{H(x, y) + \eta (x, y, t)}}, $ | (12) |
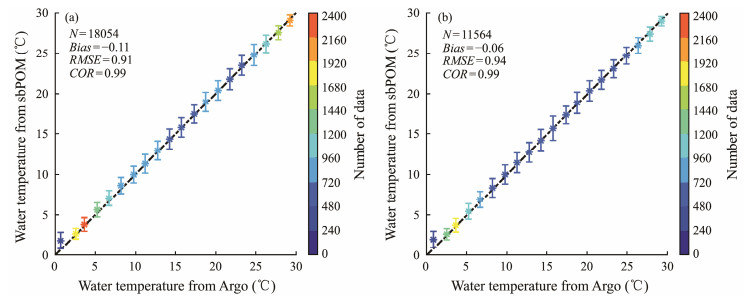
where H(x, y) is the water depth in the horizontal x and y dimensions; η(x, y, t) is the sea level in the x, y, and time t dimensions; u, v, and ω are the particle velocities in the horizontal directions (x and y) and vertical direction z; ρ is the mean fluctuation value; g is the gravity acceleration; KM is the vertical viscosity coefficient; and Fx and Fy are the horizontal viscosity terms. The default parametrizations of the above terms in the sbPOM were directly employed. The ocean depth data were obtained from the GEBCO dataset, and the H-E wind field was also used as the forcing field. The NCEP reanalysis total heat flux dataset (latent heat flux, sensible heat flux, long-wave radiation, and solar radiation) was used as the upper boundary forcing field of the model, with a time resolution of 6 h and spatial resolution of 1.875˚ × 1.905˚ (longitude × latitude). The SST and salinity from the simple ocean data assimilation (SODA), with a spatial resolution of 0.5˚, were used as the initial field. The four wave-induced terms were calculated using the WW3 simulation results. Figs. 5a and 5b show the monthly average SST and sea surface salinity maps from the SODA in September 2012. Similarly, the NCEP reanalysis total heat flux map at 18:00 UTC on September 24, 2012, is shown in Fig. 5c. For validating the simulation results, the sbPOM-simulated SSTs and the measurements from ARGOS were compared. As observed from Fig. 6a, the RMSE of the water temperature was less than 0.92℃, and the COR was 0.99 on September 1 – 25, 2008, October 11 – 31, 2009, and September 1 – 20, 2010. In addition, the RMSE was less than 0.94℃ with a 0.99 COR on May 15 – 31, 2011 and September 15 – 30, 2012 (Fig. 6b). Collectively, the sbPOM-simulated water temperatures were determined to be reliable for this study.

|
Fig. 5 (a) Monthly average sea surface salinity from the simple ocean data assimilation (SODA) data on September 2012; (b) monthly average sea surface temperature (SST) from the SODA data on September 2012; (c) National Centers for Environmental Prediction (NCEP) reanalysis total heat flux (latent heat flux, sensible heat flux, long-wave radiation, and solar radiation) map at 18:00 UTC on September 24, 2012. |
|
Fig. 6 Comparisons of the measurements from Argos with SSTs simulated by the sbPOM for 1.5℃ bins from 0℃ to 30℃ on (a) September 1 – 25, 2008, October 11 – 31, 2009, and September 1 – 20, 2010; and (b) May 15 – 31, 2011 and September 15 – 30, 2012. |
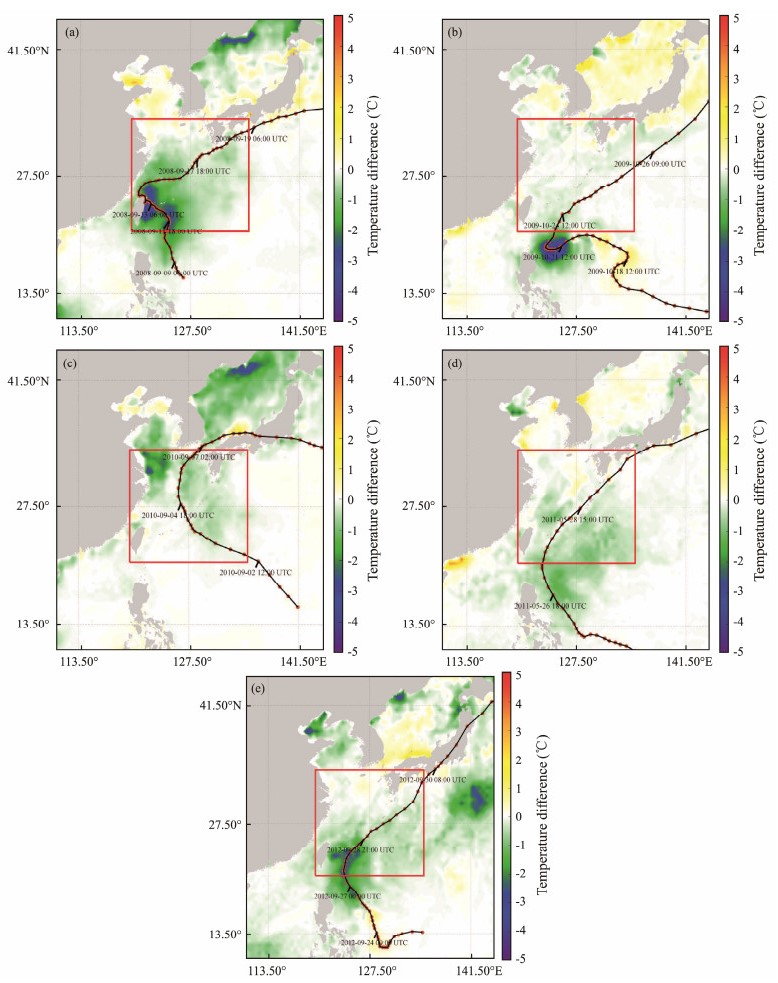
To analyze the distribution of water temperature in the Kuroshio Current area, the variations in the SST of five typhoons are shown in Fig. 7, i.e., (a) on September 10 − 19 for Typhoon Sinlaku (2008), (b) on October 23 − 26 for Typhoon Lupit (2009), (c) on September 2 − 7 for Typhoon Malou (2010), (d) on May 27 − 29 for Typhoon Songda (2011), and (e) on September 27−30 for Typhoon Jelawat (2012), which passed the domain area outlined by the red rectangle. In general, the reduction of the SST is determined; however, the amplitude of reduction varies due to the relative positions of the typhoon path and the Kuroshio Current. The typhoon-induced SST cooling associated with the typhoon path crossing the Kuroshio Current (Fig. 7c) was up to −2℃, whereas the reduction in the SST associated with a typhoon's path parallel to the Kuroshio Current (Fig. 7a; Fig. 7b; Fig. 7e) was up to −4℃. Remarkably, as for the parallel path, the reduction of the SST (about −1℃) in the Kuroshio Current was observed, as outlined by the black rectangles in Figs. 7b and 7d, although the typhoon path is away from the Kuroshio Current. The SST cooling also occurred at the western Taiwan Island in the shelf sea (Figs. 7a and 7e). The typhoon-induced wind waves are strong, and the propagation direction of the waves is generally opposite to the flow direction of the Kuroshio Current. This is a probable explanation that typhoon-induced SST cooling could affect the reduction of water temperature in the Kuroshio Current.
|
Fig. 7 Horizontal distributions of SST cooling. (a), results taken on September 19 minus results taken on September 10 during Typhoon Sinlaku (2008); (b), results taken on October 26 minus results taken on October 23 during Typhoon Lupit (2009); (c), results taken on September 7 minus results taken on September 2 during Typhoon Malou (2010); (d), results taken on May 29 minus results on May 27 during Typhoon Songda (2011); (e), results taken on September 30 minus results taken on September 27 during Typhoon Jelawat (2012). |
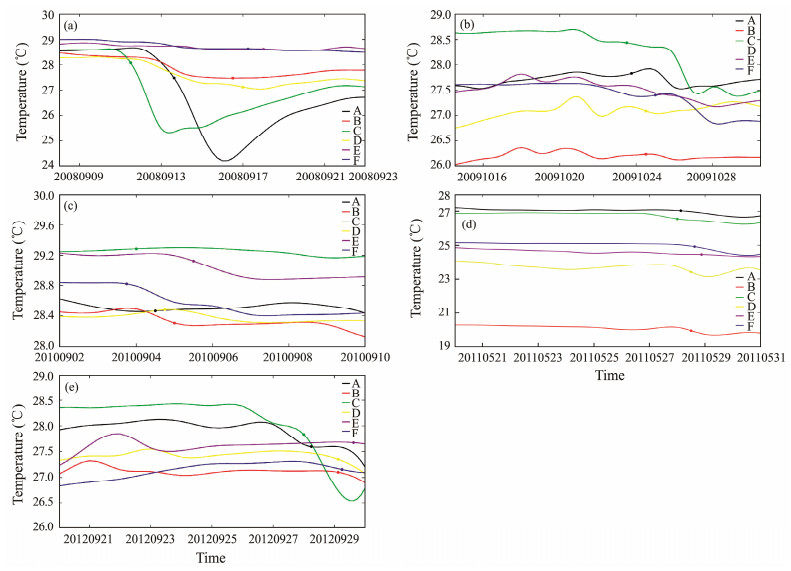
Furthermore, six typical points (A − F in Fig. 1b) were selected to analyze the variations in the SST according to the typhoon movements. Points A, D, and E were located in the flow direction of the Kuroshio Current; point B was located on the left side of the Kuroshio Current; and points C and F were located on the right side of the Kuroshio Current on the open sea. Fig. 8 shows the variations in the SST during the five typhoon durations at the six points. The SST cooling was significantly observed during Typhoon Sinlaku (Fig. 8a) with the reduction of the SST up to −4℃, which passed the shelf sea around Taiwan Island with a maximum wind speed of up to 50 m s−1. However, the SST cooling was relatively weak for other typhoons; for instance, the SST changed a little in Typhoon Songda. This result indicated that warm water could weaken the SST cooling in the case of low typhoon intensity. To illustrate the relationship among the sea surface currents, waves, and SST, the results from Typhoon Sinlaku were used for further analysis.
|
Fig. 8 Variations in the SST at the six points (as shown in Fig. 1b) obtained by the sbPOM. (a), in Typhoon Sinlaku (2008); (b), Typhoon Lupit (2009); (c), Typhoon Malou (2010); (d), Typhoon Songda (2011); (e), Typhoon Jelawat (2012). |
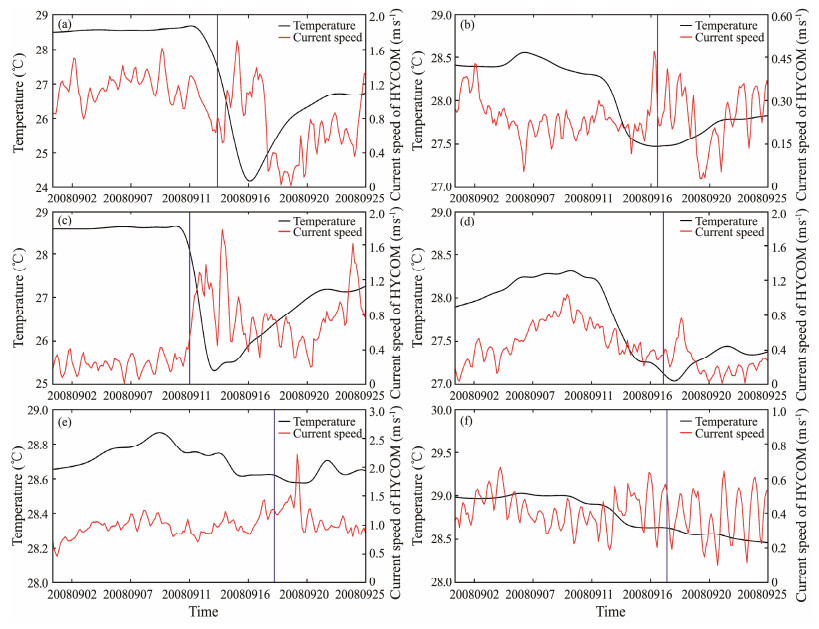
The HYCOM currents and WW3-simulated waves were analyzed in Typhoon Sinlaku, as presented in Fig. 9, where the difference was calculated by subtracting the results taken on September 10, 2018, from those taken on September 19, 2018. The difference in the flow speed of the Kuroshio Current was up to 0.5 m s−1, indicating that the current was enhanced by a typhoon. Similarly, the SWH increased up to 6 m. However, the pattern of the sea surface current had no obvious relationship with the SST cooling pattern (Fig. 7a). The further analysis between the SST and current speed at the six points is exhibited in Fig. 10, in which the blue lines present the passing time of the typhoon eye at each point. At points A and D, located in the Kuroshio Current, the SST decreased with the increasing current speed after the typhoon passed from September 11 to September 16 (Figs. 10a and 10d). This relation was also particularly apparent in points B and C (Figs. 10b and 10c). In particular, the SST decreased by approximately 5℃ when the surface current speed reached 1.8 m s−1 (points A and C). At point F, which is far away from the Kuroshio Current (current speed < 0.6 m s−1), the SST decreased by 0.5℃, which may be caused by the high sea state. By contrast, the reduction of the SST at point E is approximately 0.2℃ as the current went up to 2 m s−1 at the end of the Typhoon Sinlaku duration. In this sense, the current and waves could induce SST cooling. Furthermore, the SST reduction is significantly enhanced by strong wind-wave-current interactions that transmit the energy at the air-sea layer.

|
Fig. 9 Horizontal distributions of the result taken on September 19 minus results taken on September 10 during Typhoon Sinlaku (2008). (a), difference in the current speed obtained from the HYCOM; (b), difference in the SWH obtained from the WW3 model. |
|
Fig. 10 Relation between the surface current speed and water temperature on September 1–25, 2008. (a) – (f), present the results at points A – F shown in Fig. 1b. The blue line represents the moments when the typhoon's eye passed the points. |
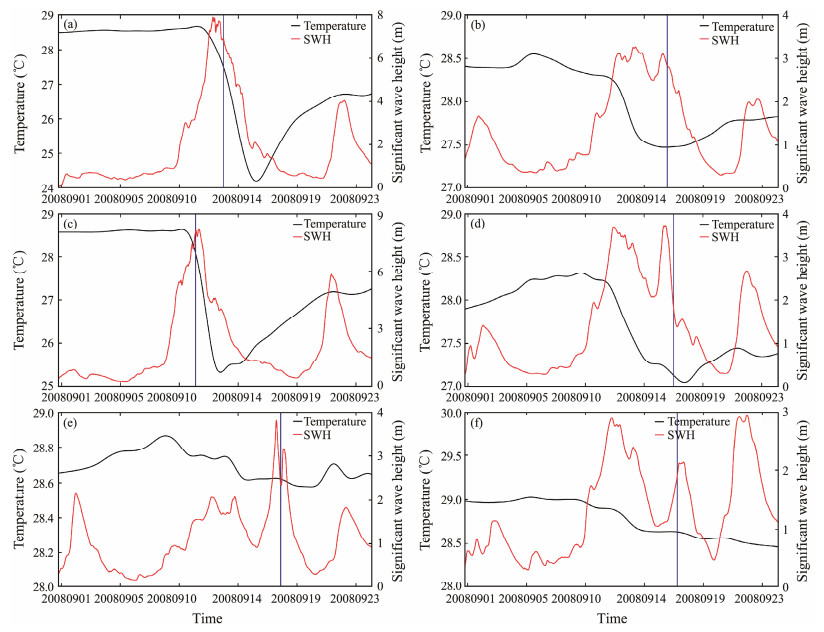
Fig. 11 shows the relationship between the SWH and SST in Typhoon Sinlaku at six points. Clearly, the SST decreased with an increase in the SWH on September 11 − 16, 2008. This behavior is particularly apparent in Figs. 11a and 11b; i.e., the SST reduction was up to 5℃ when the SWH reached 8 m. At point A, the direction of the Kuroshio Current is generally opposite to the wind-induced current, including the Stokes drift and breaking-induced current, which caused the strong exchange of energy and heat flux. This issue may enhance SST cooling. Interestingly, the comparison results of Figs. 10a − 10d show that the maximum SST reduction lagged behind the occurrence of the SWH peak, such as the 2-day delay at point A and the 1-day delay at point C.
|
Fig. 11 Relation between the SWH and water temperature on September 1–25, 2008. (a) – (f) present the results at points A – F shown in Fig. 1b. The blue line represents the moments when the typhoon's eye passed the points. |
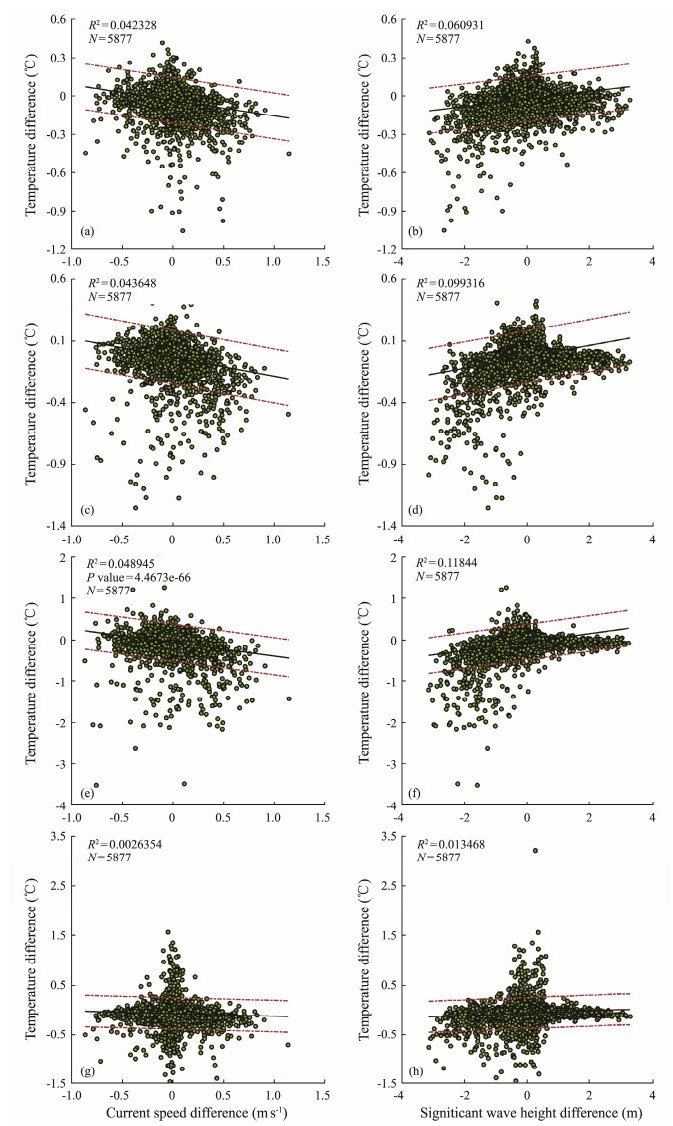
As was reported in a previous study (Sun et al., 2021), a statistical analysis has revealed that the four wave-induced terms influenced SST cooling during binary typhoon events; in particular, the drag phenomenon on the SST caused by wave-induced terms was found. However, the specific effects of the individual wave-induced terms are not sufficiently studied. Figs. 12b – 12d show that the regression analysis of the difference in the SST on September 10 − 19, 2008 (e.g., the SST on September 11 minus the SST on September 10) versus the difference in the current speed and SWH, including the effect of radiation stress (a and b), nonbreaking waves (c and d), Stokes drift (e and f), and breaking wave (g and h). The two red dotted lines represent the 95% prediction intervals. Moreover, the squared correlation coefficient (R2 = 0.11), including the term of the Stokes drift, is higher than those including the other three wave-induced terms (R2 < 0.06). This finding indicates that the Stokes drift plays an important role in SST cooling in the background of the Kuroshio Current. The variations also showed that the difference in SSTs had a negative relation with the SWH, whereas it was positively related to the current speed.
|
Fig. 12 Regression analysis of the difference in the SSTs on September 10 − 19, 2008 (e.g., the SST taken on September 11 minus the SST taken on September 10) versus the difference in the current speed and SWH, including the effect of radiation stress (a and b), nonbreaking waves (c and d), Stokes drift (e and f), and breaking wave (g and h). The two red dotted lines represent the 95% prediction intervals. |
As the wind grows, the SWH of the wind-induced terms increases, and then the wave-induced terms (radiation stress, nonbreaking waves, and Stokes drift) enlarge. The interaction of the terms with the Kuroshio Current, particularly the Stokes drift, caused Langmuir circulation during the typhoon event, accelerated the energy and heat exchange between the wave and the Kuroshio Current, and resulted in wave breaking. In the background of huge waves, wave breaking inevitably leads to SWH decrease and heat flux transmission from the ocean to the atmosphere, and the breaking-induced currents also affect the variation in background currents. This is a probable reason that SST cooling is consistent with the variation of the current speed, whereas the difference in the SST is opposite to the SWH increase.
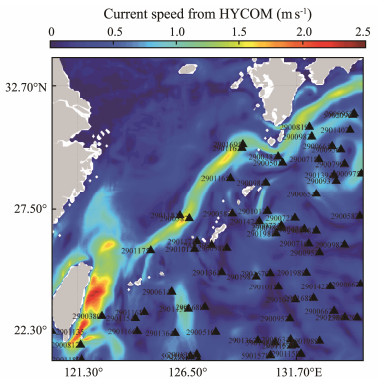
4.2 Variations in the MLDThe profile of the water temperature in the vertical direction of the ocean could also be affected by typhoon waves. More than 30 ARGOS data were available in the five typhoons, and the geographic locations are exhibited in Fig. 13. In this section, the effects of the individual wave-induced terms on the water temperature at various water depths and the variations in the mixing layer are discussed.
|
Fig. 13 Geographic locations of ARGOS data overlaid in the HYCOM currents. |
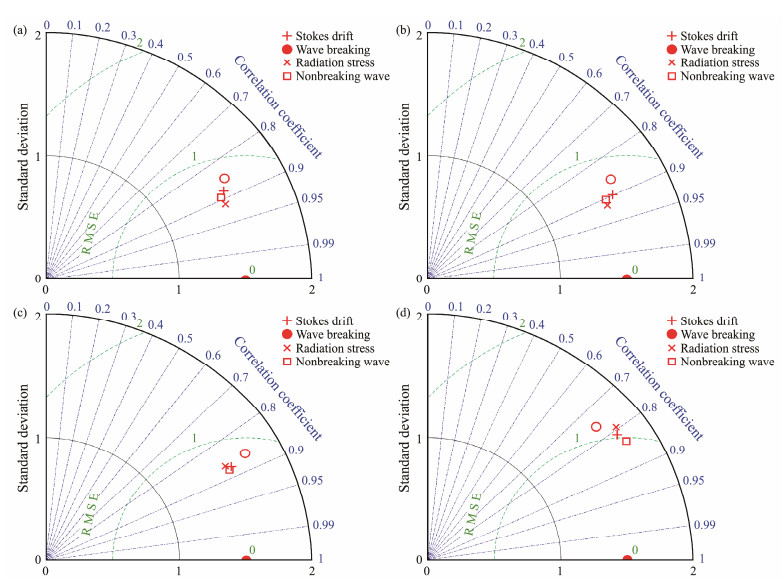
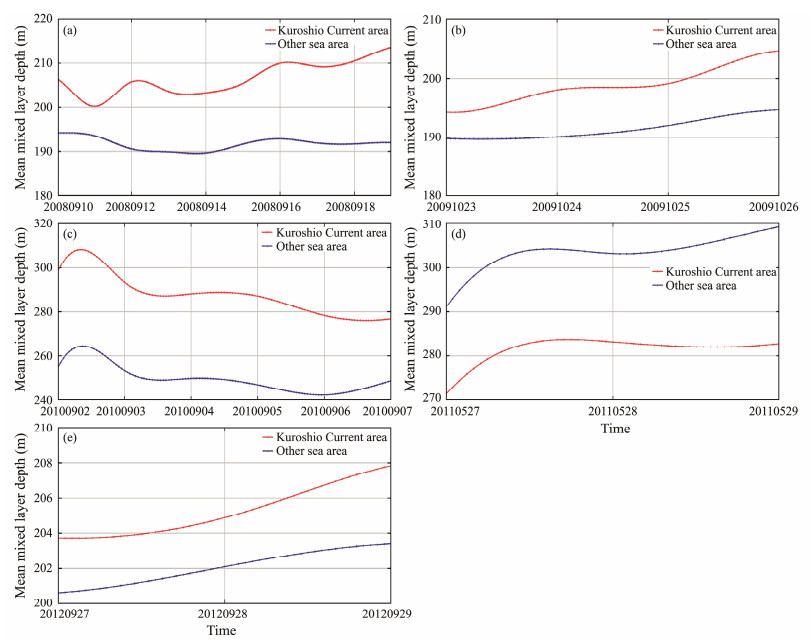
By the analysis of the Taylor diagram, Fig. 14 shows the accuracy of the water temperature, including the four wave-induced terms, i.e., radiation stress (a), nonbreaking waves (b), Stokes drift (c), and breaking waves (d), when five typhoons passed the area outlined in Fig. 1b. Water temperatures with the measurements from ARGOS were compared at water depths of 5, 15, 30, and 50 m. The results show that three wave-induced terms, i.e., the radiation stress, nonbreaking waves, and Stokes drift, have similar influences on the variation in water temperature. However, the accuracy of the water temperature was reduced when the breaking wave term was included. In addition, the variation in the mean MLD in the area outlined in Fig. 1b during the five typhoons was analyzed, as presented in Fig. 15, e.g., Typhoons Sinlaku (Fig. 15a), Lupit (Fig. 15b), Malou (Fig. 15c), Songda (Fig. 15d), and Jelawat (Fig. 15e). The depth at 0.5℃ lower than the SST is defined as the MLD in this study (Kelly and Qiu, 1995). The typhoon enhanced the mean MLD in the area outlined in Fig. 1b, especially in the Kuroshio Current area. However, due to the summer monsoon (Thompson and Tkalich, 2014) and the seasonal variation of the MLD (He et al., 2012), the mean MLD in the Kuroshio Current area was lower than the other sea areas shown in Fig. 15d. In particular, the typhoon had little impact on the mean MLD in the Kuroshio Current area. Typhoon Malou crossed the Kuroshio Current, whereas the other four typhoons were parallel to the flow of the Kuroshio Current. As shown in Fig. 15c, the mean MLD slightly increased and then rapidly decreased. This behavior is probably caused by two aspects: weak wave-induced effects as a typhoon passes the Kuroshio Current and the floating of cold water without strong wind force.
|
Fig. 14 Taylor diagram of the effects of the wave-induced terms on the water temperature at water depths of 5 (a), 15 (b), 30 (c), and 50 m (d). |
|
Fig. 15 Variations of the mean mixing layer depth (MLD) at the area outlined in Fig. 1b. (a), from September 10 to 19 during Typhoon Sinlaku (2008); (b), from October 23 to 26 during Typhoon Lupit (2009); (c), from September 2 to 7 during Typhoon Malou (2010); (d), from May 27 to 29 during Typhoon Songda (2011); and (e), from September 27 to 29 during Typhoon Jelawat (2012). |
The strong wind-wave-current interaction is essential for the variations in the water temperature in typhoons. The effects of typhoon waves have been widely studied during single and binary typhoon events (Zhu et al., 2016; Sun et al., 2021). Here the sbPOM, which included the effects of four wave-induced terms (breaking waves, nonbreaking waves, radiation stress, and Stokes drift) from the WW3 model, was used to simulate the water temperature when a typhoon passed the Kuroshio Current. The effects of the individual wave-induced terms on the profile of water temperature and the variation of the mean MLD were also investigated.
The cyclonic H-E wind, composed of ERA-5 and a parametric Holland model, was constructed and then treated as a force field in the WW3 model and the HYCOM current. The measurements from the Jason-2 altimeter were used to validate the SWH simulated by the WW3 model. The RMSE was less than 0.5 m, and the COR was approximately 0.93, indicating that the WW3-simulated waves were suitable for calculating the four wave-induced terms. The H-E winds, NCEP heat flux, and SODA salinity were treated as force fields in the sbPOM. The water temperature measured from the ARGOS was applied to validate the sbPOM-simulated results, yielding a 0.92℃ RMSE of the SST and a COR of approximately 0.99. A reduction in the SST of the Kuroshio Current was observed, although the paths of several typhoons were away from the Kuroshio Current, and the water temperature is quite high, indicating that the effect of the typhoon-induced SST cooling is strong. SST cooling was weakened by the Kuroshio Current in the case of low typhoon intensities. The variations of the SST in terms of the current speed and SWH were analyzed. The results show that the SST is consistent with the current speed, whereas the maximum SST reduction lagged with the occurrence of the peak SWH. The regression analysis revealed that the difference in the SST was positive with the current speed, and it was negative with the SWH. Although the relationship between the difference in the SST including the four wave-induced terms and the current was similar, R2 including the Stokes drift (0.11) was higher than those including the other three terms (R2 < 0.06).
This behavior is explained as follows: The wave-induced radiation stress, nonbreaking waves, and Stokes drift are strong in typhoons and interact with the Kuroshio Current, which may result in Langmuir circulations during typhoon events and subsequently accelerate the energy and heat exchange. Then, breaking waves cause the SWH to decrease and heat flux transmission from the ocean to the atmosphere. The effects of the individual wave-induced terms at water depths of 5, 15, 30, and 50 m were also analyzed. The results show that breaking waves should be excluded in the water temperature simulation in the inside part of the ocean because the accuracy of the water temperature was significantly reduced when considering breaking waves. In addition, the variations in the mean MLD during the five typhoons were analyzed. Generally, the results show that typhoons could enhance the mean MLD in the Kuroshio Current area in September and October, whereas typhoons have little influence on the mean MLD in the Kuroshio Current area in May. The path of Typhoon Malou was vertical to the Kuroshio Current, resulting in the weakening of the cyclonic wind force and wave-induced effects. This condition caused the mean MLD to increase slightly and then decrease during Typhoon Malou.
As a matter of fact, mesoscale eddies affect the dynamic structure of circulation in the horizontal and vertical directions. In future studies, more typhoon cases will be collected to investigate the influence of eddies on waves and variations in water temperature using numerical ocean models.
AcknowledgementsThis work was supported by the National Natural Science Foundation of China (Nos. 42076238, 42176012, and 42130402), the National Key Research and Development Program of China (No. 2021YFC310 1702), and the Shanghai Frontiers Research Center of the Hadal Biosphere. We thank the National Centers for Environmental Prediction (NCEP) of the National Oceanic and Atmospheric Administration (NOAA) for providing the WAVEWATCH-Ⅲ (WW3) model. The original code of the Stony Brook Parallel Ocean Model (sbPOM) was downloaded for free from http://www.ccpo.odu.edu. The European Centre for Medium-Range Weather Forecasts (ECMWF) wind fields were downloaded from http://www.ecmwf.int. The bathymetric data of the General Bathymetry Chart of the Oceans (GEBCO) were obtained from ftp.edcftp.cr.usgs.gov. The simple ocean data assimilation (SODA) data were obtained from https://climatedataguide.ucar.edu. The NCEP wind field and heat flux data were obtained from http://www.cdc.noaa.gov. The current data from the HYbrid Coordinate Ocean Model (HYCOM) were obtained via http://ncss.hycom.org. The Argo observation data were obtained from https://data.nodc.noaa.gov.
Abdalla, S., Janssen, P. E. M., and Bidlot, J. R., 2010. Jason-2 OGDR wind and wave products: Monitoring, validation and assimilation. Marine Geodesy, 33: 239-255. DOI:10.1080/01490419.2010.487798 (  0) 0) |
Bender, L. C., 2009. Modification of the physics and numerics in a third-generation ocean wave model. Journal of Atmospheric and Oceanic Technology, 13(3): 513-541. DOI:10.1175/1520-0426(1996)0132.0.CO;2 (  0) 0) |
Bleck, R., 2002. An oceanic general circulation model framed in hybrid isopycnic-cartesian coordinates. Ocean Modelling, 4(1): 55-88. DOI:10.1016/S1463-5003(01)00012-9 (  0) 0) |
Caruso, M. J., Gawarkiewicz, G. G., and Beardsley, R. C., 2006. Interannual variability of the Kuroshio intrusion in the South China Sea. Journal of Oceanography, 62(4): 559-575. DOI:10.1007/s10872-006-0076-0 (  0) 0) |
Chassignet, E. P., Smith, L. T., Halliwell, G. R., and Bleck, R., 2003. North Atlantic simulations with the hybrid coordinate ocean model (HYCOM): Impact of the vertical coordinate choice, reference pressure, and thermobaricity. Journal of Physical Oceanography, 33(12): 2504-2526. DOI:10.1175/1520-0485(2003)033<2504:NASWTH>2.0.CO;2 (  0) 0) |
Chen, C., Huang, H., Beardsley, R. C., Liu, H., Xu, Q. C., and Cowles, G., 2007. A finite volume numerical approach for coastal ocean circulation studies: Comparisons with finite difference models. Journal of Geophysical Research, 112(C3): C03018. DOI:10.1029/2006JC003485 (  0) 0) |
Chen, C. T., Zhu, J. H., Lin, M. S., Zhao, Y. L., Wang, H., and Wang, J., 2017. Validation of the significant wave height product of HY-2 altimeter. Remote Sensing, 9(10): 1016. DOI:10.3390/rs9101016 (  0) 0) |
Doong, D. J., Tsai, C. H., Chen, Y. C., Peng, J. P., and Huang, C. J., 2015. Statistical analysis on the long-term observations of typhoon waves in the Taiwan Sea. Journal of Marine Science and Technology, 23(6): 893-900. DOI:10.6119/JMST-015-0610-7 (  0) 0) |
Emanuel, K. A., 1985. An air-sea interaction theory for tropical cyclones. Part Ⅰ: Steady-state maintenance. Journal of the Atmospheric Sciences, 43: 585-605. DOI:10.1175/1520-0469(1986)043<0585:AASITF>2.0.CO;2 (  0) 0) |
Guan, C. L., Hu, W., Sun, J., and Li, R. L., 2007. The whitecap coverage model from breaking dissipation parametrizations of wind waves. Journal of Geophysical Research, 112(C5): C05013. DOI:10.1029/2006JC003714 (  0) 0) |
He, J. L., He, Y. H., and Cai, S. Q., 2012. Assessing the application of Argo profiling float data to the study of the seasonal variation of the hydrological parameters and the current field east of Luzon Strait. Atmosphere-Ocean, 50: 77-91. DOI:10.1080/07055900.2012.719822 (  0) 0) |
Holland, G. J., 1980. An analytic model of the wind and pressure profiles in hurricanes. Monthly Weather Review, 108: 1212-1218. DOI:10.1175/1520-0493(1980)108<1212:aamotw>2.0.co;2 (  0) 0) |
Holthuijsen, L., 2001. The continued development of the third-generation shallow water wave model 'SWAN'. Tu Delft Department of Hydraulic Engineering, 32(3): 185-186. DOI:10.1179/174328105X38062 (  0) 0) |
Hsu, P. C., and Ho, C. R., 2019. Typhoon-induced ocean subsurface variations from glider data in the Kuroshio region adjacent to Taiwan. Journal of Oceanography, 75(1): 1-21. DOI:10.1007/s10872-018-0480-2 (  0) 0) |
Hu, H. G., and Wang, J., 2010. Modeling effects of tidal and wave mixing on circulation and thermohaline structures in the Bering Sea: Process studies. Journal of Geophysical Research, 115: C01006. DOI:10.1029/2008JC005175 (  0) 0) |
Hu, Y. Y., Shao, W. Z., Shi, J., Sun, J., Ji, Q. Y., and Cai, L. N., 2020. Analysis of the typhoon wave distribution simulated in WAVEWATCH-Ⅲ model in the context of Kuroshio and wind-induced current. Journal of Oceanology and Limnology, 38(6): 1692-1710. DOI:10.1007/s00343-019-9133-6 (  0) 0) |
Jiang, X. P., Zhong, Z., and Liu, C. X., 2008. The effect of typhoon-induced SST cooling on typhoon intensity: The case of Typhoon Chan-chu. Advances in Atmospheric Sciences, 25: 1062-1072. DOI:10.1007/s00376-008-1062-9 (  0) 0) |
Jones, P. W., Worley, P. H., Yoshida, Y., Iii, J., and Levesque, J., 2010. Practical performance portability in the parallel ocean program (POP). Concurrency and Computation: Practice & Experience, 17(10): 1317-1327. DOI:10.1002/cpe.894 (  0) 0) |
Jordi, A., and Wang, D. P., 2012. SbPOM: A parallel implementation of Princeton Ocean Model. Environmental Modelling & Software, 38: 59-61. DOI:10.1016/j.envsoft.2012.05.013 (  0) 0) |
Jun, K. C., Jeong, W. M., Choi, J. Y., Park, K. S., Jung, K. T., Kim, M. K., et al., 2015. Simulation of the extreme waves generated by Typhoon Bolaven (1215) in the East China Sea and Yellow Sea. Acta Oceanologica Sinica, 34(12): 19-28. DOI:10.1007/s13131-015-0779-4 (  0) 0) |
Kamenkovich, V. M., and Nechaev, D. A., 2009. On the time-splitting scheme used in the Princeton Ocean Model. Journal of Computational Physics, 228(8): 2874-2905. DOI:10.1016/j.jcp.2008.12.033 (  0) 0) |
Kelly, K. A., and Qiu, B., 1995. Heat flux estimates for the western North Atlantic, I, assimilation of satellite data into a mixed layer model. Journal of Physical Oceanography, 25(10): 2344-2360. DOI:10.1175/1520-0485(1995)025<2344:HFEFTW>2.0.CO;2 (  0) 0) |
Lee, C. Y., and Chen, S. S., 2014. Stable boundary layer and its impact on tropical cyclone structure in a coupled atmosphere – Ocean model. Monthly Weather Review, 142(5): 1927-1944. DOI:10.1175/MWR-D-13-00122.1 (  0) 0) |
Li, X. F., 2015. The first sentinel-1 SAR image of a typhoon. Acta Oceanologica Sinica, 34(1): 1-2. DOI:10.1007/s13131-015-0589-8 (  0) 0) |
Liang, G. Z., Yang, J. G., and Wang, J. C., 2021. Accuracy evaluation of CFOSAT SWIM L2 products based on NDBC buoy and Jason-3 altimeter data. Remote Sensing, 13(5): 887. DOI:10.3390/rs13050887 (  0) 0) |
Lin, I. I., Liu, W. T., Wu, C. C., Chiang, J., and Sui, C. H., 2003. Satellite observations of modulation of surface winds by typhoon-induced upper ocean cooling. Geophysical Research Letters, 30(3): 1131. DOI:10.1029/2002GL015674 (  0) 0) |
Ma, Z. Y., Zhang, Y. Z., Wu, R. H., and Na, R., 2013. Statistical characteristics of the response of sea surface temperatures to westward typhoons in the South China Sea. Remote Sensing, 13(5): 916. DOI:10.3390/rs13050916 (  0) 0) |
Mesquita, O. N., Kane, S., and Gollub, J. P., 1992. Transport by capillary waves: Fluctuating stokes drift. Physical Review A, 45(6): 3700-3705. DOI:10.1103/PhysRevA.45.3700 (  0) 0) |
Morimoto, A., Kojima, S., Jan, S., and Takahashi, D., 2009. Movement of the Kuroshio axis to the northeast shelf of Taiwan during typhoon events. Estuarine, Coastal and Shelf Science, 82(3): 547-552. DOI:10.1016/j.ecss.2009.02.022 (  0) 0) |
Oke, P. R., and Schiller, A., 2007. Impact of Argo, SST, and altimeter data on an eddy-resolving ocean reanalysis. Geophysical Research Letters, 34(19): L19601. DOI:10.1029/2007GL031549 (  0) 0) |
Pun, I. F., Lin, I. I., and Lo, M. H., 2013. Recent increase in high tropical cyclone heat potential area in the western North Pacific Ocean. Geophysical Research Letters, 40(17): 4680-4684. DOI:10.1002/grl.50548 (  0) 0) |
Rastigejev, Y., and Suslov, S. A., 2019. Effect of evaporating sea spray on heat fluxes in a marine atmospheric boundary layer. Journal of Physical Oceanography, 49(7): 1927-1948. DOI:10.1175/JPO-D-18-0240.1 (  0) 0) |
Robertson, R., Padman, L., and Levine, M. D., 2001. A correction to the baroclinic pressure gradient term in the Princeton Ocean Model. Journal of Atmospheric and Oceanic Technology, 18(6): 1068-1075. DOI:10.1175/1520-0426(2001)018<1068:ACTTBP>2.0.CO;2 (  0) 0) |
Robinson, A. R., and Walstad, L. J., 1987. The Harvard open ocean model: Calibration and application to dynamical process, forecasting, and data assimilation studies. Applied Numerical Mathematics, 3: 89-131. DOI:10.1016/0168-9274(87)90008-0 (  0) 0) |
Rogers, W. E., Hwang, P. A., and Wang, D. W., 2010. Investigation of wave growth and decay in the SWAN model: Three regional-scale applications. Journal of Physical Oceanography, 33(2): 366-389. DOI:10.1175/1520-0485(2003)033<0366:IOWGAD>2.0.CO;2 (  0) 0) |
Sakaida, F., Kawamura, H., and Toba, Y., 1998. Sea surface cooling caused by typhoons in the Tohuku area in August 1989. Journal of Geophysical Research, 103: 1053-1065. DOI:10.1029/97JC01859 (  0) 0) |
Shao, W. Z., Jiang, T., Zhang, Y., Shi, J., and Wang, W. L., 2021. Cyclonic wave simulations based on WAVEWATCH-Ⅲ using a sea surface drag coefficient derived from CFOSAT SWIM data. Atmosphere, 12(12): 1610. DOI:10.3390/atmos12121610 (  0) 0) |
Shao, W. Z., Jiang, X. W., Sun, Z. F., Hu, Y. Y., Marino, A., and Zhang, Y. G., 2022. Evaluation of wave retrieval for Chinese Gaofen-3 synthetic aperture radar. Geo-Spatial Information Science, 25: 229-243. DOI:10.1080/10095020.2021.2012531 (  0) 0) |
Shao, W. Z., Sheng, Y. X., Li, H., Shi, J., Ji, Q. Y., Tan, W., et al., 2018. Analysis of wave distribution simulated by WAVEWATCH-Ⅲ Model in typhoons passing Beibu Gulf, China. Atmosphere, 9(7): 265. DOI:10.3390/atmos9070265 (  0) 0) |
Shay, L. K., Black, P. G., Mariano, A. J., Hawkins, J. D., and Elsberry, R. L., 1992. Upper ocean response to hurricane Gilbert. Journal of Geophysical Research, 97: 20227-20248. DOI:10.1029/92jc01586 (  0) 0) |
Shchepetkin, A. F., and McWilliams, J. C., 2005. The regional ocean modeling system: A split-explicit, free-surface, topography following coordinates ocean model. Ocean Modelling, 9: 347-404. DOI:10.1016/j.ocemod.2004.08.002 (  0) 0) |
Sheng, Y. X., Shao, W. Z., Li, S. Q., Zhang, Y. M., Yang, H. W., and Zuo, J. C., 2019. Evaluation of typhoon waves simulated by WaveWatch-Ⅲ model in shallow waters around Zhoushan Islands. Journal of Ocean University of China, 18(2): 365-375. DOI:10.1007/s11802-019-3829-2 (  0) 0) |
Sun, Z. F., Shao, W. Z., Yu, W. P., and Li, J., 2021. A study of wave-induced effects on sea surface temperature simulations during typhoon events. Journal of Marine Science and Engineering, 9(6): 622. DOI:10.3390/jmse9060622 (  0) 0) |
The WAVEWATCH Ⅲ Development Group, 2019. User Manual and System Documentation of WAVEWATCH Ⅲ Version 6.07. Technical note 333, NOAA/NWS/NCEP/MMAB, College Park, MD, 465pp.
(  0) 0) |
Thompson, B., and Tkalich, P., 2014. Mixed layer thermodynamics of the southern South China Sea. Climate Dynamics, 43(7): 2061-2075. DOI:10.1007/s00382-013-2030-3 (  0) 0) |
Tolman, L., 1991. A third-generation model for wind waves on slowly varying, unsteady, and inhomogeneous depths and currents. Journal of Physical Oceanography, 21: 782-797. DOI:10.1175/1520-0485(1991)021<0782:atgmfw>2.0.co;2 (  0) 0) |
Tsai, Y., Chern, C. S., and Wang, J., 2008. The upper ocean response to a moving typhoon. Journal of Oceanography, 64(1): 115-130. DOI:10.1007/s10872-008-0009-1 (  0) 0) |
Wang, X., and Cheng, G., 2015. Tracking typhoon-generated swell in the western North Pacific Ocean using satellite altimetry. Chinese Journal of Oceanology and Limnology, 33(5): 1157-1163. DOI:10.1007/s00343-015-4121-y (  0) 0) |
Wei, J., Liu, X., and Wang, D. X., 2014. Dynamic and thermal responses of the Kuroshio to typhoon Megi (2004). Geophysical Research Letters, 41: 8495-8502. DOI:10.1002/2014GL061706 (  0) 0) |
Wu, C. R., Chang, Y. L., Oey, L. Y., Chang, J., and Hsin, Y. C., 2008. Air-sea interaction between tropical cyclone Nari and Kuroshio. Geophysical Research Letters, 35: L12605. DOI:10.1029/2008GL033942 (  0) 0) |
Wu, L., Chen, C., Guo, P., Shi, M., Qi, J., and Ge, J., 2011. A FVCOM-based unstructured grid wave, current, sediment transport model, I. Model description and validation. Journal of Ocean University of China, 10(1): 1-8. DOI:10.1007/s11802-011-1788-3 (  0) 0) |
Xie, B., and Zhang, F., 2011. Impacts of typhoon track and island topography on the heavy rainfalls in Taiwan associated with Morakot (2009). Monthly Weather Review, 140(10): 3379-3394. DOI:10.1175/mwr-d-11-00240.1 (  0) 0) |
Yang, Z. H., Shao, W. Z., Ding, Y., Shi, J., and Ji, Q. Y., 2020. Wave simulation by the SWAN model and FVCOM considering the sea-water level term around the Zhoushan Islands. Journal of Marine Science and Engineering, 8(10): 783. DOI:10.3390/jmse8100783 (  0) 0) |
Yuan, Y., Hua, F., Pan, Z., and Sun, L., 1991. LAGDF-WAM numerical wave model – I. Basic physical model. Acta Oceanologica Sinica, 10: 483-488. (  0) 0) |
Zhang, C., Hou, Y. J., and Li, J., 2018. Wave-current interaction during Typhoon Nuri (2008) and Hagupit (2008): An application of the-coupled ocean-wave modeling system in the northern South China Sea. Journal of Oceanology and Limnology, 36: 65-77. DOI:10.1007/s00343-018-6088-y (  0) 0) |
Zhang, J., Schmitt, R. W., and Huang, R. X., 1998. Sensitivity of the GFDL modular ocean model to parameterization of double-diffusive processes. Journal of Physical Oceanography, 28(4): 589-605. DOI:10.1175/1520-0485(1998)028<0589:SOTGMO>2.0.CO;2 (  0) 0) |
Zhou, L. M., Li, Z. B., Mu, L., and Wang, A. F., 2014. Numerical simulation of wave field in the South China Sea using WAVEWATCH Ⅲ. Chinese Journal of Oceanology and Limnology, 37: 656-664. DOI:10.1007/s00343-014-3155-x (  0) 0) |
Zhu, P., Wang, Y., Chen, S. S., Curcic, M., and Gao, C., 2016. Impact of storm-induced cooling of sea surface temperature on large turbulent eddies and vertical turbulent transport in the atmospheric boundary layer of hurricane Isaac. Journal of Geophysical Research, 121(1): 861-876. DOI:10.1002/2015JC011320 (  0) 0) |
 2024, Vol. 23


