2) Nantong Ocean and Coastal Engineering Research Institute, Hohai University, Nantong 226000, China;
3) Key Laboratory of Ministry of Education for Coastal Disaster and Protection, Hohai University, Nanjing 210098, China;
4) College of Meteorology and Oceanography, National University of Defense Technology, Changsha 410073, China;
5) The First Institute of Oceanography, MNR, Qingdao 266061, China
Climate change causes many global problems, such as sea-level fluctuations, global warming, and extreme weather events (Renner et al., 2014). Relevant studies on extreme weather events found that global climate change may directly affect the characteristics of global and regional tropical cyclone (TC) activity (Deng et al., 2022; Wu et al., 2022). Others pointed out that climate change may first modify the characteristics of sea surface temperature (SST; Zhao et al., 2018; Dabali et al., 2021), upper tropospheric disturbance (Wu et al., 2015), and vertical wind shear (Wang et al., 2015), which can change the characteristics of TC activities worldwide (Wang et al., 2015). In terms of the specific characteristics of TC activity, relevant studies often focus on factors such as frequency, intensity, lifetime maximum intensity (LMI), genesis location, landfall location, track, and TC activity season (Kossin et al., 2014; Yang and Chen, 2021). Taking the frequency of TCs as an example, some studies using diverse methods, including model prediction, predicted a decrease in the frequency of global or regional TCs (Chen et al., 2020; Yang and Chen, 2021). Indicators, such as cyclone energy index and ACE, are indirectly used to assess the characteristics of TC activity. In particular, ACE is a combination of the number, lifetime, and intensity of TCs (Bell et al., 2000; Camargo and Sobel, 2005). It is the square of the maximum wind speed and can be obtained from the best track dataset. Owing to its suitability for indexing the impact of TCs on climate, ACE was used to assess TC activity characteristics in this study.
Disasters caused by TCs have threatened the coast of many countries, including China and the United States (Wu et al., 2015; Zhang et al., 2019), ravaging thousands of hectares of crops, destroying ships and tidal dikes along the coast, and causing many deaths and direct economic losses (Feng et al., 2018). According to the best path dataset of TCs in the WNP basin (Ying et al., 2014; Lu et al., 2021; Xiao, 2021) provided by the China Meteorological Administration (CMA), one-third of global TCs are generated in the WNP basin every year, making it an important genesis location for TCs (Fang et al., 2022). As an example, approximately seven TCs pass through the ECS (including the Bohai Sea, Yellow Sea, and East China Sea) annually. Historical records show that the frequency and intensity characteristics of TCs in this basin have been studied extensively (Zhang et al., 2018).
Storm surges caused by TCs are among offshore waters' most common and severe marine disasters (Feng et al., 2018; Fang et al., 2022). Among all TCs, the maximum storm surge caused by STYs (2-minute mean maximum sustained wind speed near the TC center ≥ 51 m s−1 according to the CMA) was greater than the one caused by TCs with low intensity (Fossell et al., 2017). Impact factors, including TC intensity (Rego and Li, 2009; Fossell et al., 2017), TY path (Feng et al., 2012), and moving speed (Rego and Li, 2009; Fossell et al., 2017), add complexity to the research on the dynamic process of typhoon (TY) storm surge disasters. According to the historical records provided by the CMA, many STYs landed on the East China coast, but only a few can maintain their STY intensity. Many studies investigated storm surges by focusing on a single case of typical STY (Yang et al., 2021). However, we noticed that only a few studies considered the characteristics of typical STY activity in the ECS maintained when landing the coast and their effect on the storm surge, though these TCs, including TY Lekima, Meranti, and Saomai, caused a huge loss to East China.
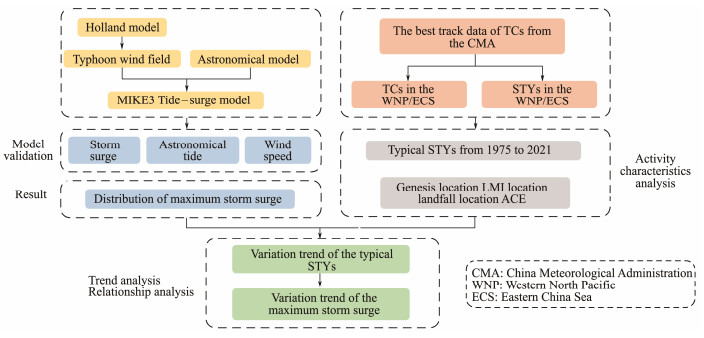
In this study, we counted the interannual variation characteristics of TY frequency in the ECS and the WNP basin from the best track data provided by the CMA. We determined the typical STYs from all landfall TCs on the East China Coasts and used the TY-tide-surge model to simulate the storm surge induced by typical STYs. We then validated the model by comparing the simulated and measured data of storm surge, wind speed, atmospheric pressure, and astronomical tide. Finally, we determined the relationship between the characteristics of historical STY activity and the characteristics of the storm surge induced by STYs in the ECS (Fig. 1).
|
Fig. 1 Framework of this study. |
The best track data of TYs were obtained from the CMA (http://tcdata.typhoon.org.cn), and the bathymetry data of the model came from the ETOPO1 dataset (https://maps.ngdc.noaa.gov). The coastline data were obtained from the GSHHG data (A Global Self-consistent, Hierarchical, High-resolution Geography Database (http://www.soest.hawaii.edu/pwessel/gshhg/). Linear regression was applied to process the missing value and obtain the linear trend line (Wang and Rao, 2002).
2.2 Tide-Surge ModelIn this study, a tide-surge mathematical model of the ECS was established on the basis of the MIKE3 Flow Model and the solution of the 3D incompressible Reynolds averaged Navier-Stokes equations subjected to the assumptions of Boussinesq and hydrostatic pressure.
2.3 Wind ModelAn analytical wind model from Holland was used to reconstruct the wind field for storm surge calculations (Yang et al., 2021). Pressure and wind were calculated as follows (Holland, 1980):
| $ P(r) = {P_0} + ({P_\infty } - {P_0}){\kern 1pt} {\kern 1pt} {\kern 1pt} \exp {\kern 1pt} {\kern 1pt} {\kern 1pt} {\kern 1pt} \left({ - {{\left({\frac{{{R_{\max }}}}{r}} \right)}^B}} \right), $ | (1) |
| $ {V_g} = \sqrt {\frac{B}{{{\rho _\alpha }}}({P_\infty } - {P_0}){\kern 1pt} {\kern 1pt} {\kern 1pt} {{\left({\frac{R}{r}} \right)}^B}\exp {\kern 1pt} {\kern 1pt} {\kern 1pt} {\kern 1pt} \left({ - {{\left({\frac{R}{r}} \right)}^B}} \right) + {{\left({\frac{{rf}}{2}} \right)}^2}} - \frac{{r|f|}}{2}, $ | (2) |
where r is the distance from the TY center, Pn is the ambient pressure, Pc is the central pressure, Rmax is the maximum wind radius, and Vg is the wind speed. Parameters B (Vickery et al., 2000) and Rmax (Knaff et al., 2007) were defined by:
| $ B = 1.881 - 0.00557{\kern 1pt} R - 0.01295{\kern 1pt} \varphi, $ | (3) |
| $ R = 56.92 - 0.1541R - 0.7372(\varphi - 25){\kern 1pt} . $ | (4) |
The moving wind field was calculated as follows (Ueno, 1981):
| $ {\vec V_d} = \vec V \cdot \exp {\kern 1pt} {\kern 1pt} {\kern 1pt} {\kern 1pt} \left({ - \frac{{{\rm{ \mathsf{ π} }}}}{4}\frac{{\left| {{\kern 1pt} {\kern 1pt} r - R} \right|}}{R}} \right), $ | (5) |
where Vd is the moving wind field.
The total TY wind speed field can be derived from the central symmetry and moving wind field as follows:
| $ {\vec V_T} = {c_1} \cdot {V_g} \cdot \left[ \begin{gathered} - \sin (\theta + \beta) \hfill \\ \cos (\theta + \beta) \hfill \\ \end{gathered} \right] + {c_2} \cdot {\vec V_d}, $ | (6) |
where VT is the empirical cyclone model, β is the inflow angle set as 25˚, c1, c2 are the parameters which decided by measured data, θ is the angle of the line which connects the TY center and any point line and the TY track.
2.4 Statistical Metrics for Assessing Model PerformanceTwo statistical metrics, namely, correlation coefficient (R) and root-mean-square error (RMSE), were used to quantify the skills of the tide-surge model in predicting winds, atmospheric pressures, tides, and storm surge parameters. The correlation coefficient examines the overall model performance by calculating the agreement between the simulated results and measured data, and a perfect agreement yields a value of 1. RMSE assesses the absolute error between the model results and the measurements. These two metrics were defined as follows:
| $ R(X, Y) = \frac{{\sum\nolimits_{i = 1}^N {({y_i} - \bar y)({x_i} - \bar x)} }}{{\sqrt {\sum\nolimits_{i = 1}^N {{{({\kern 1pt} {y_i} - \bar y)}^2}} \sum\nolimits_{i = 1}^N {{{({y_i} - \bar x)}^2}} } }}, $ | (7) |
| $ RMSE(X, Y) = \sqrt {\frac{1}{N}\sum\nolimits_{i = 1}^N {{{({y_i} - {x_i})}^2}} }, $ | (8) |
where X and Y are the measurement and model result samples, respectively; N is the number of samples; and
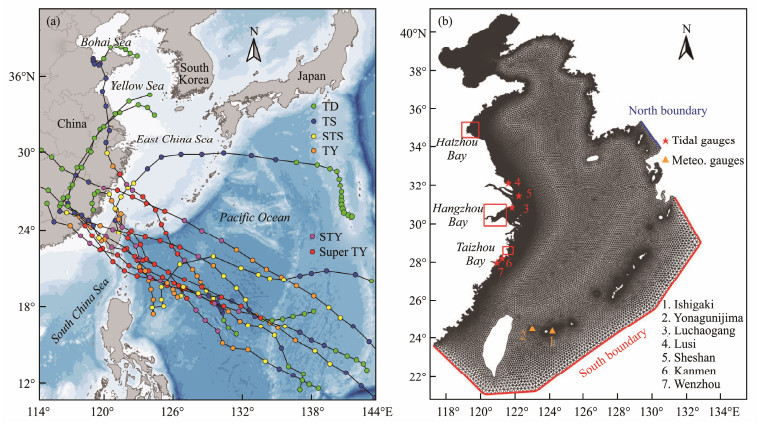
The computational domain (21˚ – 42˚N, 117˚ – 133˚E) covers the entire ECS Basin (Fig. 2). An unstructured triangular grid was used to divide the calculation area. The minimum resolution of the grid was 1.0 km along the coast of Jiangsu and Zhejiang, and the grid contained 100279 elements and 52183 vertices. The model was driven by two tidal open boundaries derived from the global tide model NAO.99 (Matsumoto et al., 2000) with eight tidal constituents (M2, S2, N2, K2, K1, O1, Q1, and P1). It was run with the water level set to zero at the initial time and a 43200 s period as the soft start interval. The drag coefficient was parameterized using an empirical formula (Wu, 1980). The roughness height ks of this 3D model was 0.005 m, and the horizontal eddy viscosity coefficient was 0.28.
|
Fig. 2 (a) Tracks of typical STYs (super typhoons which keep the SuperTY intensity when firstly landing the China); (b) Unstructured triangular mesh of the computational domain and locations of meteorological gages. |
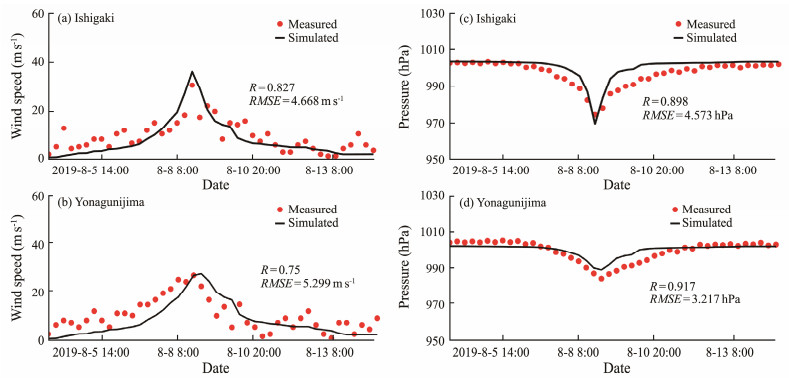
In this study, the stations selected for the comparison of the simulated and measured wind speed and atmospheric pressure were near the tracks of STYs (Fig. 2(b)). The validation results of the TY pressure field and wind field at the stations were obtained by comparing the wind speed and atmospheric pressure from the simulated and measured values (Fig. 3). As the TY approached the stations, the wind speed recorded increased gradually, and the peak value of the calculated wind speed was slightly larger than that of the measured wind speed. The lowest air pressure was simulated well at the stations. The results showed that the wind field and pressure fields constructed in this study reproduced the change in terms of wind speed and pressure during STYs, providing wind stress elements for the simulation of storm surges.
|
Fig. 3 Comparison of simulated wind speeds, atmospheric pressures and measured value at (a, c) Ishigaki and (b, d) Yonagunijima during TY Lekima (time zone: UTC). |
The storm surge tide level comprised astronomical tide levels and increased water levels caused by storm surges. An accurate simulation of the astronomical tide is the basis for calculating storm tide levels. The tidal table data from the Lusi and Sheshan stations along the coast of eastern China during August 2019 were selected for verification. The model calculated the tidal level under the independent action of astronomical tides and compared it with the tidal table data. The results showed that the calculated astronomical tide can reflect the astronomical tidal level of the tidal table data (Fig. 4). The values of RMSE were smaller than 0.2 m, and the correlation coefficients were larger than 0.98.

|
Fig. 4 Comparison of simulated and measured astronomical tide at tidal gages (a) Lusi (b) Kanmen (time zone: UTC + 8). |
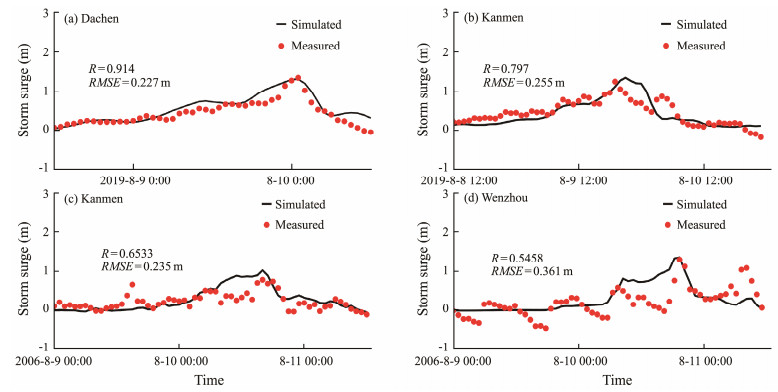
We analyzed the temporal changes in storm surges at several stations in the calculation area under the influence of TYs (Fig. 5). The measured data of the tidal gages Dachen and Kanmen (Yang et al., 2021) during TY Lekima and Kanmen and tidal gage Wenzhou during TY Saomai were selected to verify the storm surge. The results showed that the changes in the storm surge at the relevant stations during the TY were in good agreement with the storm surge simulation results.
|
Fig. 5 Comparison of the simulated and measured storm surge (storm tide minus astronomical tide) at (a) Dachen and (b) Kanmen during TY Lekima, and (c) Kanmen and (d) Wenzhou during TY Saomai (time zone: UTC + 8). |
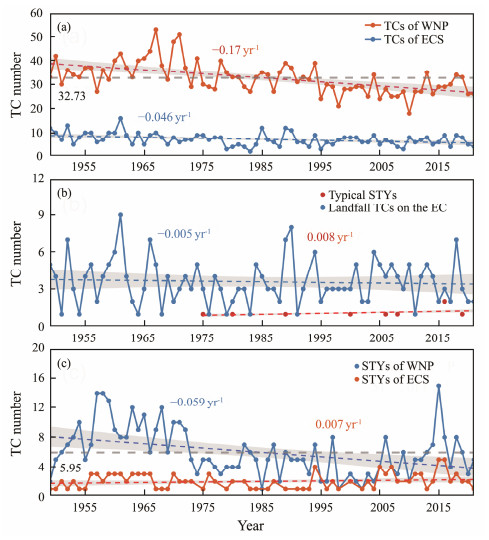
According to the TC best track data provided by the CMA, the annual frequency of STYs and TCs in the WNP basin showed a decreasing trend of varying degrees, and the annual frequency of TCs shows a significantly increasing trend (0.17 yr−1) from 1949 to 2021 (Zhang et al., 2018). This phenomenon is mainly affected by an increase in average global temperature (Murakami et al., 2020). In addition, the interannual variation in TCs and STYs in the WNP basin was quite different. The average annual frequency of TCs is approximately 30 (Fig. 6(a)) (Wu et al., 2015; Fang et al., 2022), and that of super TYs was approximately 6 (Fig. 6(c)).
|
Fig. 6 Frequency of (a) TCs generated in the WNP and TCs passing the ECS during 1949 – 2021 (b) landfall TCs on the EC during 1949 – 2021 and typical STYs in the ECS during 1975 – 2021 (c) STYs generating in the WNP and STYs passing the ECS during 1949 – 2021. Straight dotted lines represent linear regressions of time series. Gray bands represent the confidence interval. Gray lines represent the average value. |
The annual frequency of STYs in the WNP basin reached its maximum in 2015; at this time, the annual frequency of STYs passing through the ECS also reached its maximum. The TCs passing through the ECS exhibited a downward trend (Fig. 6(a)). However, these numbers only consider the first landfall location of TCs on the Eastern coast. According to the statistics of the first landfall of TC on the coast of the EC, its annual frequency showed a downward trend (0.006 yr−1). The annual frequency of all typical landfall STYs on the EC did not show any changes (−0.006 yr−1). Similarly, the interannual variation trend of typical STYs was not evident (Fig. 6(b)).
The interannual change in the frequency of STYs passing through the ECS showed a weak growth trend (0.004 yr−1), indicating that the EC coast is at risk of being affected by STY activity in the future (Fig. 6(c)). Historical records show that since 1975, the number of typical STYs passing through and landing on the ECS has been relatively small (Fig. 6(b)).
3.5 Maximum Storm Surge Induced by Typical STYsThe impact area of landfall TCs in the ECS basin is mainly concentrated along the coast of Zhejiang, Fujian, and Taiwan Provinces (Feng et al., 2018; Wu et al., 2021). Owing to their landfall locations and offshore topography, the coast of Zhejiang, Fujian, and Taiwan are often affected by landfall TCs (Feng et al., 2018; Wu et al., 2021). On the basis of previous statistical results, a numerical simulation of typical STYs was performed.
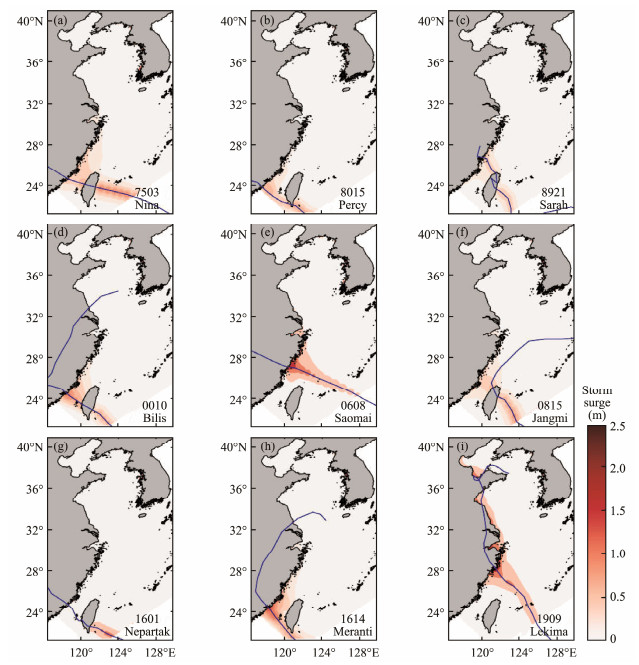
TC tracks affect the spatial distribution of storm surges (Du et al., 2020). According to historical records, typical STYs hit eastern China along two tracks: TYs moving northward after landfall on the coast of Zhejiang, Fujian, and Taiwan, and TYs landing on a nearly straight track and extending inland. Under the influence of different tracks, the distribution of the maximum storm surge caused by typical STYs also showed significant spatial differences. The maximum storm surge caused by typical STYs in the basin was found on the right side of the landfall location (Wu et al., 2021) (Fig. 7).
|
Fig. 7 Results of simulated maximum storm surge (storm tide minus astronomical tide) during typical STYs. Blue lines are the tracks of typical STYs. |
From the aspect of the landfall location, six typical STYs landed on the coast of Taiwan, two landed on the coast of Zhejiang, and one landed at Fujian, directly impacting mainland China (Fig. 7). Affected by the shoreline and topography, the maximum storm surge was generally large in the coastal basin near the landfall location, and TY storm surges were likely to form high backwaters in the gulf. Taking TY Lekima as an example, the maximum storm surge in Hangzhou Bay, Taizhou Bay, and Haizhou Bay was relatively large, exceeded 2.5 m in Hangzhou and Taizhou Bay, and gradually decreased toward the open sea (Wu et al., 2021; Yang et al., 2021) (Fig. 7(i)).
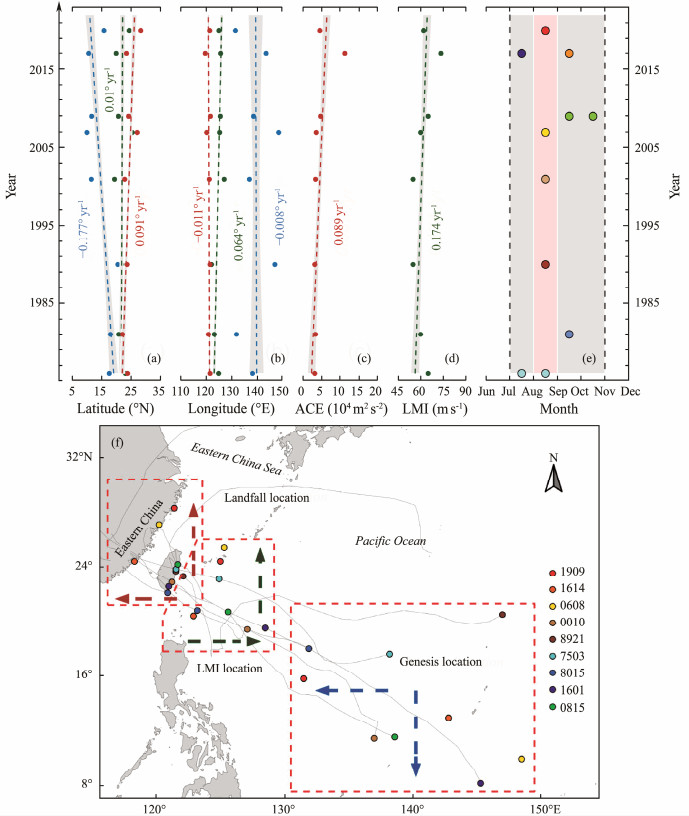
4 DiscussionThe interannual variation in TCs has an important influence on the ensuing storm surge. The genesis location, landfall location (the first landfall location of TCs on the coast of China), LMI, and ACE index (Bell et al., 2000) were used to study the interannual change in the characteristics of typical STY activity in the ECS in the context of climate change. In the WNP Basin, typical STYs occurred in summer and autumn from 1975 to 2021 and were found to be mainly concentrated in August (Fig. 8(e)). The average annual genesis and landfall locations are shown in Fig. 8(a). We plotted their annual time series for comparison with the average change in typical STY genesis locations. Previous studies pointed out that the annual sequence of the average genesis location of TCs in the WNP basin from 1986 to 2017 revealed a trend of westward and poleward migration, and the changes in the genesis location of TCs were significant for all TCs (Yang et al., 2021).
|
Fig. 8 (a) Latitude (b) longitude of annual mean genesis location, LMI location and landfall location; (c) ACE (d) annual mean LMI (e) season (f) spatial distribution of the typical STYs from 1975 to 2021. Blue points are the mean genesis location, green points are the mean LMI location, and red points are the mean landfall location of typical STYs. |
Previous research reported the westward and poleward migration trends of TCs in the WNP Basin (Wu et al., 2015; Chen et al., 2020). The annual average genesis location of typical STYs was roughly 10˚ – 20˚N, and the latitude and longitude series showed a trend of −0.177˚ yr−1 and −0.008˚ yr−1 from 1975 to 2021 (Figs. 8(a – b)). In other words, the average genesis location of typical STYs moved westward and equatorially to the equator and to the coast of the Eastern Philippines. Here, we introduced the LMI Latitude (LMIA) and LMI Longitude (LMIO) (Kossin et al., 2014) to analyze variations in the annual average LMI location of typical STYs (Figs. 8(a – b), (f)). LMI can describe the intensity of TCs and can be obtained from the maximum value of 2-minute mean maximum sustained wind speed near the TC center during its lifetime as shown below:
| $ LMI = \mathop {\max }\limits_{1{\kern 1pt} {\kern 1pt} \leqslant {\kern 1pt} {\kern 1pt} i{\kern 1pt} {\kern 1pt} \leqslant {\kern 1pt} {\kern 1pt} N} v({t_i}), $ | (9) |
where ti represents the lifetime interval of TCs, N is the end interval of TCs, and v(ti) is the 2-minute mean maximum sustained wind speed for every interval according to the best track dataset. The annual mean LMI value showed an increasing trend with the strengthening of the annual average location trend in the eastward and poleward migration (Figs. 8(a – b), (d), (f)).
The variation in the landfall location of TCs on the coast of East China reflects their impact on this region. The annual average landfall location showed a trend of −0.013˚ yr−1 in the longitudinal series and a poleward migration trend in the latitude series (Figs. 8(a – b)). The landfall location of typical STYs exhibited an insignificant tendency to migrate to high latitudes and low longitudes, prompting typical STYs to move toward the coast of North China (Figs. 8(a – b), (f)). The annual average genesis and LMI locations for typical STYs in the WNP Basin showed a poleward migration trend (Figs. 8(a – b), (d), (f)).
Accumulated Cyclone Energy (ACE) was introduced as a relatively comprehensive physical quantity that describes the intensity of TCs and can be calculated from the square sum of the maximum sustained wind speed every 6 hours (Bell et al., 2000) as shown below:
| $ ACE = \sum\limits_{i = 1}^N {\sum\limits_{{t_{oi}}}^{{t_{fi}}} {v{{(t)}^{{\kern 1pt} {\kern 1pt} 2}}} }, $ | (10) |
where t represents the lifetime of each TC, N is the total number of TCs, toi is the original record of each TC, tfi is the final record of each TC, and v(t) is the maximum sustained wind speed for every 6 h interval according to the best track dataset. Only the lifetime maximum intensity of a TC above a tropical storm (vmax ≥ 17.2 m s−1) was considered in this study. An increasing ACE indicates a rise in the intensity of the TCs and would cause a large loss. In most years, ACE was less than 50000 m2 s−2, and the maximum ACE value in 2016 was mainly caused by two STYs (Fig. 8(c)).
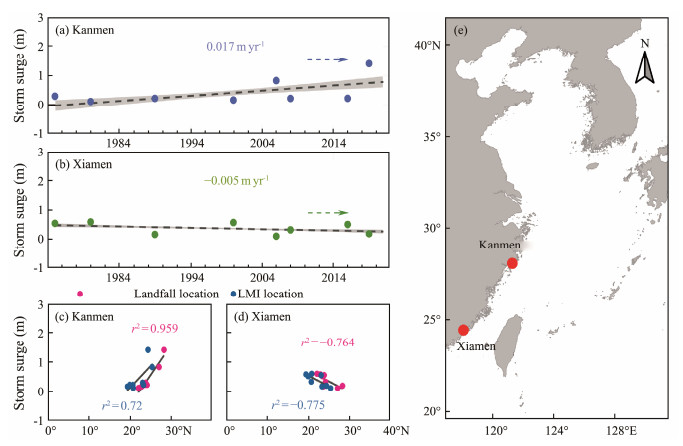
Typical STY activity in the ECS affects the spatial distribution of storm surges in the region. On the basis of the analysis of the characteristics of typical STY activity in the ECS, the change of storm surge time series at the station was also analyzed. The average maximum storm surge at stations Kanmen and Xiamen showed increasing (0.016 m yr−1) and decreasing (0.007 m yr−1) trends, respectively (Figs. 9(a – b)). In addition, the maximum storm surge at those two stations showed a strong correlation with the interannual average landfall latitude and LMIA. When the poleward trend of the annual average latitude of landfall location and LMI location was strengthened, the maximum storm surge at Kanmen and Xiamen stations showed upward and downward trends, respectively (Figs. 9(c – d)). This finding revealed that the maximum storm surge zone in offshore China gradually moved northward from the perspective of typical stations. The trend variation of storm surges can be used as a reference for future coastal disaster prevention and reduction.
|
Fig. 9 Maximum storm surge (storm tide minus astronomical tide) of stations (a) Kanmen and (b) Xiamen; relationship between the storm surge at stations (c) Kanmen and (d) Xiamen and the latitudes (Amaranth dots and blue dots are respectively latitudes of typical STYs' LMI location, landfall locations) from 1975 to 2021. (e) Location of stations Kanmen and Xiamen. |
Using the MIKE3 model, this study simulated the storm surge during a typical STY in the ECS using a restructured wind field. Combined with measured data, the simulated storm surge was verified. From the analysis of the historical activity of typical STYs and the simulation of storm surges, the following conclusions can be drawn:
1) In the WNP basin, the annual frequency of STYs and TCs showed a decreasing trend of varying degrees, and the annual frequency of TC changed significantly (0.17 yr−1) from 1949 to 2021. A great difference in the interannual frequency variation was found between STYs and TCs in WNP and ECS. The time series of TC landing on the East China Coasts showed an insignificantly downward trend. Meanwhile, the typical STYs showed the opposite trend with weak growth and rare occurrence.
2) Affected by the track and terrain, the maximum storm surge on the right side of the landfall location was greater than that on the left side. Zhejiang, Fujian, and Taiwan, which are along the East China Coasts, were highly vulnerable to frontal hits by typical STYs.
3) Affected by climate change, the annual average genesis location, LMI location, and landfall location of typical STYs in the WNP basin showed a significant poleward migration trend. The risk of a direct hit by typical STYs in North China exhibited an increasing trend. The maximum storm surge zone moved northward. The LMI showed an annual upward trend, and the disaster risk brought by the Yangtze River Estuary in China was also increasing.
4) Affected by the characteristics of typical STY activities in the ECS, the maximum storm surge area showed a poleward migration trend. Taking Xiamen and Kanmen stations as examples, the maximum storm surge at Xiamen station decreased as the average landfall location of typical STYs moves northward. Meanwhile, the annual sequence of maximum storm surge at Kanmen station showed an increasing trend. These results revealed that the coast of North China is facing the threat of potential storm surges.
AcknowledgementsThis work was supported by four funds, including the National Key Research and Development Program of China (No. 2022YFC3106102), the Marine Science and Technology Innovation Project of Jiangsu Province (Nos. JSZRHYKJ202105, JSZRHYKI202303), the Nantong Social and Livelihood Science and Technology Project (Nos. MS12022009, MS22022082, MS2202 2083), and the Project on Excellent Post-Graduate Dissertation of Hohai University (No. 422003470).
Bell, G. D., Halpert, M. S., Schnell, R. C., Higgins, R. W., Lawrimore, J., Kousky, V. E., et al., 2000. Climate assessment for 1999. Bulletin of the American Meteorological Society, 81(6): S1-S50. DOI:10.1175/1520-0477(2000)081<1328:CAF>2.3.CO;2 (  0) 0) |
Camargo, S. J., and Sobel, A. H., 2005. Western North Pacific tropical cyclone intensity and ENSO. Journal of Climate, 18(15): 2996-3006. DOI:10.1175/JCLI3457.1 (  0) 0) |
Chen, Y., Duan, Z. D., Yang, J., Deng, Y., Wu, T. T., and Ou, J. P., 2020. Typhoons of western North Pacific Basin under warming climate and implications for future wind hazard of East Asia. Journal of Wind Engineering and Industrial Aerodynamics, 208: 1-14. DOI:10.1016/j.jweia.2020.104415 (  0) 0) |
Dabanli, I., Şişman, E., Güçlü, Y. S., Birpınar, M. E., and Şen, Z., 2021. Climate change impacts on sea surface temperature (SST) trend around Turkey seashores. Acta Geophysica, 69(1): 295-305. DOI:10.1007/s11600-021-00544-2 (  0) 0) |
Deng, Z. F., Wang, Z. L., Wu, X. S., Lai, C. G., and Zeng, Z. Y., 2022. Strengthened tropical cyclones and higher flood risk under compound effect of climate change and urbanization across China's Greater Bay area. Urban Climate, 44: 1-16. DOI:10.1016/J.UCLIM.2022.101224 (  0) 0) |
Du, M., Hou, Y. J., Hu, P., and Wang, K., 2020. Effects of typhoon paths on storm surge and coastal inundation in the Pearl River Estuary, China. Remote Sensing, 12(11): 1851. DOI:10.3390/rs12111851 (  0) 0) |
Fang, G. S., Wei, M. M., Zhao, L., Xu, K., Cao, S. Y., and Ge, Y. J., 2022. Site- and building height-dependent design extreme wind speed vertical profile of tropical cyclone. Journal of Building Engineering, 62: 1-21. DOI:10.1016/j.jobe.2022.105322 (  0) 0) |
Feng, X. R., Li, M. J., Yin, B. S., Yang, D. Z., and Yang, H. W., 2018. Study of storm surge trends in typhoon-prone coastal areas based on observations and surge-wave coupled simulations. International Journal of Applied Earth Observation and Geoinformation, 68: 272-278. DOI:10.1016/j.jag.2018.01.006 (  0) 0) |
Feng, X. R., Yin, B. S., and Yang, D. Z., 2012. Effect of hurricane paths on storm surge response at Tianjin, China. Estuarine, Coastal and Shelf Science, 106: 58-68. DOI:10.1016/j.ecss.2012.04.032 (  0) 0) |
Fossell, K. R., Ahijevych, D., Morss, R. E., Snyder, C., and Davis, C., 2017. The practical predictability of storm tide from tropical cyclones in the Gulf of Mexico. Monthly Weather Review, 145(12): 5103-5121. DOI:10.1175/MWR-D-17-0051.1 (  0) 0) |
Holland, G. J., 1980. An analytical model of the wind and pressure profiles in hurricanes. Monthly Weather Review, 108(8): 1212-1218. DOI:10.1175/1520-0493(1980)108<1212:AAMOTW>2.0.CO;2 (  0) 0) |
Knaff, A. J., Sampson, C. R., Demaria, M., Marchok, P. T., Gross, M. J., and Mcadie, J. C., 2007. Statistical tropical cyclone wind radii prediction using climatology and persistence. Weather and Forecasting, 22(4): 781-791. DOI:10.1175/WAF1026.1 (  0) 0) |
Kossin, J. P., Emanuel, K. A., and Vecchi, G. A., 2014. The poleward migration of the location of tropical cyclone maximum intensity. Nature, 509: 349-352. DOI:10.1038/nature13278 (  0) 0) |
Lu, X. Q., Yu, H., Ying, M., Zhao, B. K., Zhang, S., Lin, L. M., et al., 2021. Western North Pacific tropical cyclone database created by the China Meteorological Administration. Advances in Atmospheric Sciences, 38(4): 690-699. DOI:10.1007/s00376-020-0211-7 (  0) 0) |
Matsumoto, K., Takanezawa, T., and Ooe, M., 2000. Ocean tide models developed by assimilating TOPEX/POSEIDON altimeter data into hydrodynamical model: A global model and a regional model around Japan. Journal of Oceanography, 56: 567-581. DOI:10.1023/A:1011157212596 (  0) 0) |
Murakami, H., Delworth, T. L., Cooke, W. F., Zhao, M., Xiang, B. Q., and Hsu, P. C., 2020. Detected climatic change in global distribution of tropical cyclones. Proceedings of the National Academy of Sciences of the United States of America, 117(20): 10706-10714. DOI:10.1073/pnas.1922500117 (  0) 0) |
Rego, J. L., and Li, C. Y., 2009. On the importance of the forward speed of hurricanes in storm surge forecasting: A numerical study. Geophysical Research Letters, 36(7): 1-5. DOI:10.1029/2008GL036953 (  0) 0) |
Renner, A. H. H., Gerland, S., Haas, C., Spreen, G., Beckers, J. F., Hansen, E., et al., 2014. Evidence of Arctic sea ice thinning from direct observations. Geophysical Research Letters, 41(14): 5029-5036. DOI:10.1002/2014GL060369 (  0) 0) |
Ueno, T., 1981. Numerical computations of the storm surges in Tosa Bay. Journal of the Oceanographical Society of Japan, 37: 61-73. DOI:10.1007/BF02072559 (  0) 0) |
Vickery, P. J., Skerlj, P. F., Steckley, A. C., and Twisdale, L. A., 2000. Hurricane wind field model for use in hurricane simulations. Journal of Structural Engineering, 126(10): 1203-1221. DOI:10.1061/(asce)0733-9445(2000)126:10(1203 (  0) 0) |
Wang, Q. H., and Rao, J. N. K., 2002. Empirical likelihood-based inference in linear models with missing data. Scandinavian Journal of Statistics, 29(3): 563-576. DOI:10.1111/1467-9469.00306 (  0) 0) |
Wang, Y. Q., Rao, Y. J., Tan, Z. M., and Schönemann, D., 2015. A statistical analysis of the effects of vertical wind shear on tropical cyclone intensity change over the western North Pacific. Monthly Weather Review, 143: 3434-3453. DOI:10.1175/MWR-D-15-0049.1 (  0) 0) |
Wu, J., 1980. Wind-stress coefficients over sea surface near neutral conditions – A revisit. Journal of Physical Oceanography, 10: 727-740. DOI:10.1175/1520-0485(1980)010<0727:WSCOSS>2.0.CO;2 (  0) 0) |
Wu, L. G., Wang, C., and Wang, B., 2015. Westward shift of western North Pacific tropical cyclogenesis. Geophysical Research Letters, 42(5): 1537-1542. DOI:10.1002/2015GL063450 (  0) 0) |
Wu, L. G., Zhao, H. K., Wang, C., Cao, J., and Liang, J., 2022. Understanding of the effect of climate change on tropical cyclone intensity: A review. Advances in Atmospheric Sciences, 39(2): 205-221. DOI:10.1007/S00376-021-1026-X (  0) 0) |
Wu, R. H., Wu, S. M., Chen, T. H., Yang, Q. H., Han, B., and Zhang, H., 2021. Effects of wave-current interaction on the eastern China coastal waters during super typhoon Lekima (2019). Journal of Physical Oceanography, 51(5): 1611-1636. DOI:10.1175/JPO-D-20-0224.1 (  0) 0) |
Xiao, M. Z., 2021. Change in the occurrence frequency of landfalling and non-landfalling tropical cyclones over the Northwest Pacific. Journal of Climate, 34(8): 3145-3155. DOI:10.1175/JCLI-D-20-0647.1 (  0) 0) |
Yang, W. K., Yang, B., Yang, Q. Y., Ou, J., and Xu, X. F., 2021. Simulation of storm surge and wave due to typhoon Lekima in 2019. IOP Conference Series: Earth and Environmental Science, 787(1): 1-10. DOI:10.1088/1755-1315/787/1/012087 (  0) 0) |
Ying, M., Zhang, W., Yu, H., Lu, X. Q., Feng, J. X., Fan, Y. X., et al., 2014. An overview of the China Meteorological Administration Tropical Cyclone Database. Journal of Atmospheric and Oceanic Technology, 31(2): 287-301. DOI:10.1175/JTECH-D-12-00119.1 (  0) 0) |
Zhang, W. S., Teng, L., Zhang, J. S., Xiong, M. J., and Yin, C. T., 2019. Numerical study on effect of tidal phase on storm surge in the South Yellow Sea. Journal of Oceanology and Limnology, 37(6): 2037-2055. DOI:10.1007/s00343-019-8277-8 (  0) 0) |
Zhang, W., Vecchi, G. A., Murakami, H., Villarini, G., Delworth, T. L., Yang, X. S., et al., 2018. Dominant role of Atlantic Multidecadal Oscillation in the recent decadal changes in western North Pacific tropical cyclone activity. Geophysical Research Letters, 45(1): 354-362. DOI:10.1002/2017GL076397 (  0) 0) |
Zhao, J. W., Zhan, R. F., Wang, Y. Q., and Xu, H. M., 2018. Contribution of the interdecadal Pacific Oscillation to the recent abrupt decrease in tropical cyclone genesis frequency over the western North Pacific since 1998. Journal of Climate, 31(20): 8211-8224. DOI:10.1175/JCLI-D-18-0202.1 (  0) 0) |
 2024, Vol. 23


